
Comparable Sales Near 164 Cabo Cruces Drive, Henderson, NV 89011
1st Realty · Comparable sales report · 1st.estate · October 20, 2026
Read the Lake Las Vegas neighborhood guide →
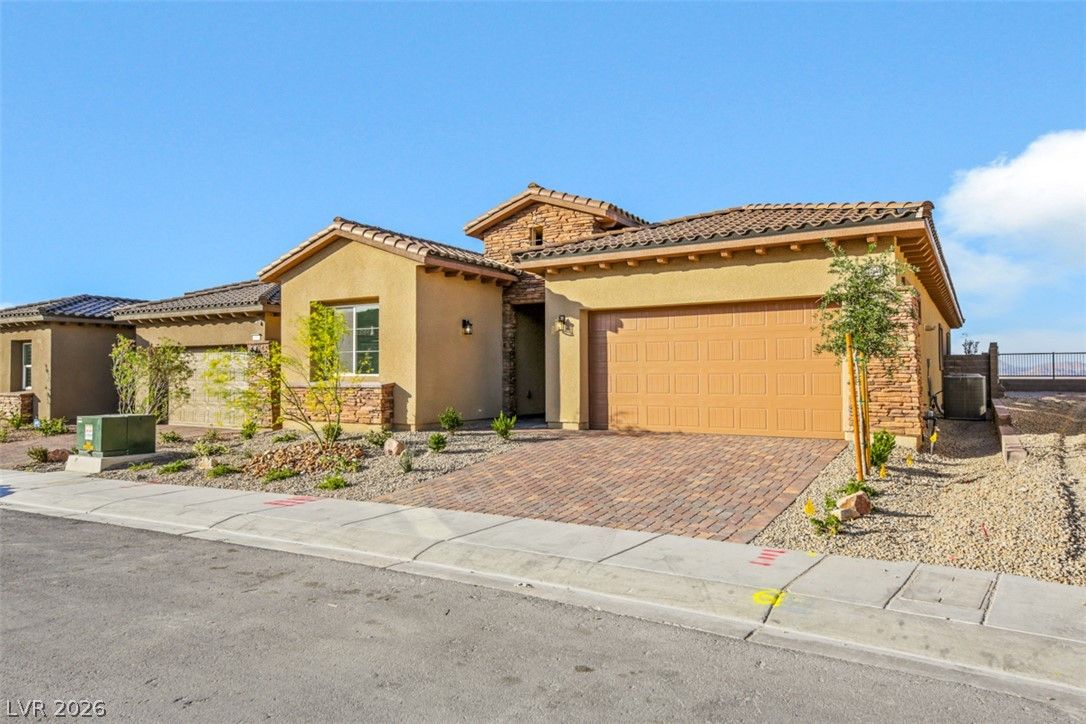
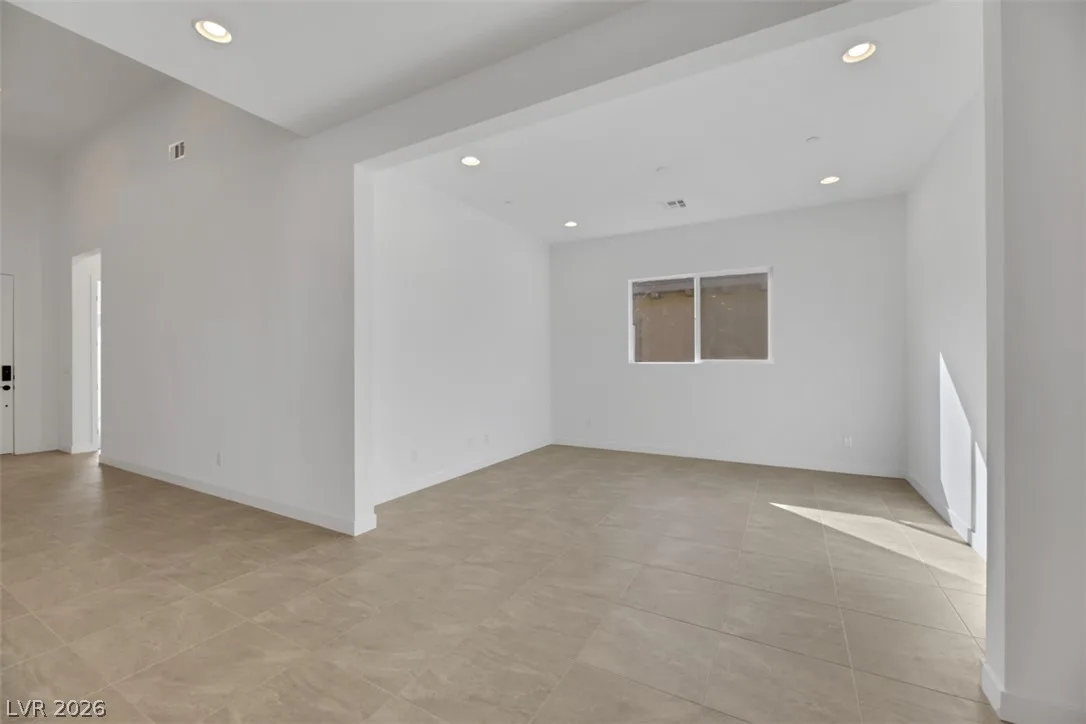
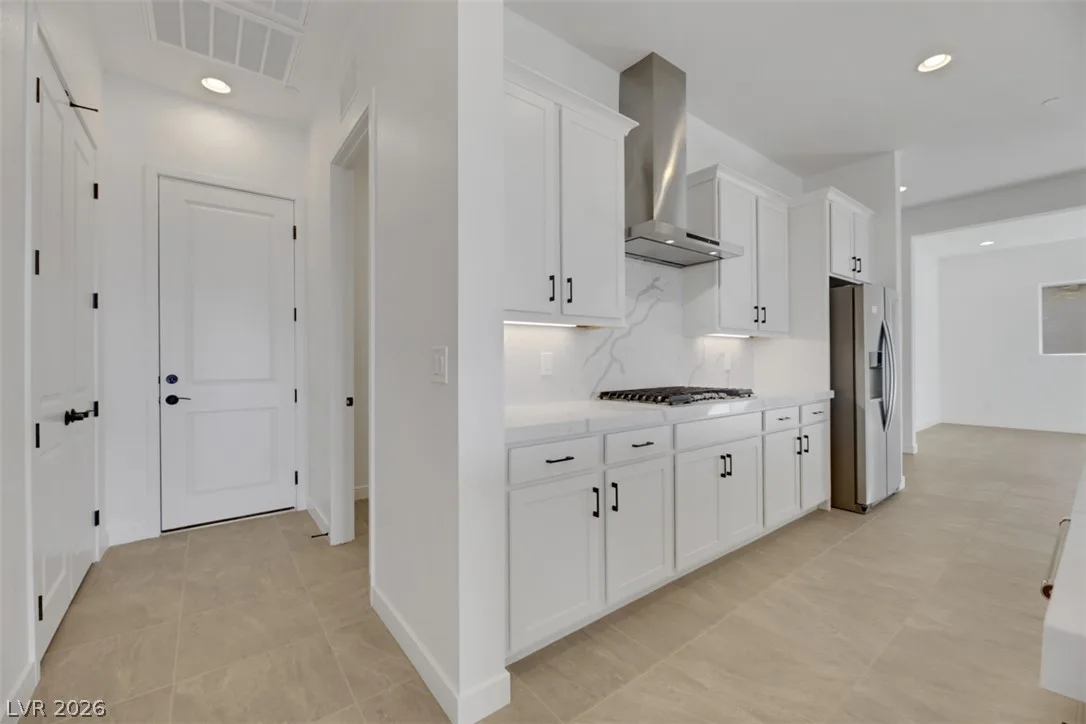
164 Cabo Cruces Drive, Henderson, NV 89011
Status: Sold
$2,770 Sold Price
$1
$ / Sq Ft
2,296
Living Area
5,227 sqft
Lot Size
3
Beds
3
Baths
2024
Year Built
Search Parameters
Property Type
Status
Radius
Sold Within
Beds
Baths
Living Area (Sq Ft)
Lot Size (Sq Ft)
This comp search reflects your current search parameters — adjust the filters above as needed for a more accurate estimate.
Estimated Value
—
Average $/Sqft
—
Check one or more comps below to calculate an estimate.
Nearest 10 of 47 comparable sales and listings within 1 mile of this home. Use the filters above and press Search to refine.
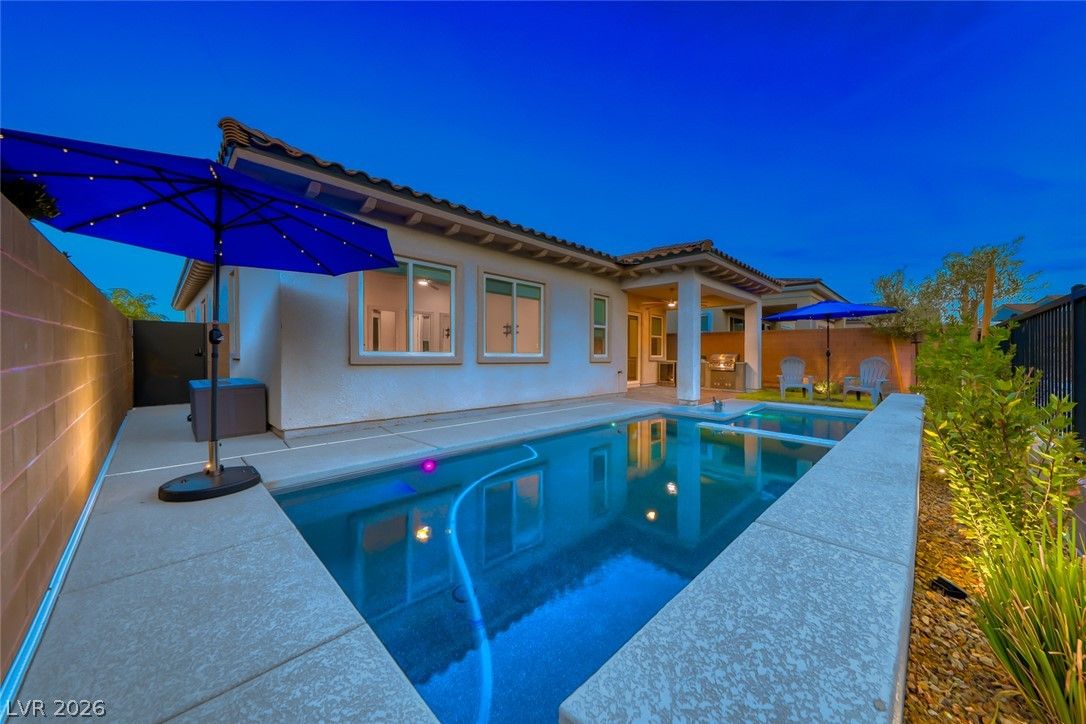
167 Cabo Cruces DriveActive
$699,0003 bd3 ba2,296 sqft$304/sqft0.03 mi46 days
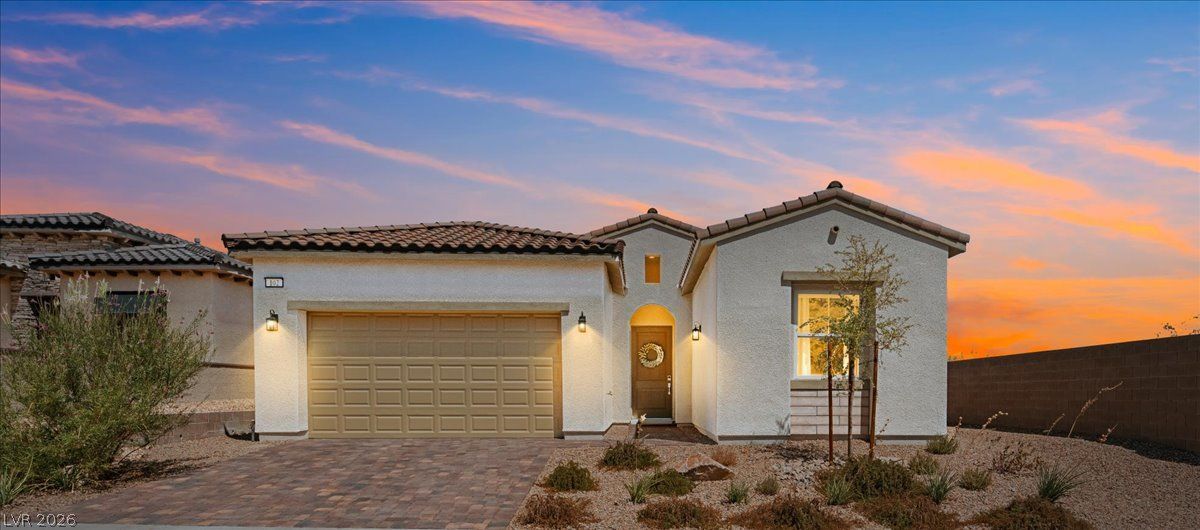
102 Amalfi Coast WayActive
$574,9002 bd3 ba2,237 sqft$257/sqft0.06 mi36 days
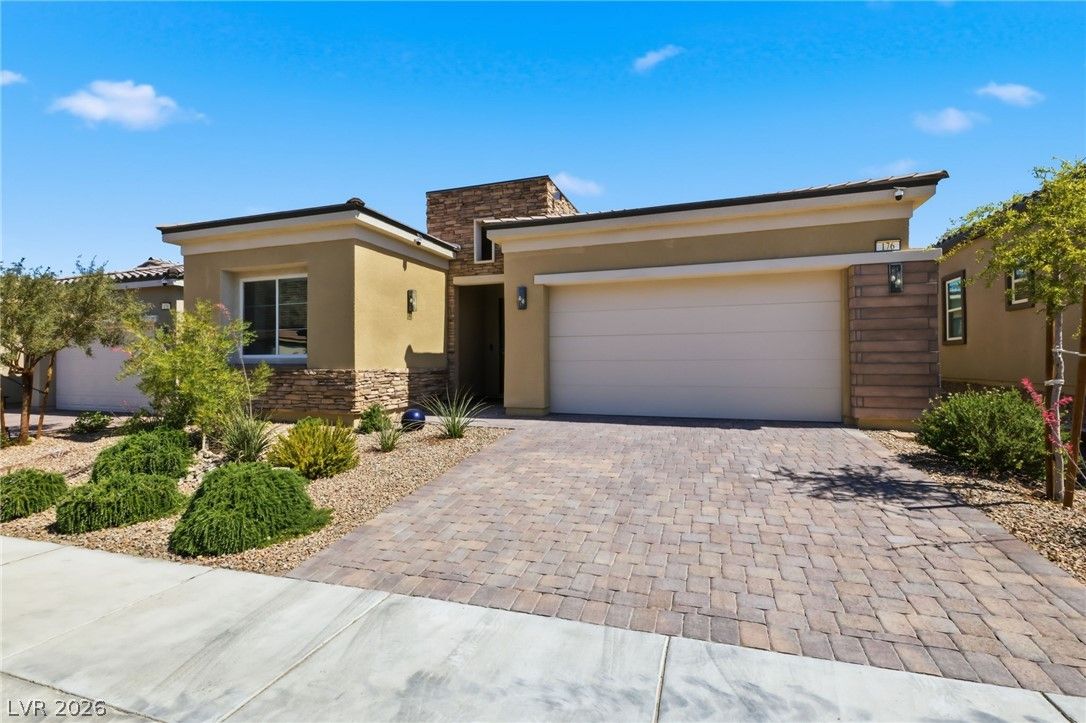
176 Cabo Cruces DriveActive
$669,0003 bd3 ba2,296 sqft$291/sqft0.06 mi29 days
$665,0003 bd3 ba2,296 sqft$290/sqft0.06 mi3 daysSold 2026-06-26
$564,4853 bd3 ba2,230 sqft$253/sqft0.07 mi49 daysSold 2026-06-29
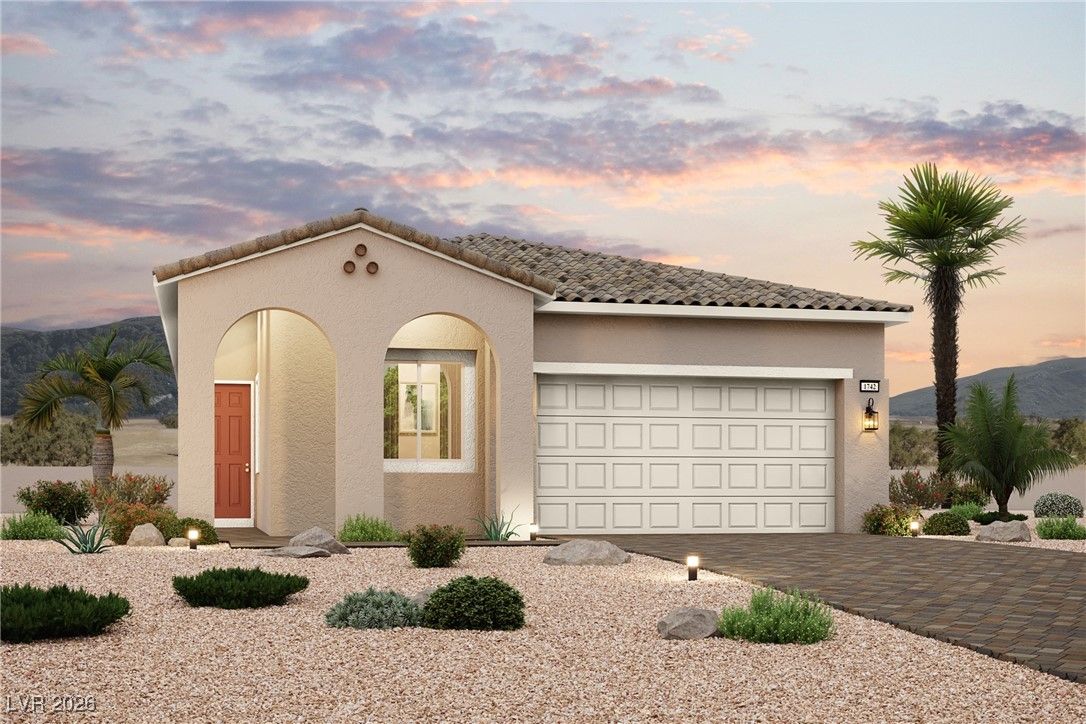
$513,0003 bd2 ba1,742 sqft$294/sqft0.07 mi189 daysSold 2026-08-31
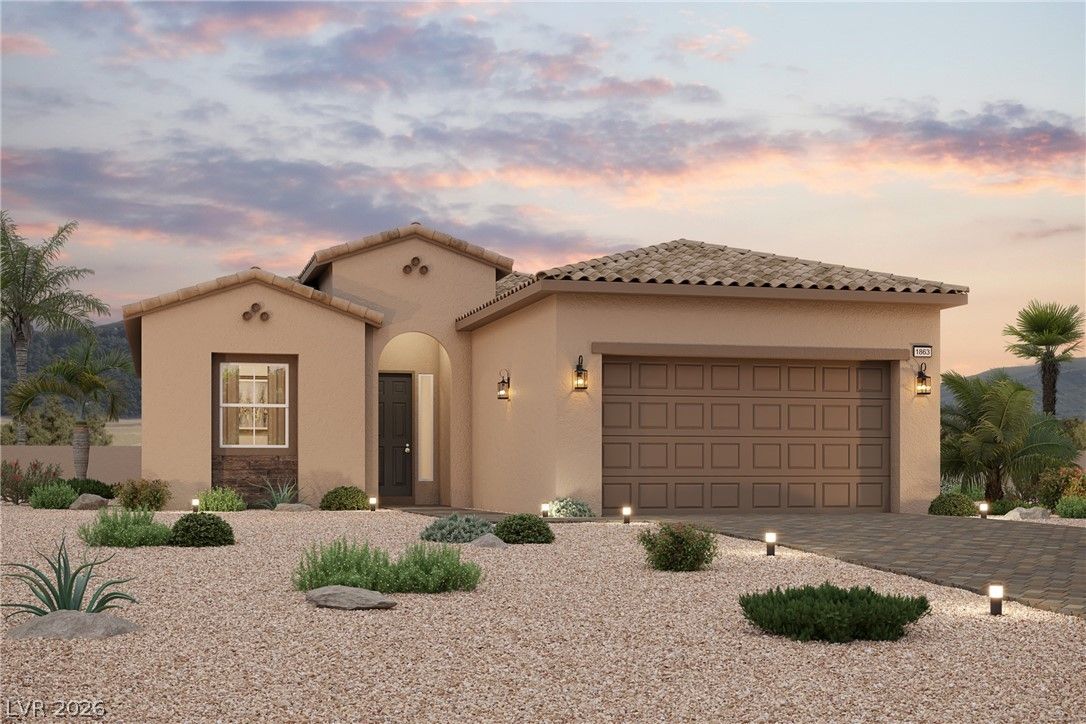
72 Atrani Bay CourtPending
$529,0002 bd3 ba1,863 sqft$284/sqft0.08 mi182 days
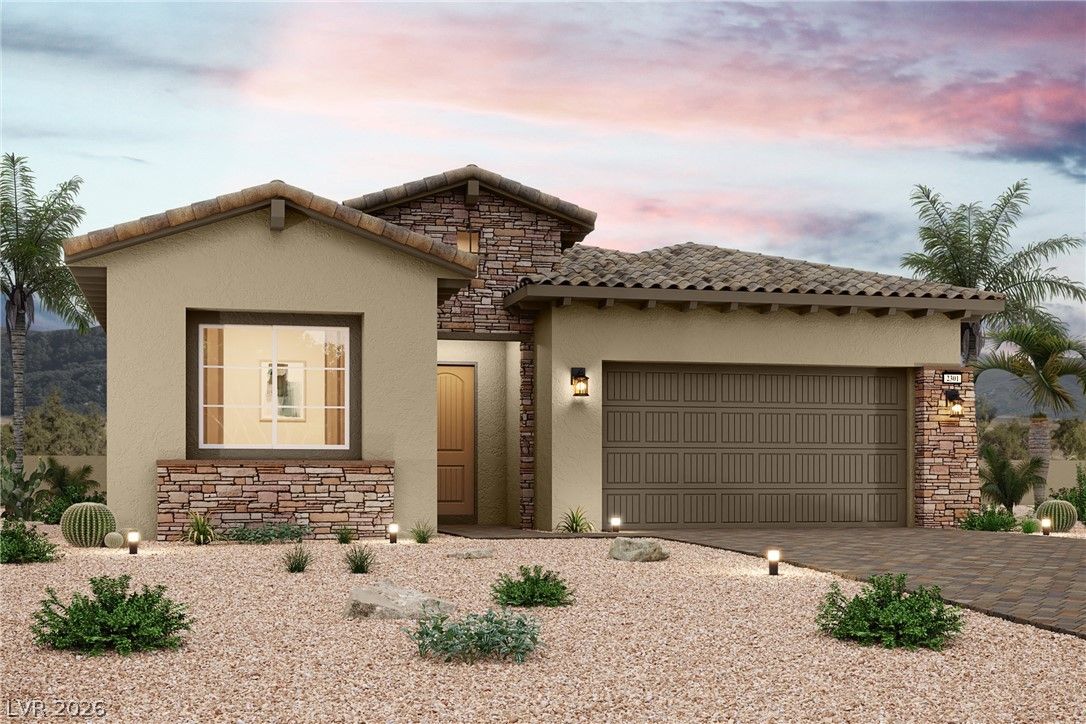
184 Cabo Cruces DrivePending
$682,8554 bd3 ba2,301 sqft$297/sqft0.10 mi85 days
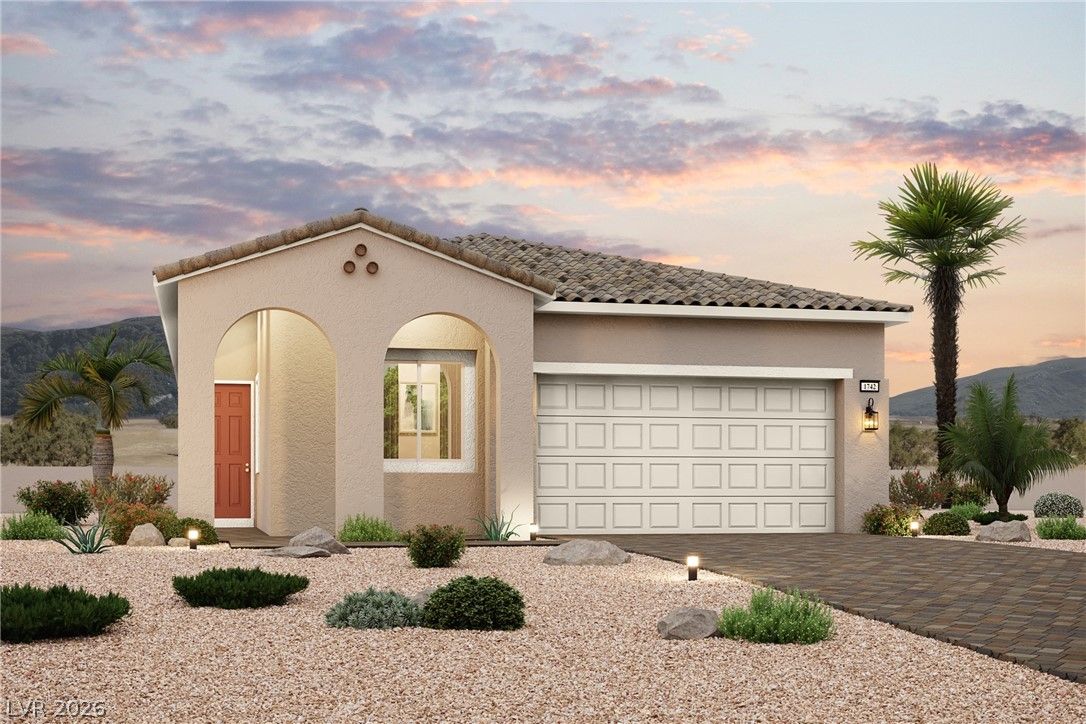
$520,0003 bd2 ba1,742 sqft$299/sqft0.10 mi91 daysSold 2026-09-21
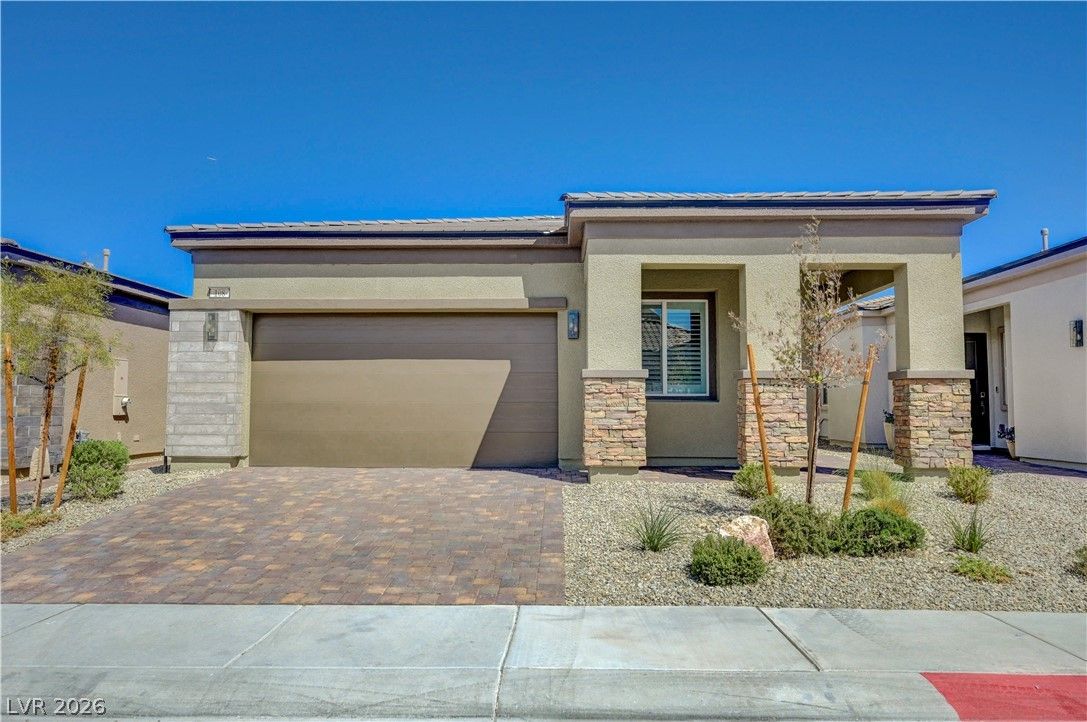
108 Barkset WayActive
$489,9903 bd3 ba1,724 sqft$284/sqft0.11 mi4 days
Nearest comparable sales and listings
12 comparables · median price $563,138 · range $489,990 – $699,000 · median $/sq ft $291 · average $/sq ft $284
| Address | Status | Price | $/Sq Ft | Bd / Ba | Sq Ft | Sold / market time | Distance |
|---|---|---|---|---|---|---|---|
| 167 Cabo Cruces Drive | Active | $699,000 | $304 | 3 / 3 | 2,296 | 46 days on market | 0.03 mi |
| 102 Amalfi Coast Way | Active | $574,900 | $257 | 2 / 3 | 2,237 | 36 days on market | 0.06 mi |
| 176 Cabo Cruces Drive | Active | $669,000 | $291 | 3 / 3 | 2,296 | 29 days on market | 0.06 mi |
| 108 Amalfi Coast Way | Sold | $665,000 | $290 | 3 / 3 | 2,296 | Sold 2026-06-26 | 0.06 mi |
| 74 Atrani Bay Court | Sold | $564,485 | $253 | 3 / 3 | 2,230 | Sold 2026-06-29 | 0.07 mi |
| 98 Ibiza Lake Drive | Sold | $513,000 | $294 | 3 / 2 | 1,742 | Sold 2026-08-31 | 0.07 mi |
| 72 Atrani Bay Court | Pending | $529,000 | $284 | 2 / 3 | 1,863 | 182 days on market | 0.08 mi |
| 184 Cabo Cruces Drive | Pending | $682,855 | $297 | 4 / 3 | 2,301 | 85 days on market | 0.10 mi |
| 123 Ibiza Lake Drive | Sold | $520,000 | $299 | 3 / 2 | 1,742 | Sold 2026-09-21 | 0.10 mi |
| 108 Barkset Way | Active | $489,990 | $284 | 3 / 3 | 1,724 | 4 days on market | 0.11 mi |
| 127 Barkset Way | Active | $519,000 | $298 | 2 / 3 | 1,742 | 140 days on market | 0.11 mi |
| 88 Ibiza Lake Drive | Sold | $561,790 | $252 | 2 / 3 | 2,230 | Sold 2026-06-22 | 0.11 mi |


