
Comparable Sales Near 1652 Rockcrest Hills Avenue, Henderson, NV 89052
1st Realty · Comparable sales report · 1st.estate · October 20, 2026
Read the Sun City Anthem neighborhood guide →
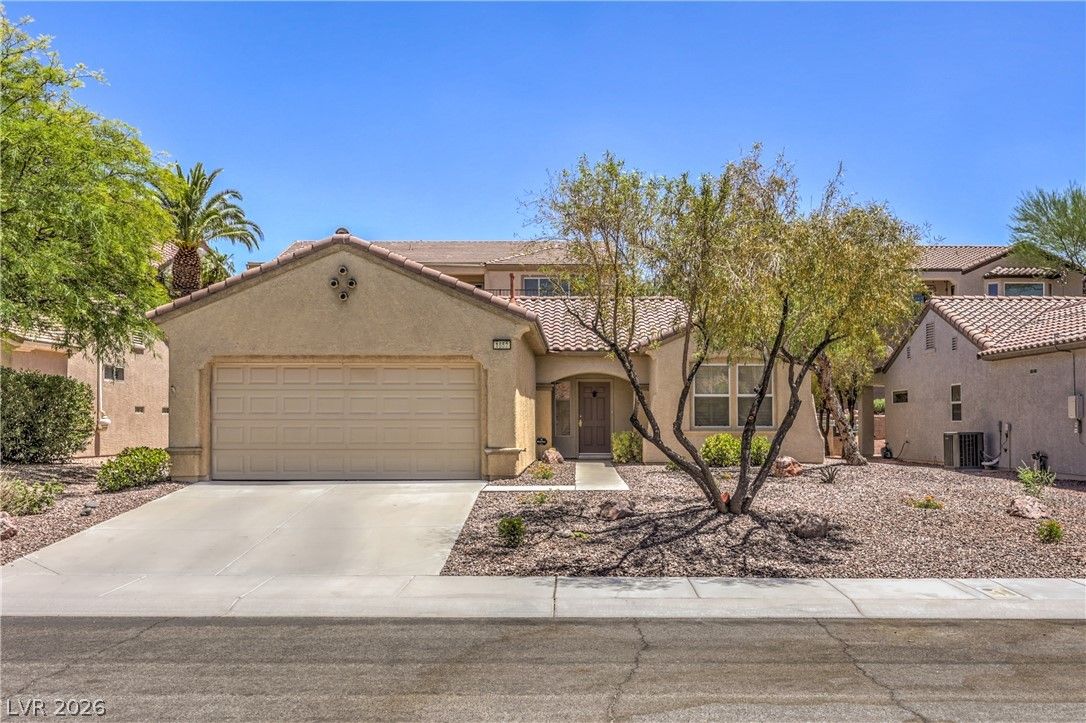
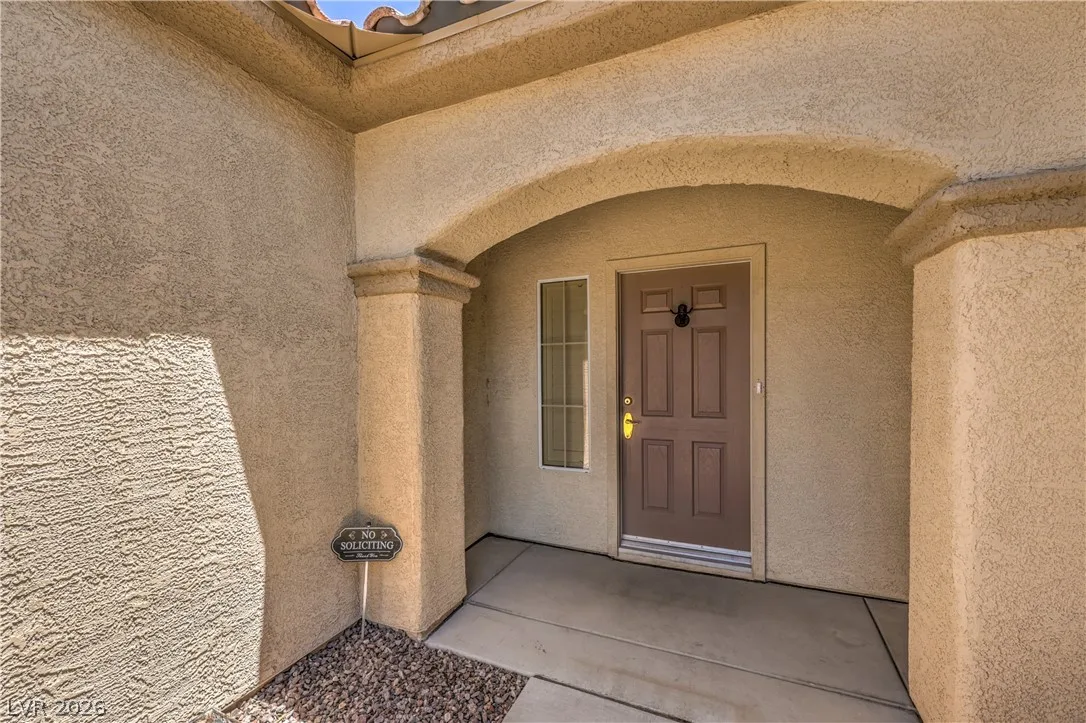
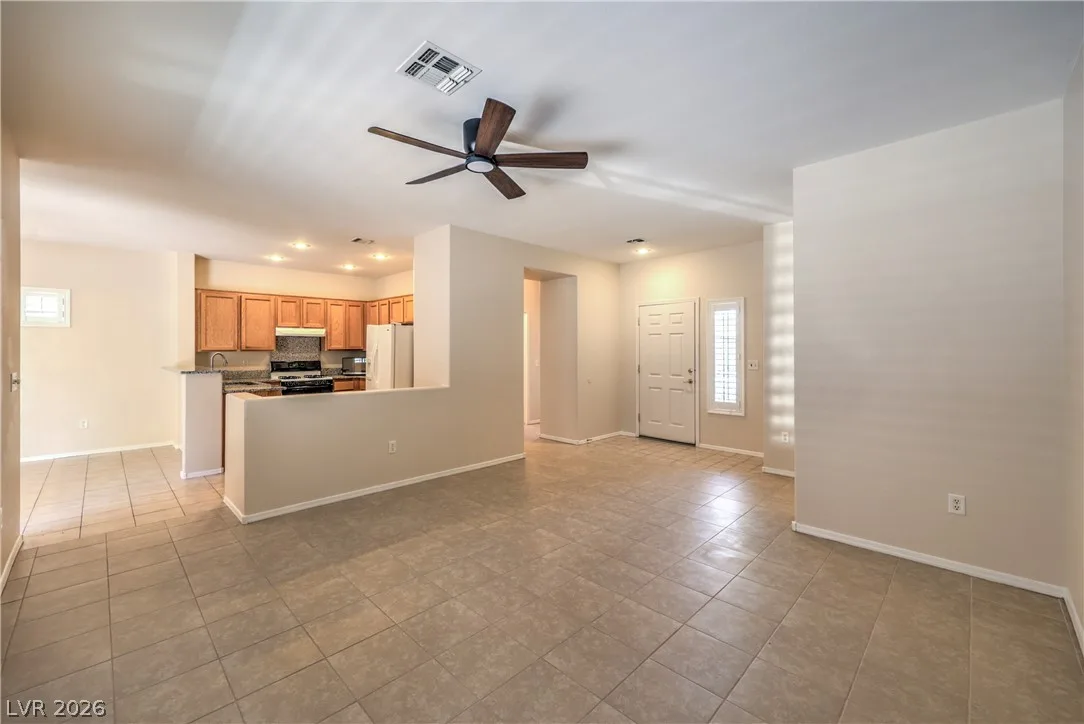
1652 Rockcrest Hills Avenue, Henderson, NV 89052
Status: Sold
$1,930 Sold Price
$2
$ / Sq Ft
1,280
Living Area
6,970 sqft
Lot Size
2
Beds
2
Baths
2001
Year Built
Search Parameters
Property Type
Status
Radius
Sold Within
Beds
Baths
Living Area (Sq Ft)
Lot Size (Sq Ft)
This comp search reflects your current search parameters — adjust the filters above as needed for a more accurate estimate.
Estimated Value
—
Average $/Sqft
—
Check one or more comps below to calculate an estimate.
Nearest 10 of 12 comparable sales and listings within 1 mile of this home. Use the filters above and press Search to refine.
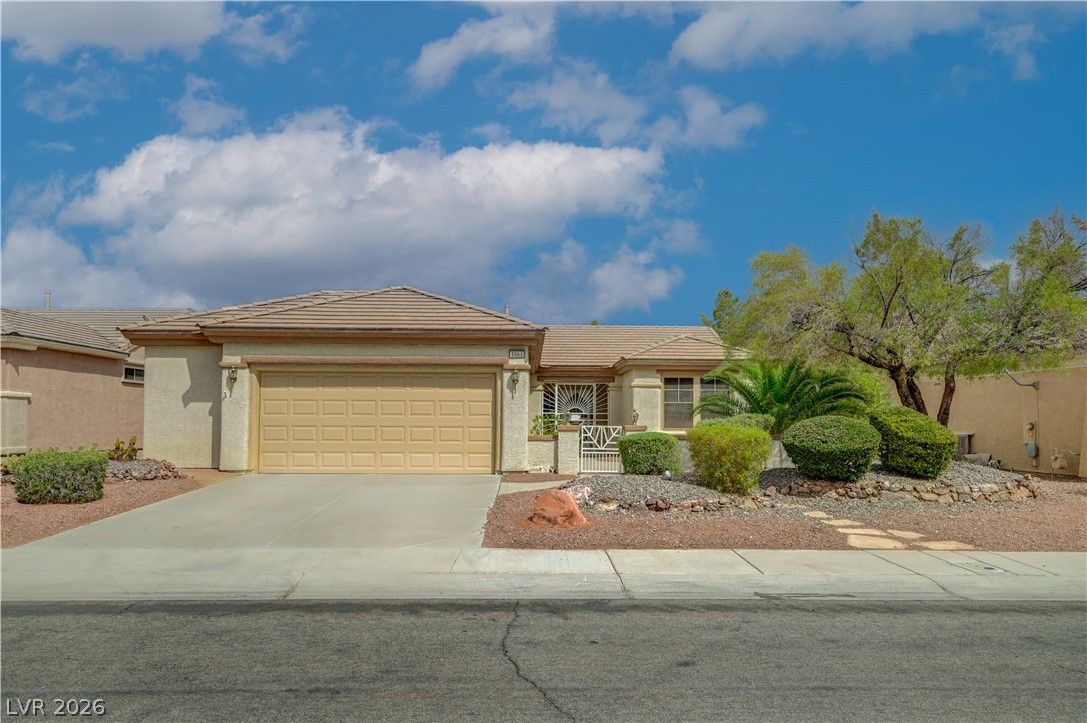
$395,0002 bd2 ba1,280 sqft$309/sqft0.22 mi52 days
$485,0003 bd3 ba1,560 sqft$311/sqft0.34 mi23 daysSold 2026-06-12
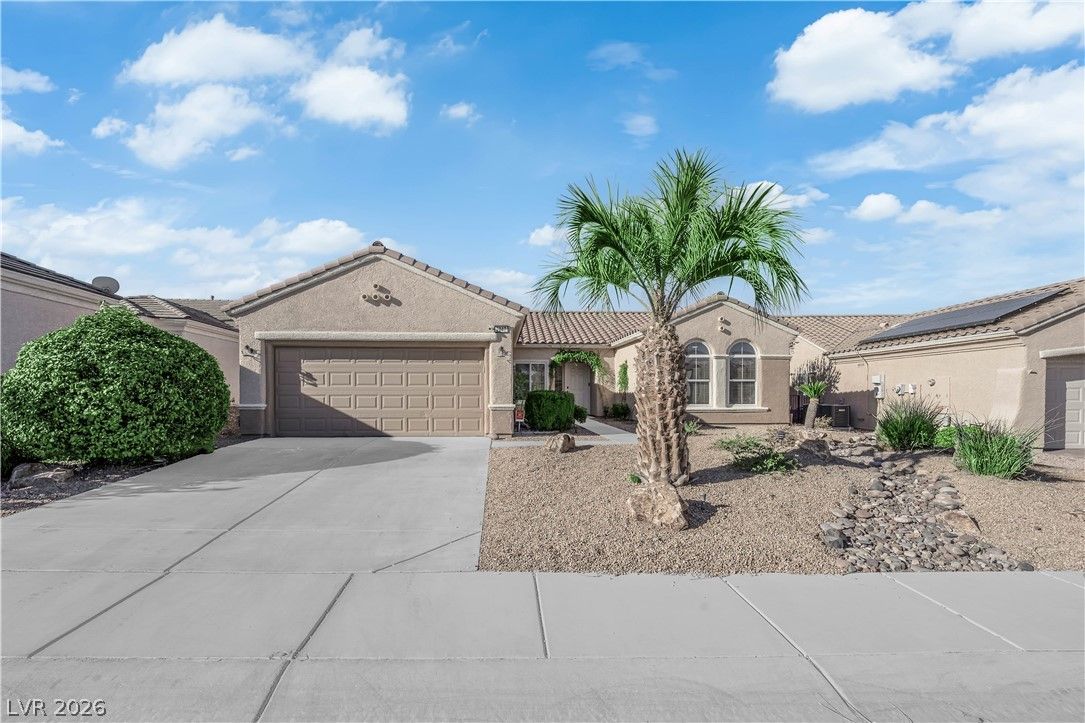
$464,5002 bd2 ba1,600 sqft$290/sqft0.45 mi116 daysSold 2026-10-14
$489,0002 bd2 ba1,508 sqft$324/sqft0.50 mi11 daysSold 2026-05-13
$478,0002 bd2 ba1,242 sqft$385/sqft0.50 mi4 daysSold 2026-06-23

1748 Warrington DriveActive
$450,0002 bd2 ba1,524 sqft$295/sqft0.76 mi129 days
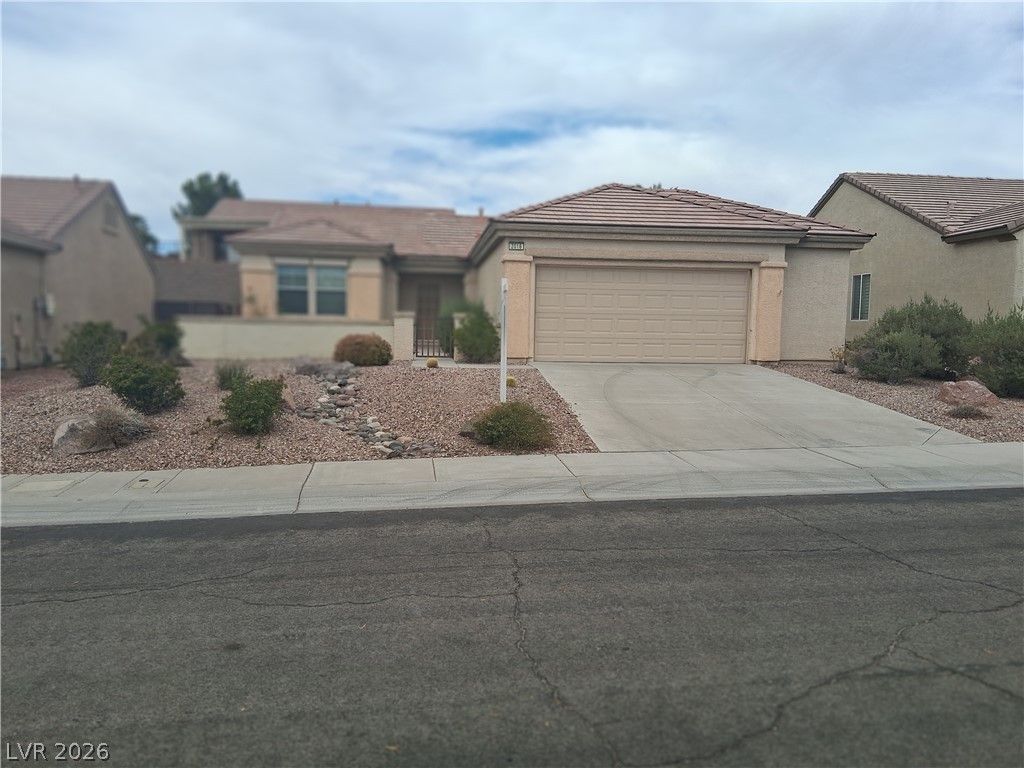
2016 Fort Halifax StreetUnder Contract
$349,0002 bd2 ba1,280 sqft$273/sqft0.81 mi99 days
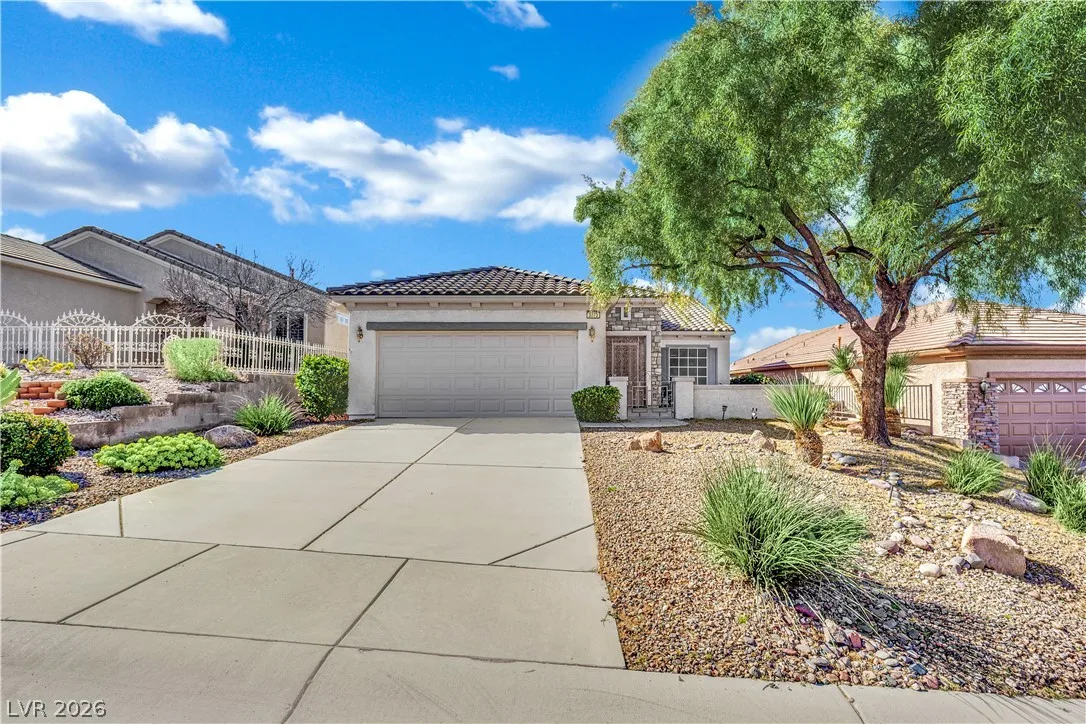
$479,0002 bd2 ba1,496 sqft$320/sqft0.83 mi1 days
1472 Dragon Rock DriveActive
$476,0003 bd2 ba1,454 sqft$327/sqft0.85 mi5 days
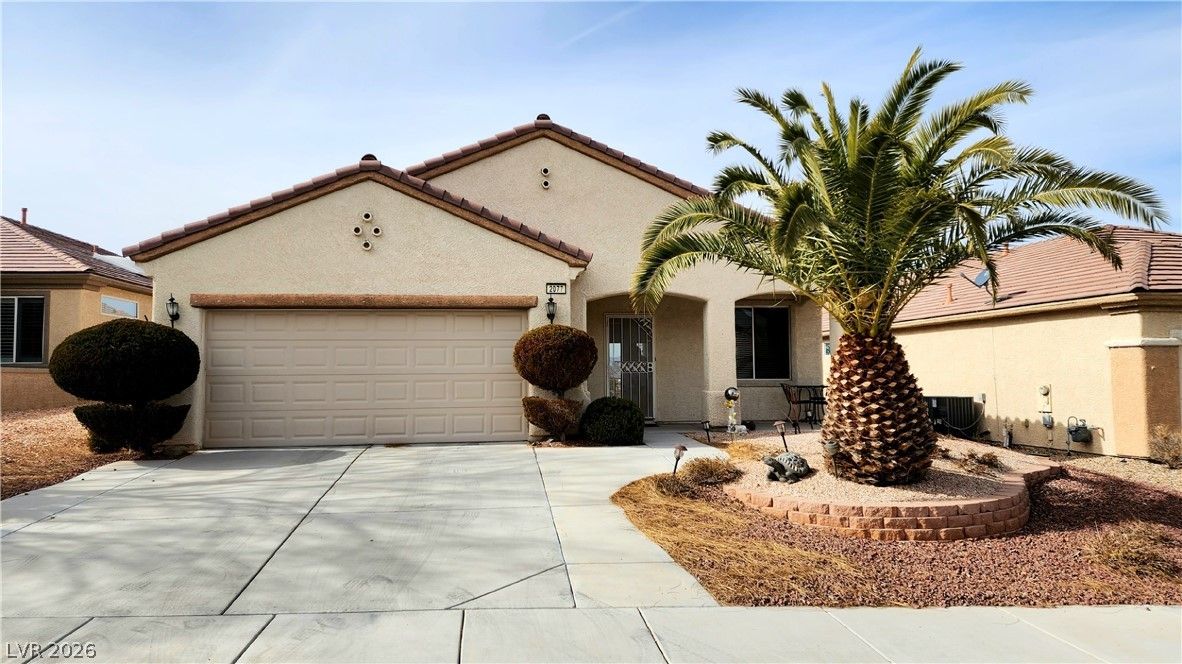
$440,0002 bd2 ba1,569 sqft$280/sqft0.92 mi19 daysSold 2026-09-22
Nearest comparable sales and listings
12 comparables · median price $457,250 · range $349,000 – $489,000 · median $/sq ft $304 · average $/sq ft $308
| Address | Status | Price | $/Sq Ft | Bd / Ba | Sq Ft | Sold / market time | Distance |
|---|---|---|---|---|---|---|---|
| 1664 Black Fox Canyon Road | Active | $395,000 | $309 | 2 / 2 | 1,280 | 52 days on market | 0.22 mi |
| 2842 Freedom Hills Drive | Sold | $485,000 | $311 | 3 / 3 | 1,560 | Sold 2026-06-12 | 0.34 mi |
| 2847 Forest Grove Drive | Sold | $464,500 | $290 | 2 / 2 | 1,600 | Sold 2026-10-14 | 0.45 mi |
| 1605 Williamsport Street | Sold | $489,000 | $324 | 2 / 2 | 1,508 | Sold 2026-05-13 | 0.50 mi |
| 3105 Whispering Canyon Court | Sold | $478,000 | $385 | 2 / 2 | 1,242 | Sold 2026-06-23 | 0.50 mi |
| 1748 Warrington Drive | Active | $450,000 | $295 | 2 / 2 | 1,524 | 129 days on market | 0.76 mi |
| 2016 Fort Halifax Street | Under Contract | $349,000 | $273 | 2 / 2 | 1,280 | 99 days on market | 0.81 mi |
| 3073 Brownbirds Nest Drive | Active | $479,000 | $320 | 2 / 2 | 1,496 | 1 days on market | 0.83 mi |
| 1472 Dragon Rock Drive | Active | $476,000 | $327 | 3 / 2 | 1,454 | 5 days on market | 0.85 mi |
| 2077 Wildwood Lake Street | Sold | $440,000 | $280 | 2 / 2 | 1,569 | Sold 2026-09-22 | 0.92 mi |
| 2148 Treasure Lake Court | Sold | $445,000 | $300 | 2 / 2 | 1,482 | Sold 2026-05-19 | 0.97 mi |
| 1651 Danbury Crossing Drive | Sold | $415,500 | $276 | 2 / 2 | 1,508 | Sold 2026-06-01 | 1.00 mi |


