
Comparable Sales Near 2160 Burris Hill Drive, Henderson, NV 89052
1st Realty · Comparable sales report · 1st.estate · October 20, 2026
Read the Sun City Anthem neighborhood guide →
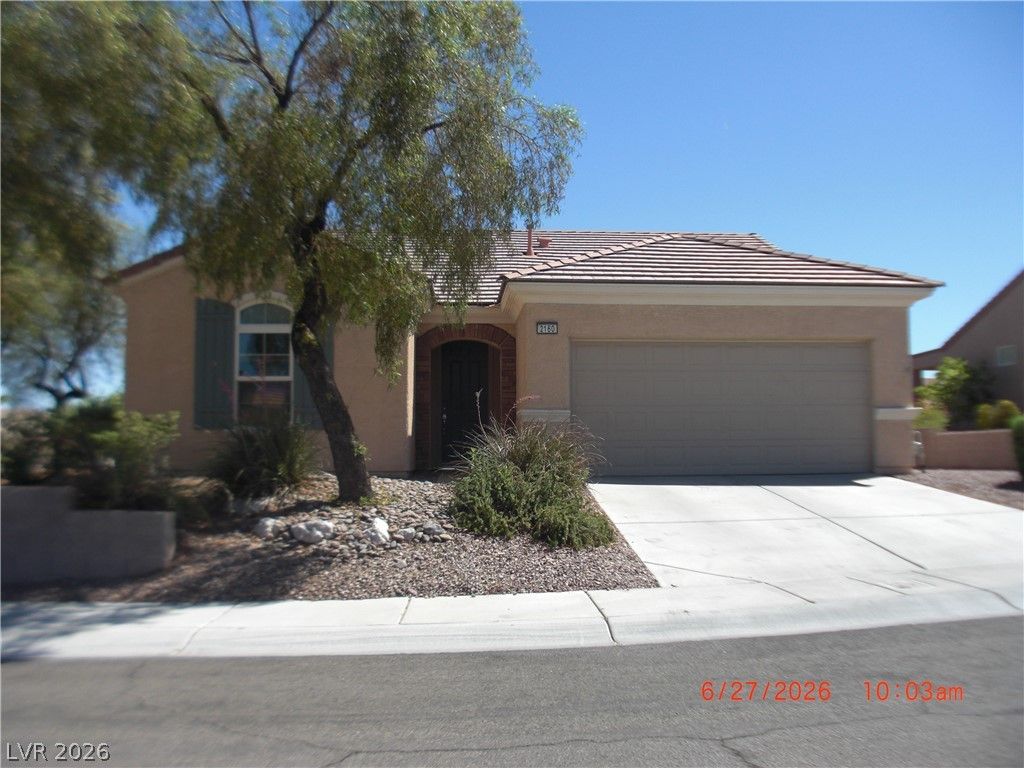
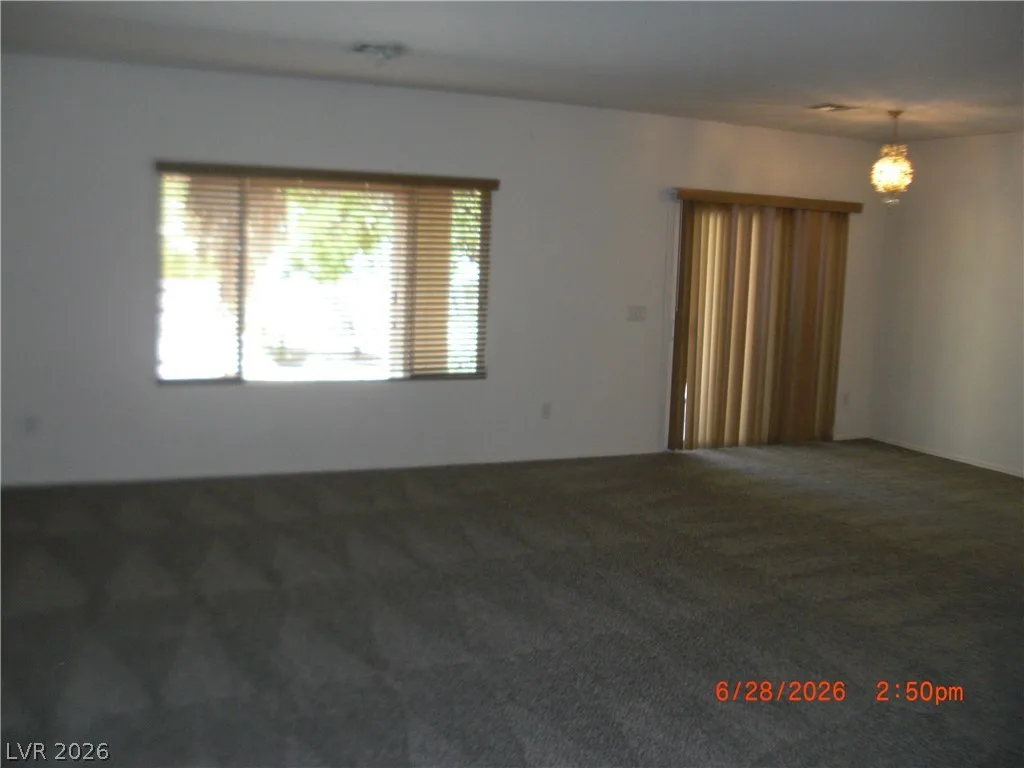
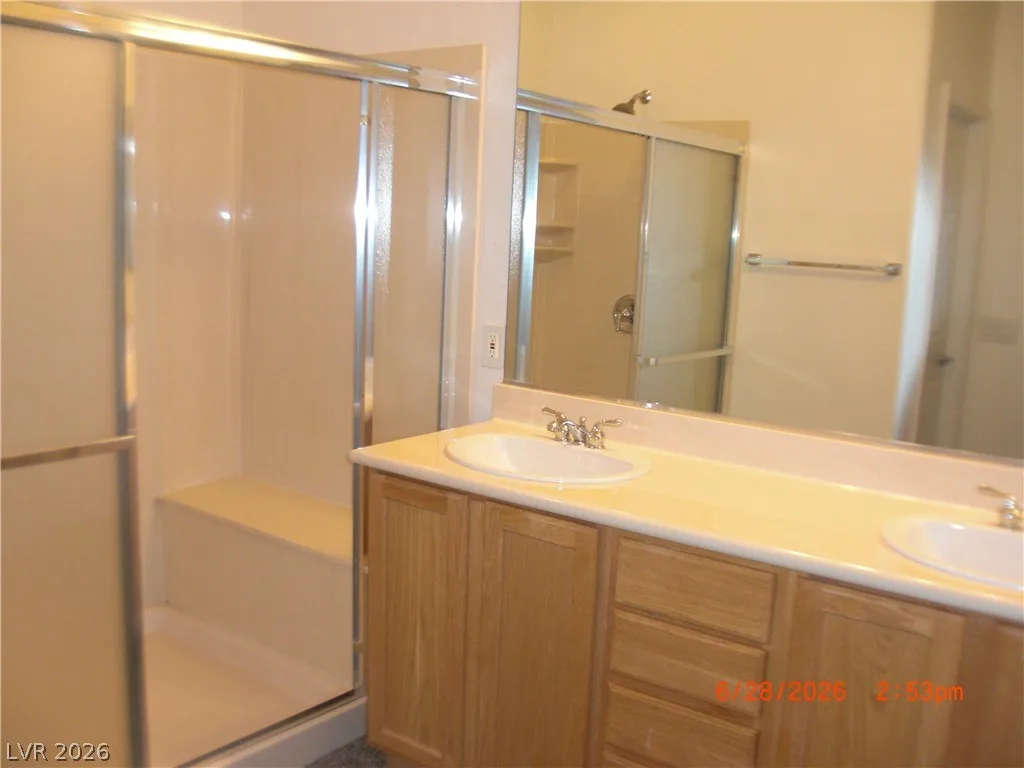
2160 Burris Hill Drive, Henderson, NV 89052
Status: Sold
$1,950 Sold Price
$1
$ / Sq Ft
1,610
Living Area
8,712 sqft
Lot Size
2
Beds
2
Baths
2004
Year Built
Search Parameters
Property Type
Status
Radius
Sold Within
Beds
Baths
Living Area (Sq Ft)
Lot Size (Sq Ft)
This comp search reflects your current search parameters — adjust the filters above as needed for a more accurate estimate.
Estimated Value
—
Average $/Sqft
—
Check one or more comps below to calculate an estimate.
Nearest 10 of 38 comparable sales and listings within 1 mile of this home. Use the filters above and press Search to refine.
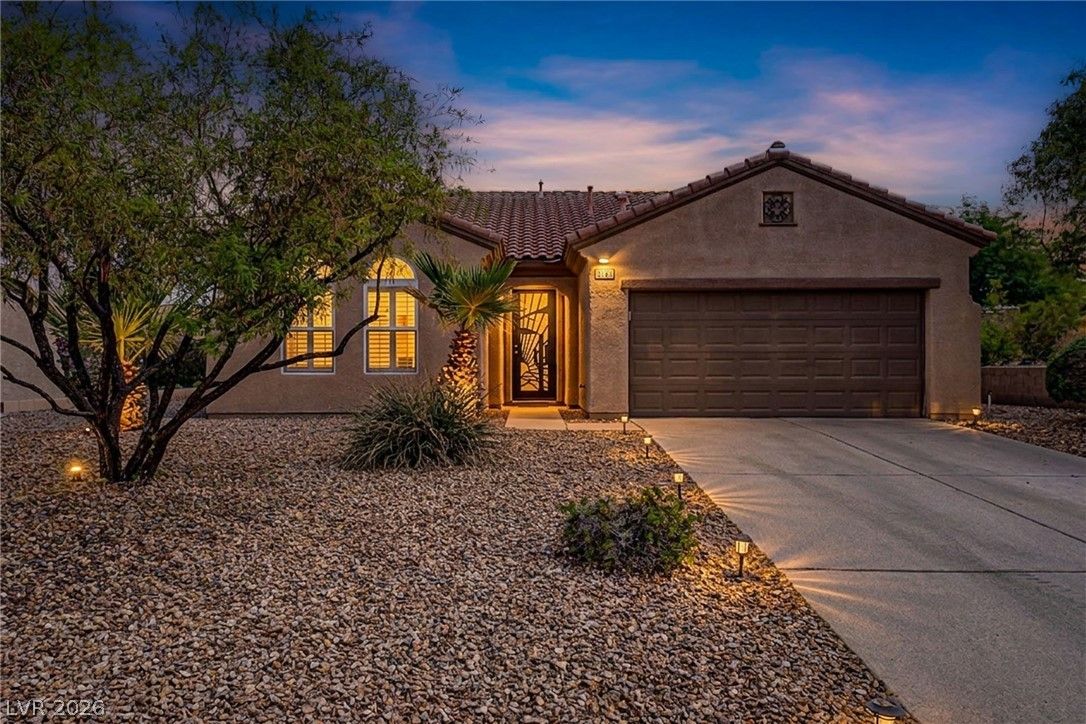
$450,0003 bd2 ba1,610 sqft$280/sqft0.11 mi54 days
$460,0002 bd2 ba1,610 sqft$286/sqft0.14 mi329 daysSold 2026-05-04
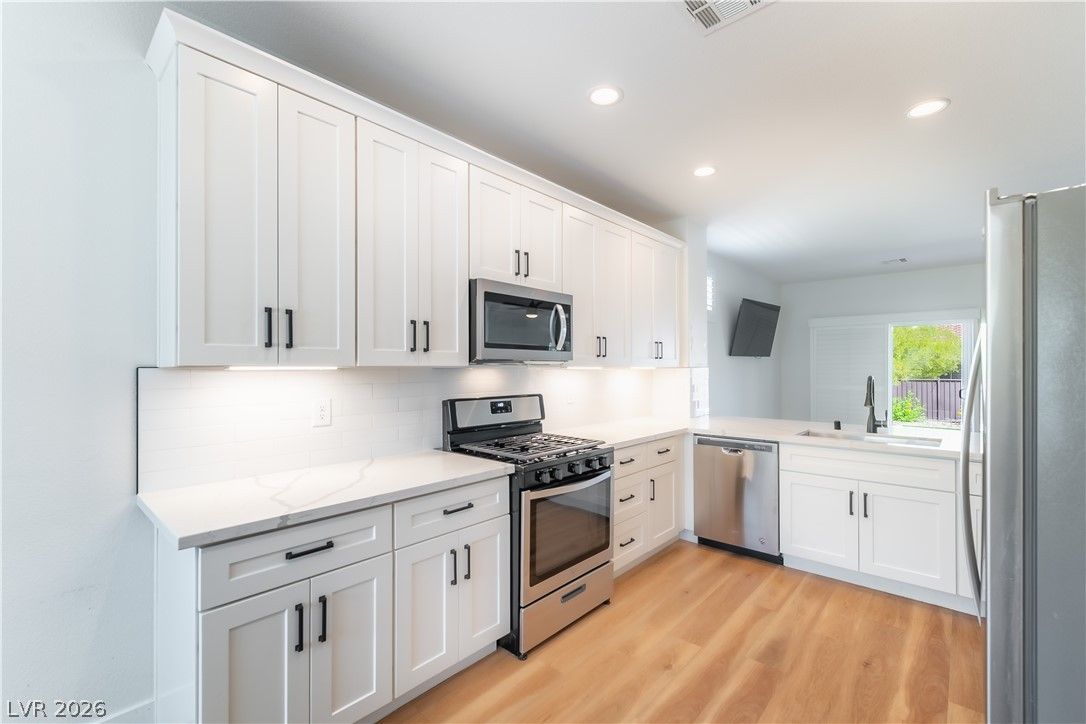
2142 Alyssa Jade DriveActive
$499,0002 bd2 ba1,496 sqft$334/sqft0.17 mi17 days
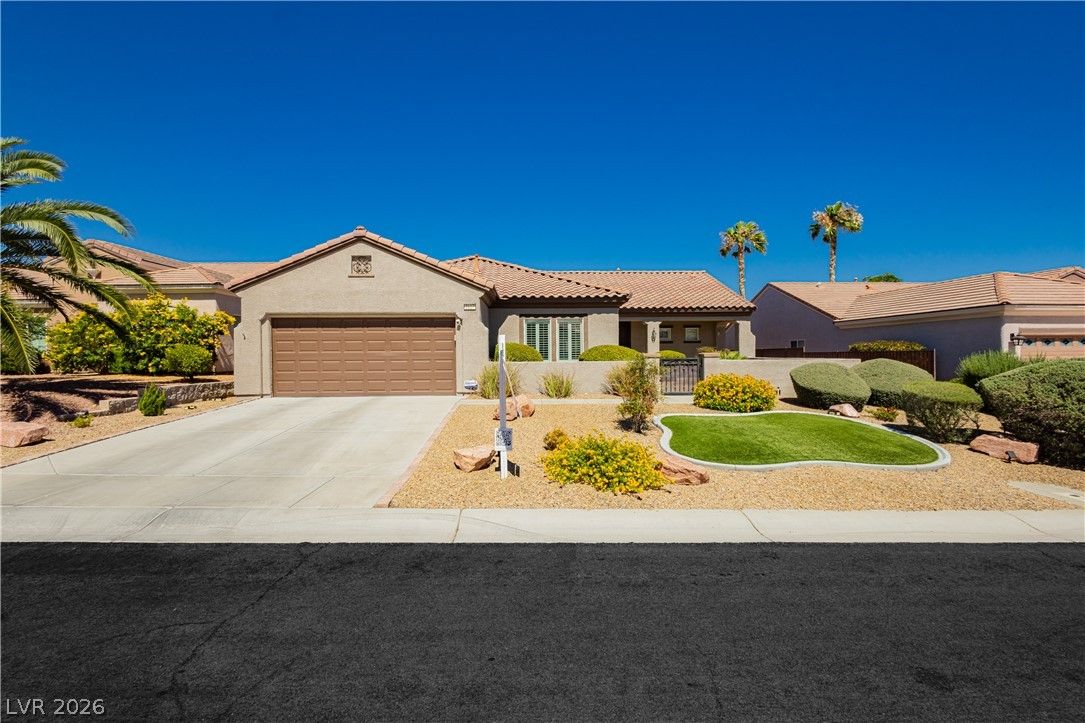
$470,0002 bd2 ba1,836 sqft$256/sqft0.19 mi3 daysSold 2026-07-27
$450,0003 bd2 ba1,610 sqft$280/sqft0.21 mi37 daysSold 2026-06-30
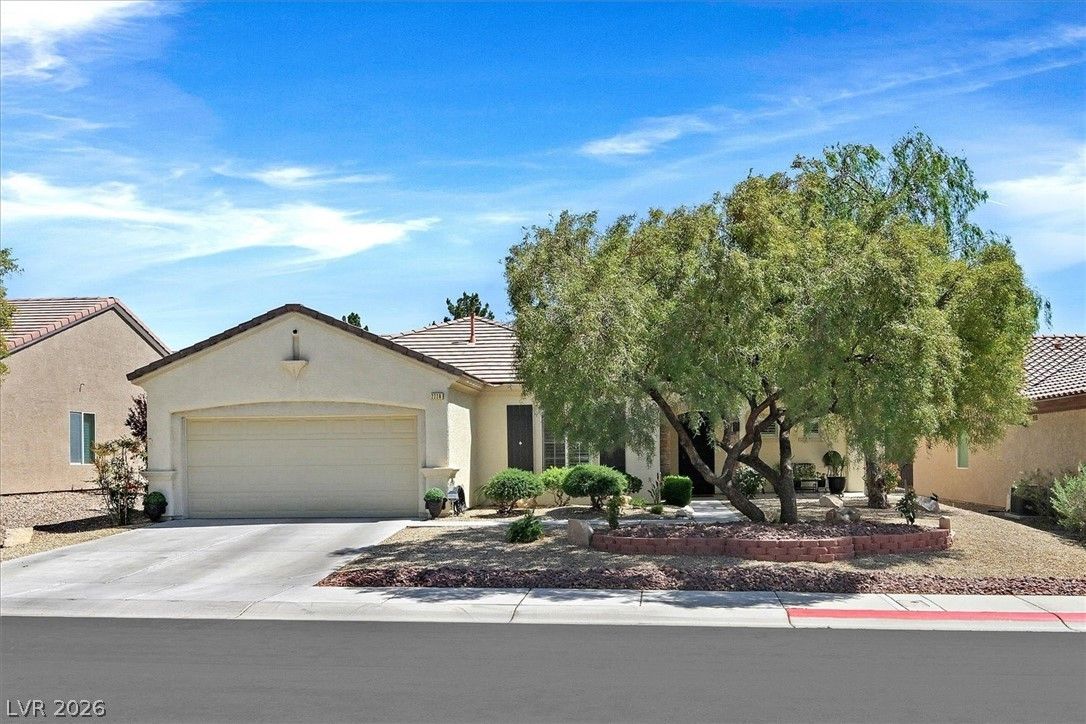
$469,9002 bd2 ba1,836 sqft$256/sqft0.27 mi91 daysSold 2026-08-31
$579,0002 bd2 ba1,836 sqft$315/sqft0.27 mi65 daysSold 2026-06-17

2116 Twin Falls DriveActive
$519,9002 bd2 ba1,836 sqft$283/sqft0.28 mi33 days
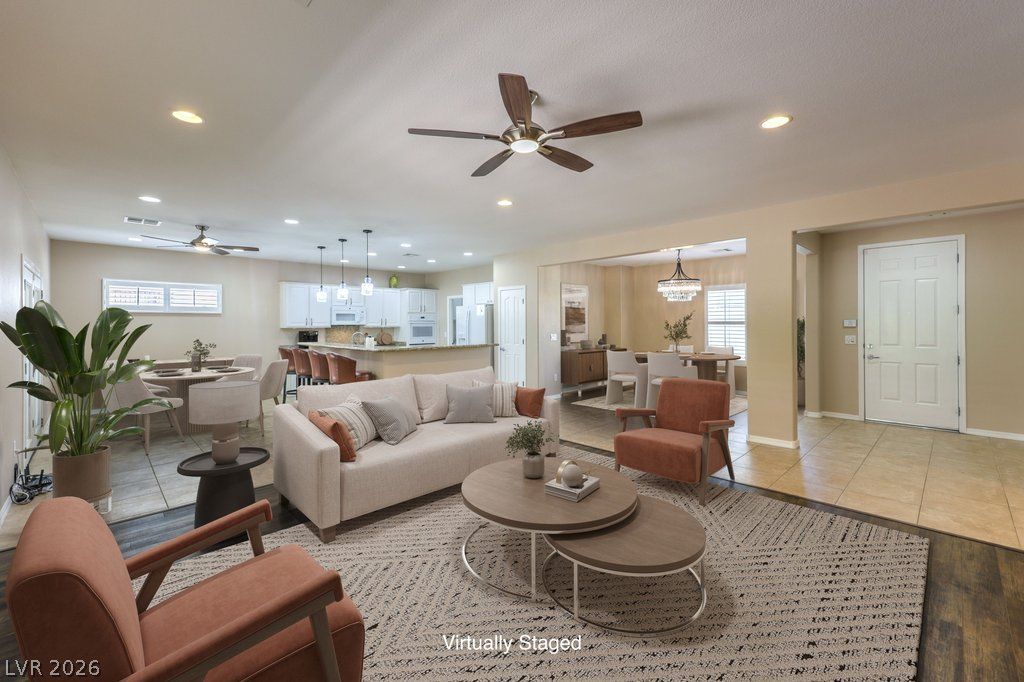
$581,4682 bd2 ba2,012 sqft$289/sqft0.31 mi0 days
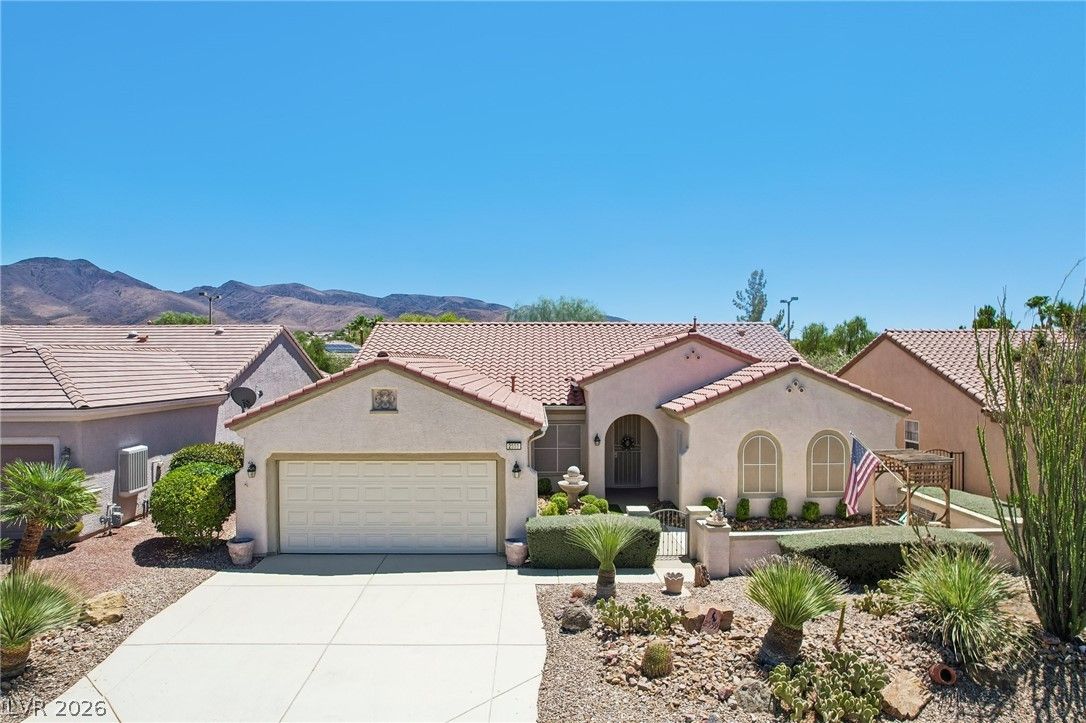
2559 Deora WayActive
$524,9002 bd2 ba2,012 sqft$261/sqft0.31 mi25 days
Nearest comparable sales and listings
12 comparables · median price $470,000 · range $418,000 – $581,468 · median $/sq ft $280 · average $/sq ft $281
| Address | Status | Price | $/Sq Ft | Bd / Ba | Sq Ft | Sold / market time | Distance |
|---|---|---|---|---|---|---|---|
| 2180 Cumberland Hill Drive | Active | $450,000 | $280 | 3 / 2 | 1,610 | 54 days on market | 0.11 mi |
| 2158 Alyssa Jade Drive | Sold | $460,000 | $286 | 2 / 2 | 1,610 | Sold 2026-05-04 | 0.14 mi |
| 2142 Alyssa Jade Drive | Active | $499,000 | $334 | 2 / 2 | 1,496 | 17 days on market | 0.17 mi |
| 2127 Waterton Rivers Drive | Sold | $470,000 | $256 | 2 / 2 | 1,836 | Sold 2026-07-27 | 0.19 mi |
| 2126 Alyssa Jade Drive | Sold | $450,000 | $280 | 3 / 2 | 1,610 | Sold 2026-06-30 | 0.21 mi |
| 2228 Waterton Rivers Drive | Sold | $469,900 | $256 | 2 / 2 | 1,836 | Sold 2026-08-31 | 0.27 mi |
| 2211 Twin Falls Drive | Sold | $579,000 | $315 | 2 / 2 | 1,836 | Sold 2026-06-17 | 0.27 mi |
| 2116 Twin Falls Drive | Active | $519,900 | $283 | 2 / 2 | 1,836 | 33 days on market | 0.28 mi |
| 2318 Black River Falls Drive | Active | $581,468 | $289 | 2 / 2 | 2,012 | 0 days on market | 0.31 mi |
| 2559 Deora Way | Active | $524,900 | $261 | 2 / 2 | 2,012 | 25 days on market | 0.31 mi |
| 2225 Idaho Falls Drive | Sold | $418,000 | $279 | 2 / 2 | 1,496 | Sold 2026-07-09 | 0.38 mi |
| 2244 Turner Falls Street | Sold | $470,000 | $256 | 2 / 2 | 1,836 | Sold 2026-08-31 | 0.45 mi |


