
Comparable Sales Near 2695 Olivia Heights Avenue, Henderson, NV 89052
1st Realty · Comparable sales report · 1st.estate · October 21, 2026
Read the Sun City Anthem neighborhood guide →
2695 Olivia Heights Avenue, Henderson, NV 89052
Status: Sold
$1,250,000 Sold Price
$451
$ / Sq Ft
2,769
Living Area
8,712 sqft
Lot Size
3
Beds
4
Baths
2002
Year Built
Search Parameters
Property Type
Status
Radius
Sold Within
Beds
Baths
Living Area (Sq Ft)
Lot Size (Sq Ft)
This comp search reflects your current search parameters — adjust the filters above as needed for a more accurate estimate.
Estimated Value
—
Average $/Sqft
—
Check one or more comps below to calculate an estimate.
Nearest 10 of 78 comparable sales and listings within 1 mile of this home. Use the filters above and press Search to refine.
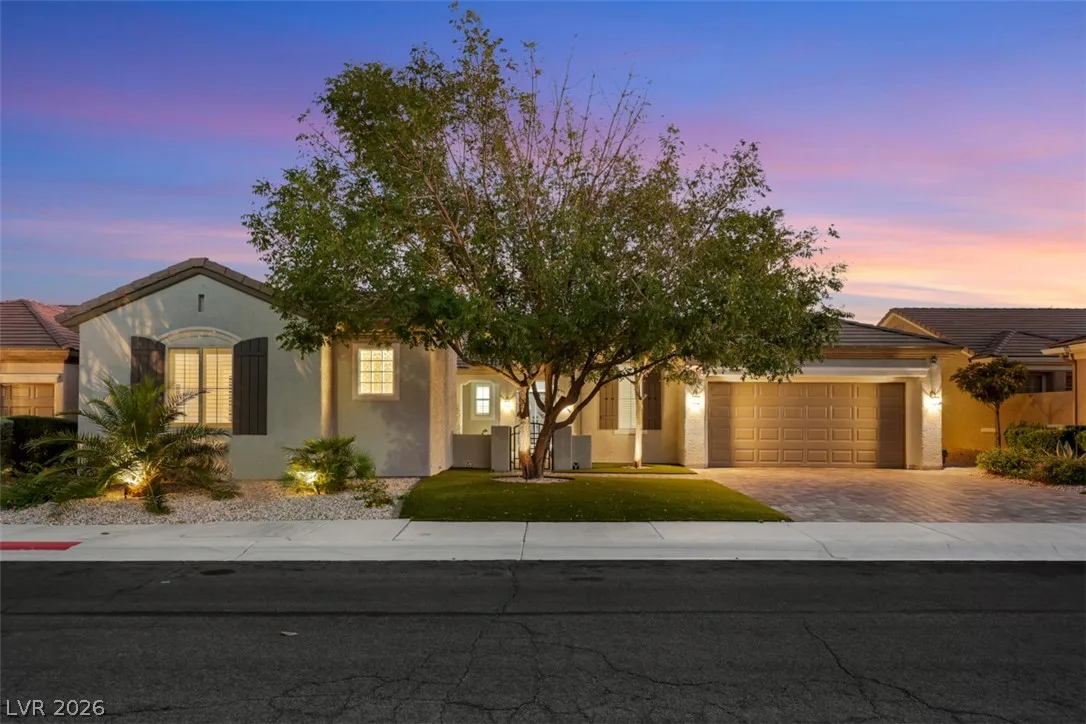
$1,290,0003 bd3 ba2,460 sqft$524/sqft0.01 mi4 days

2728 Olivia Heights AvenueUnder Contract
$1,150,0004 bd3 ba3,265 sqft$352/sqft0.09 mi54 days
$695,0003 bd4 ba2,827 sqft$246/sqft0.19 mi106 daysSold 2026-07-07
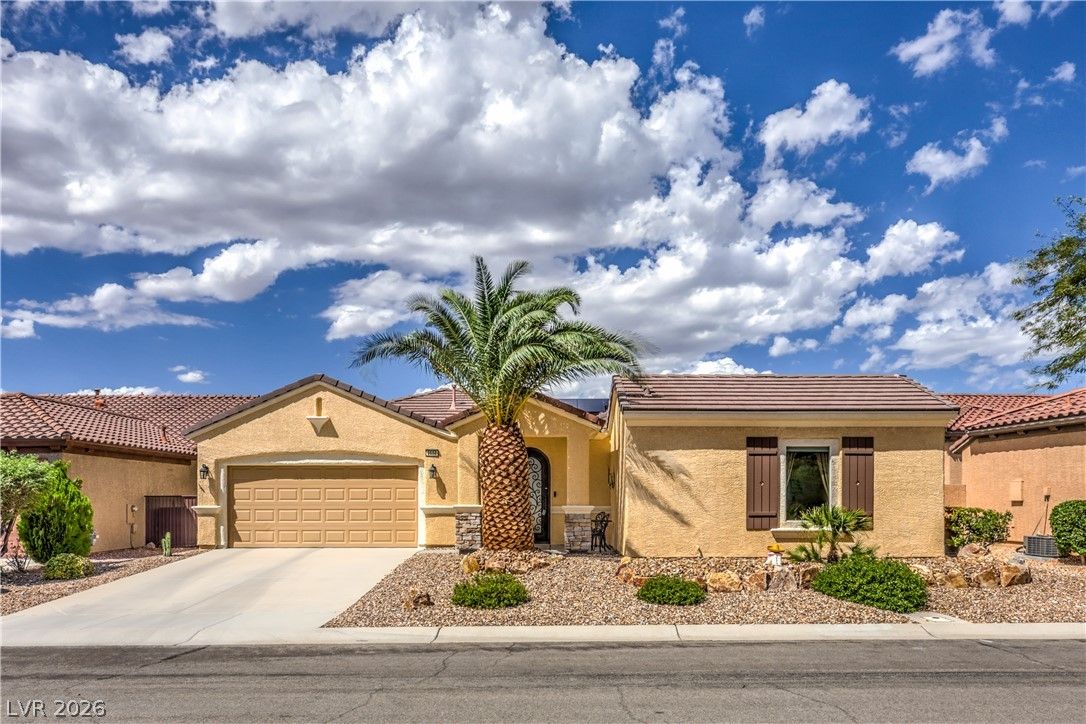
$928,0003 bd3 ba2,086 sqft$445/sqft0.20 mi35 days
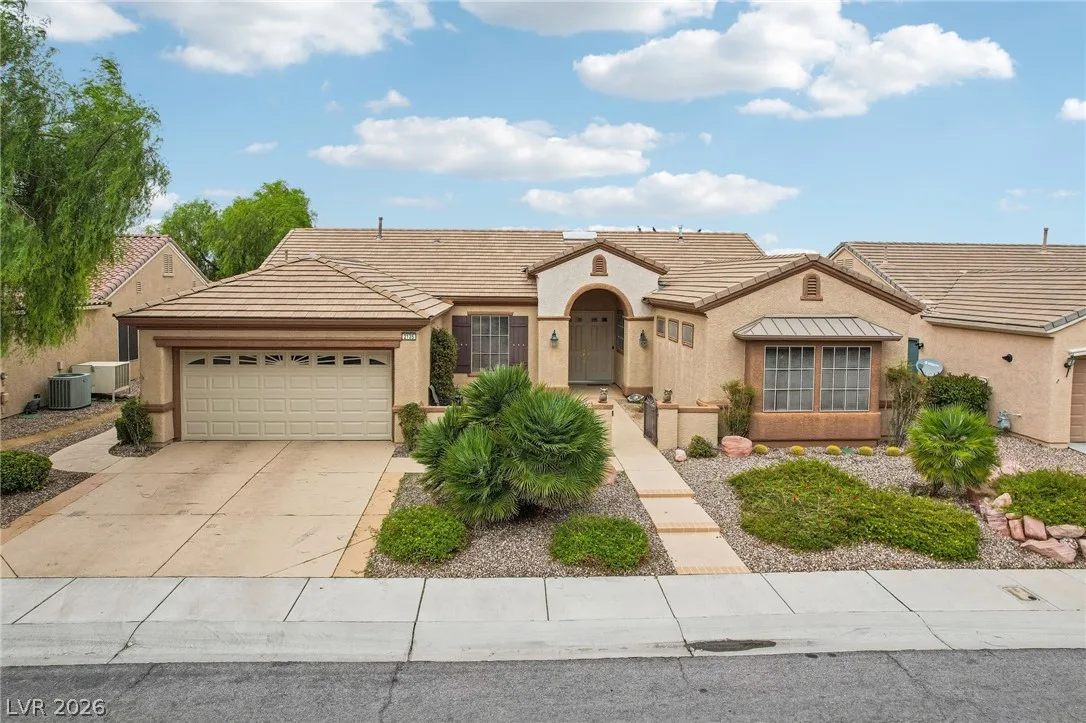
2135 Fort Sanders StreetActive
$965,0003 bd3 ba2,446 sqft$395/sqft0.21 mi0 days
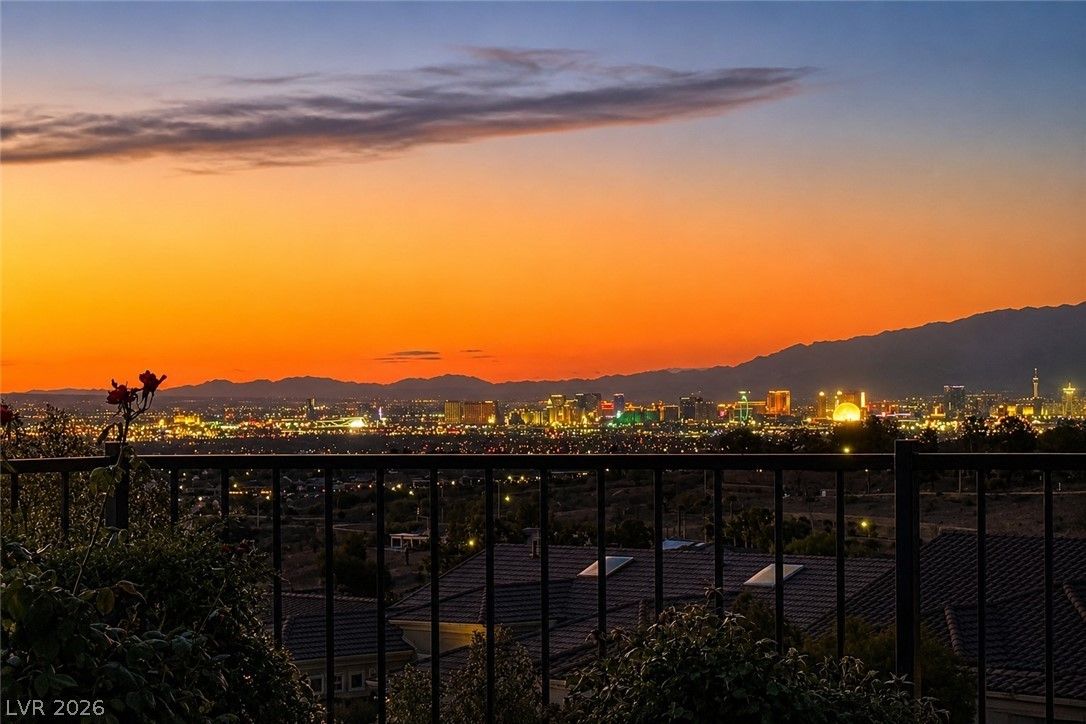
$1,300,0003 bd4 ba2,769 sqft$469/sqft0.22 mi76 daysSold 2026-09-30
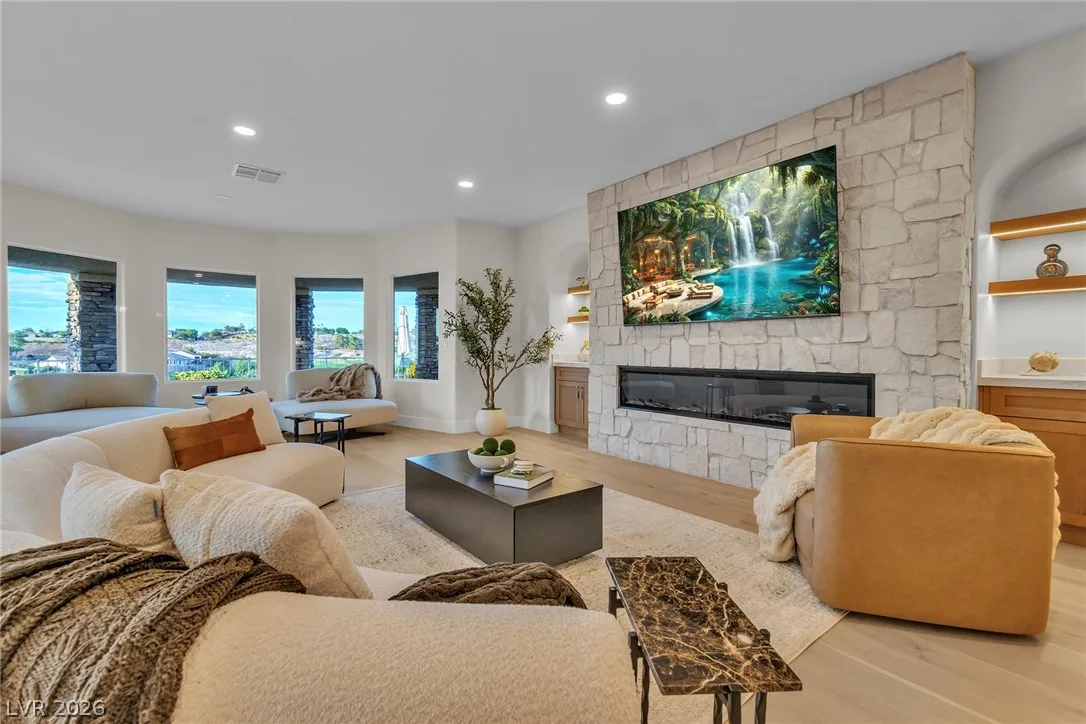
$1,649,9004 bd4 ba3,155 sqft$523/sqft0.26 mi11 days
$890,0003 bd3 ba2,505 sqft$355/sqft0.26 mi39 daysSold 2026-05-15
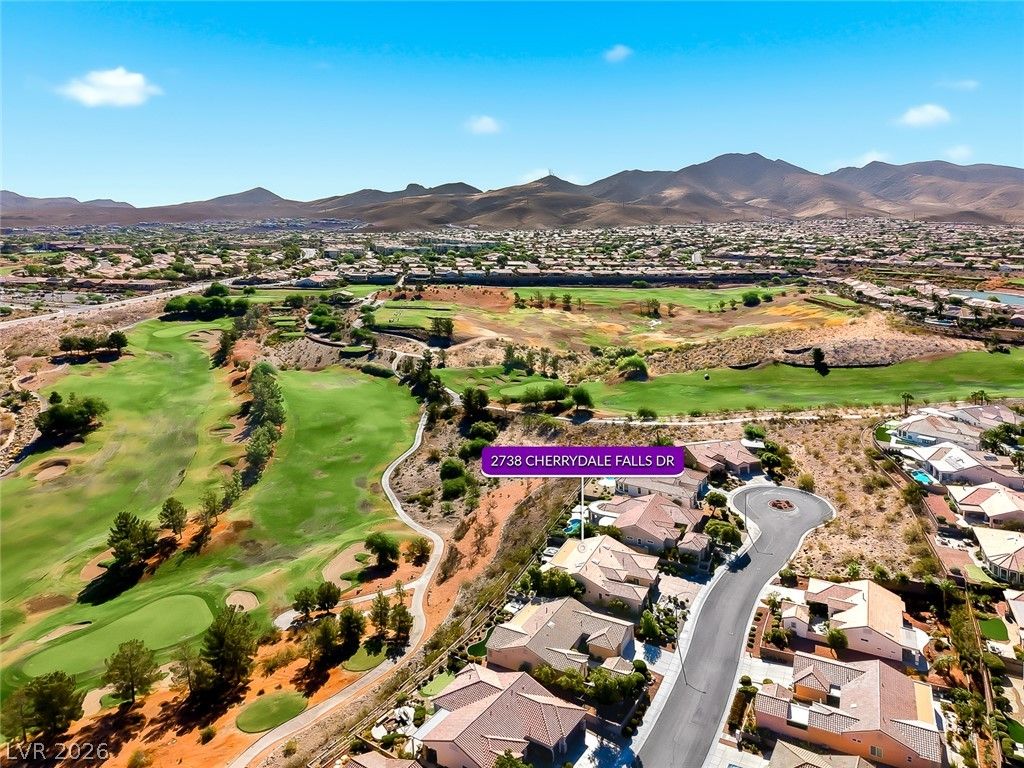
$1,025,0002 bd3 ba2,592 sqft$395/sqft0.27 mi20 daysSold 2026-09-24
$1,059,0004 bd3 ba2,400 sqft$441/sqft0.30 mi114 daysSold 2026-07-02
Nearest comparable sales and listings
12 comparables · median price $995,000 · range $695,000 – $1,649,900 · median $/sq ft $395 · average $/sq ft $395
| Address | Status | Price | $/Sq Ft | Bd / Ba | Sq Ft | Sold / market time | Distance |
|---|---|---|---|---|---|---|---|
| 2699 Olivia Heights Avenue | Active | $1,290,000 | $524 | 3 / 3 | 2,460 | 4 days on market | 0.01 mi |
| 2728 Olivia Heights Avenue | Under Contract | $1,150,000 | $352 | 4 / 3 | 3,265 | 54 days on market | 0.09 mi |
| 2585 Portsmouth Creek Avenue | Sold | $695,000 | $246 | 3 / 4 | 2,827 | Sold 2026-07-07 | 0.19 mi |
| 2550 Portsmouth Creek Avenue | Active | $928,000 | $445 | 3 / 3 | 2,086 | 35 days on market | 0.20 mi |
| 2135 Fort Sanders Street | Active | $965,000 | $395 | 3 / 3 | 2,446 | 0 days on market | 0.21 mi |
| 2722 Hartwick Pines Drive | Sold | $1,300,000 | $469 | 3 / 4 | 2,769 | Sold 2026-09-30 | 0.22 mi |
| 2734 Cherrydale Falls Drive | Active | $1,649,900 | $523 | 4 / 4 | 3,155 | 11 days on market | 0.26 mi |
| 2738 Fort Myer Avenue | Sold | $890,000 | $355 | 3 / 3 | 2,505 | Sold 2026-05-15 | 0.26 mi |
| 2738 Cherrydale Falls Drive | Sold | $1,025,000 | $395 | 2 / 3 | 2,592 | Sold 2026-09-24 | 0.27 mi |
| 2446 Hardin Ridge Drive | Sold | $1,059,000 | $441 | 4 / 3 | 2,400 | Sold 2026-07-02 | 0.30 mi |
| 2107 Noah Tyler Ct. | Pending | $739,900 | $285 | 2 / 3 | 2,592 | 14 days on market | 0.33 mi |
| 2101 Noah Tyler Court | Sold | $850,000 | $314 | 3 / 4 | 2,708 | Sold 2026-05-13 | 0.35 mi |


