
Comparable Sales Near 3073 Olivia Heights Avenue, Henderson, NV 89052
1st Realty · Comparable sales report · 1st.estate · October 21, 2026
Read the Sun City Anthem neighborhood guide →
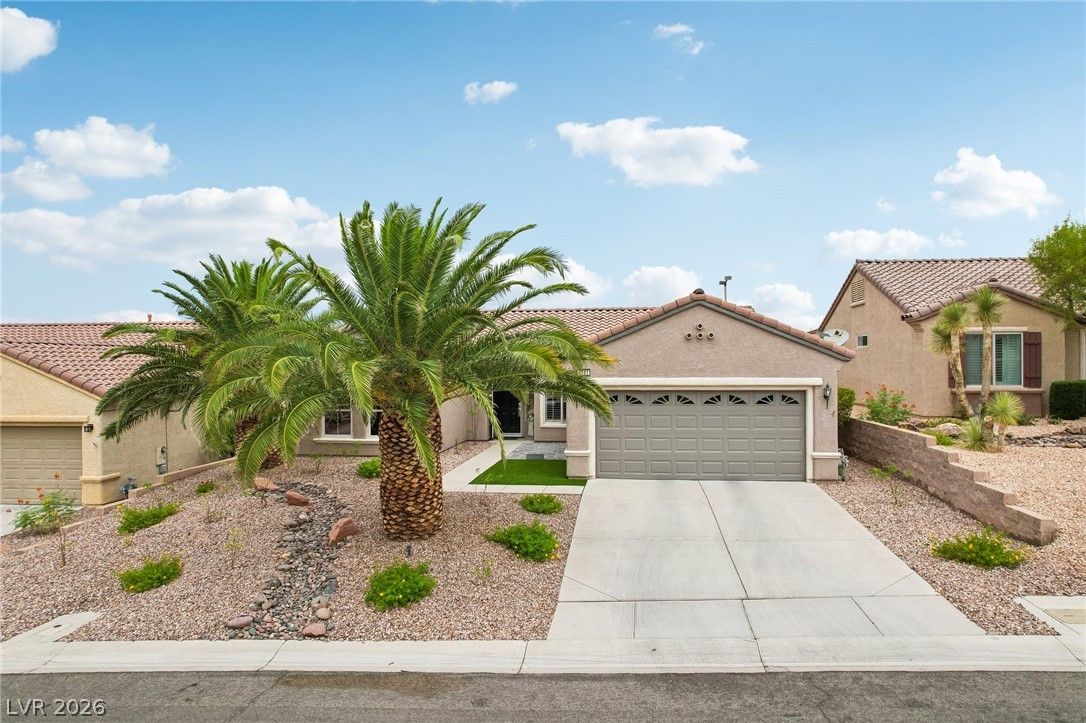
3073 Olivia Heights Avenue, Henderson, NV 89052
Status: Sold
$515,000 Sold Price
$301
$ / Sq Ft
1,712
Living Area
6,098 sqft
Lot Size
2
Beds
2
Baths
2004
Year Built
Search Parameters
Property Type
Status
Radius
Sold Within
Beds
Baths
Living Area (Sq Ft)
Lot Size (Sq Ft)
This comp search reflects your current search parameters — adjust the filters above as needed for a more accurate estimate.
Estimated Value
—
Average $/Sqft
—
Check one or more comps below to calculate an estimate.
Nearest 10 of 31 comparable sales and listings within 1 mile of this home. Use the filters above and press Search to refine.
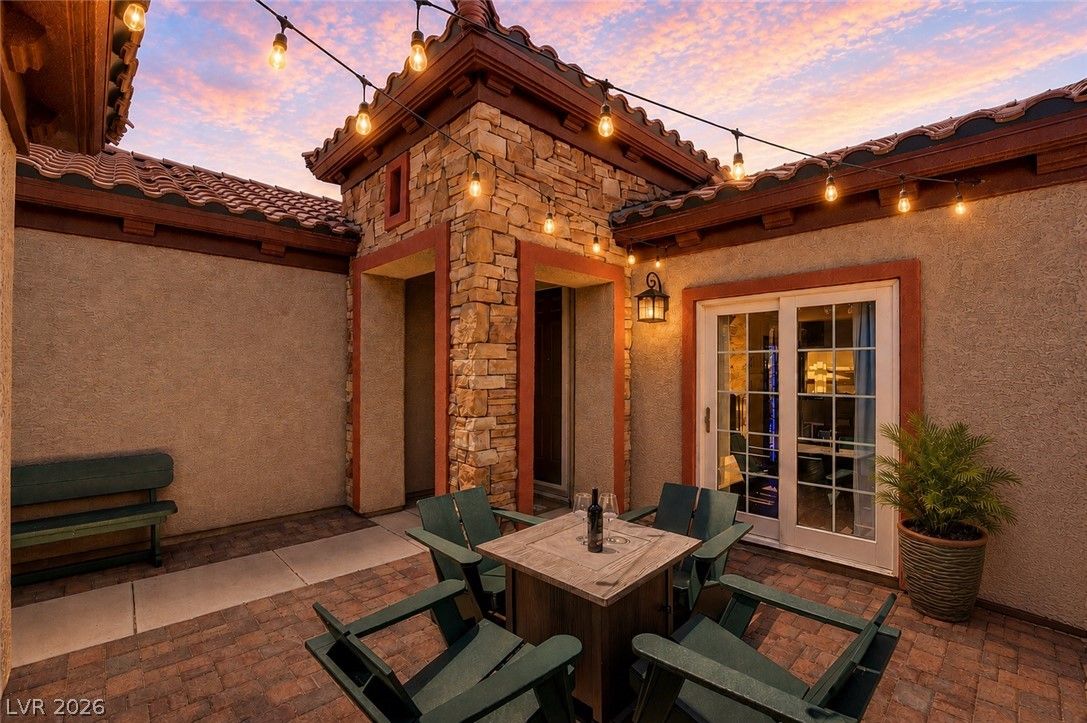
$610,0003 bd3 ba1,754 sqft$348/sqft0.02 mi21 daysSold 2026-09-08
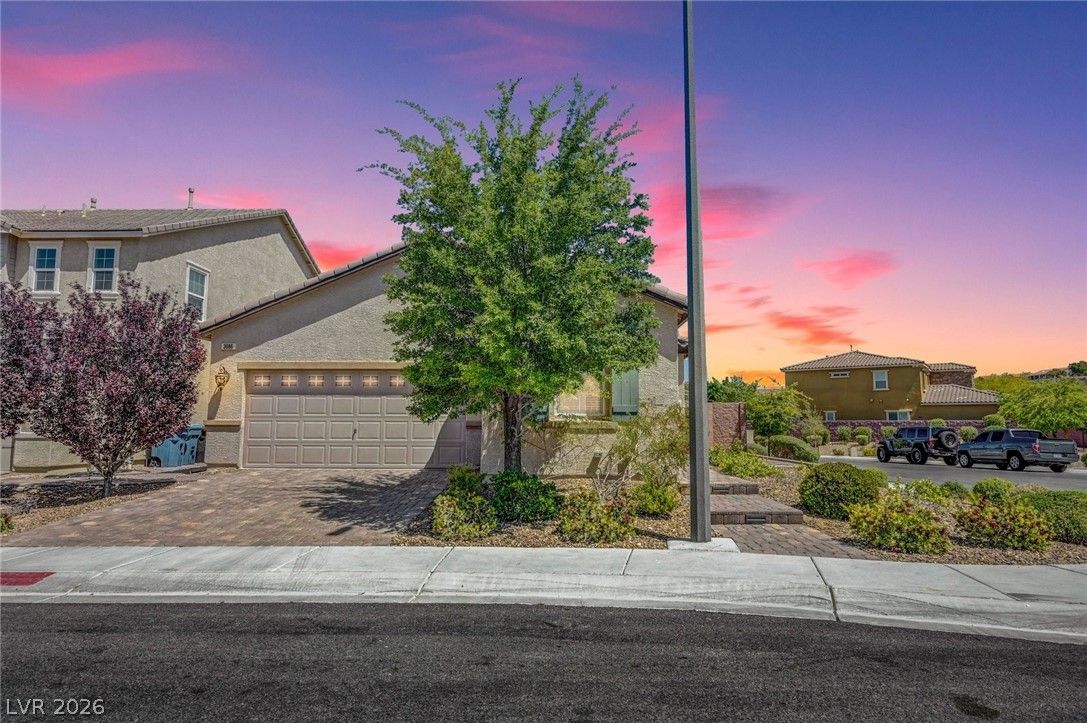
$555,0003 bd2 ba1,844 sqft$301/sqft0.14 mi120 daysSold 2026-09-29
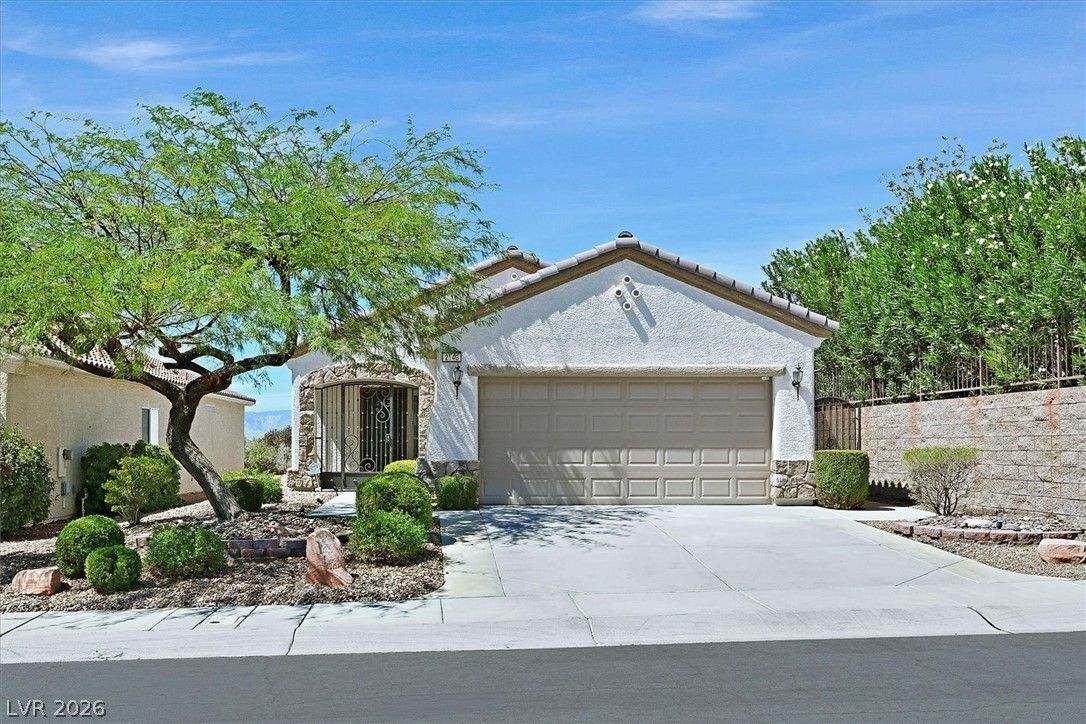
$475,0002 bd2 ba1,456 sqft$326/sqft0.16 mi34 days
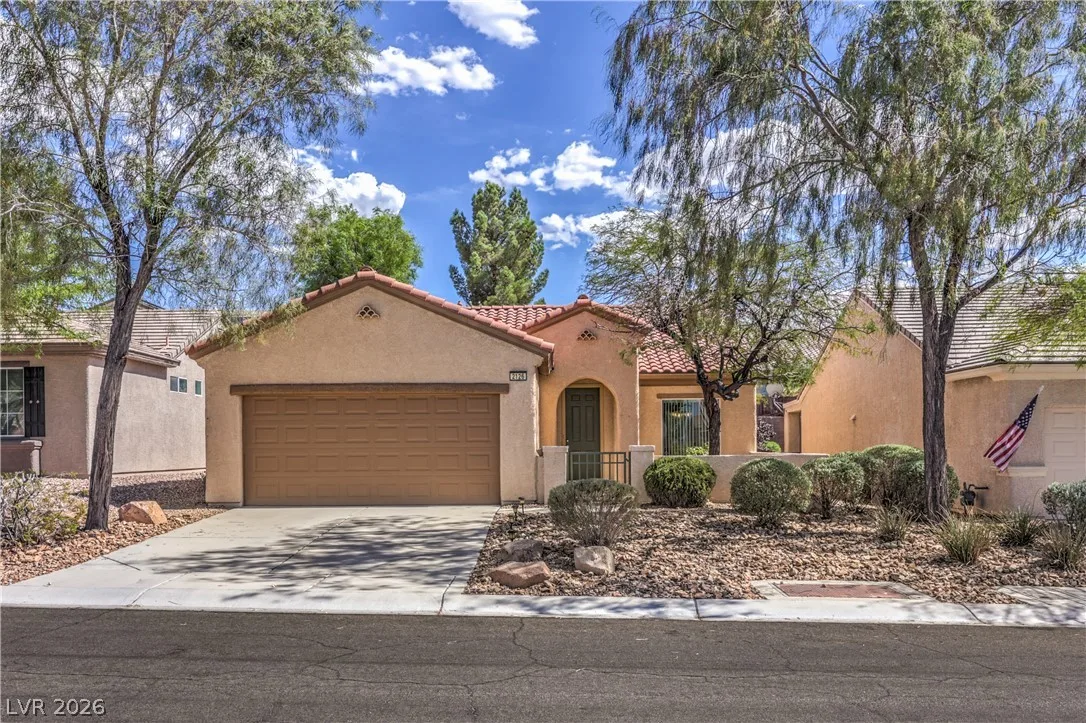
$429,9002 bd2 ba1,496 sqft$287/sqft0.20 mi0 days
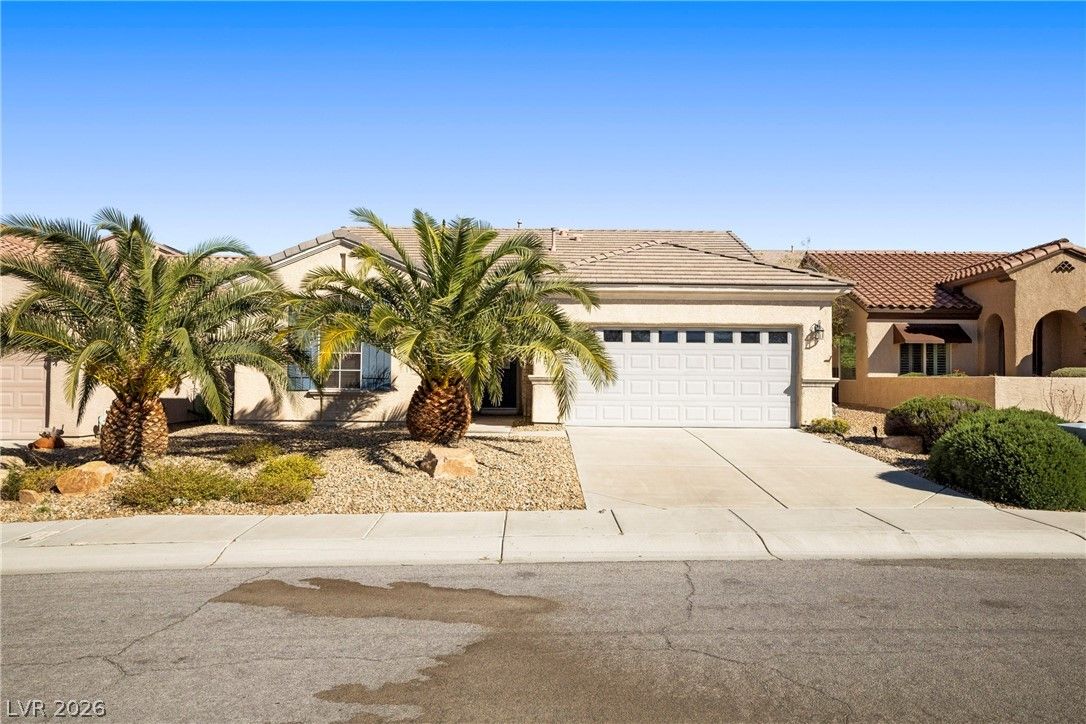
2072 Fort Halifax StreetActive
$434,0003 bd2 ba1,610 sqft$270/sqft0.20 mi205 days
$454,5002 bd2 ba1,496 sqft$304/sqft0.20 mi4 daysSold 2026-07-17
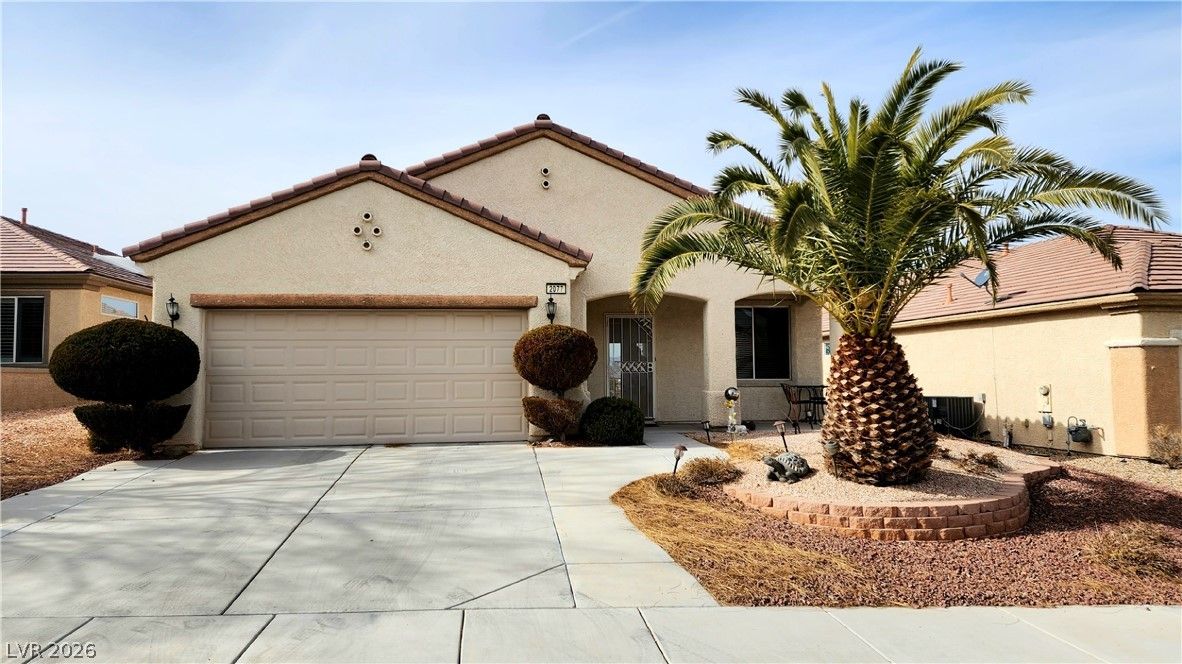
$440,0002 bd2 ba1,569 sqft$280/sqft0.24 mi19 daysSold 2026-09-22
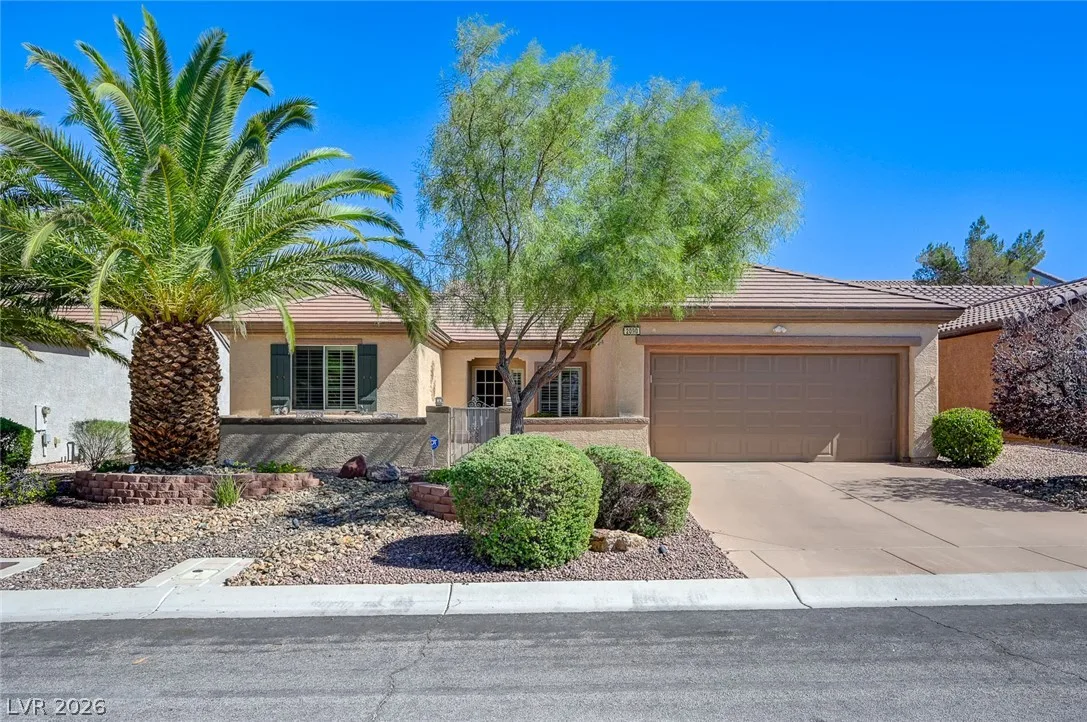
$470,0002 bd2 ba1,632 sqft$288/sqft0.27 mi1 days
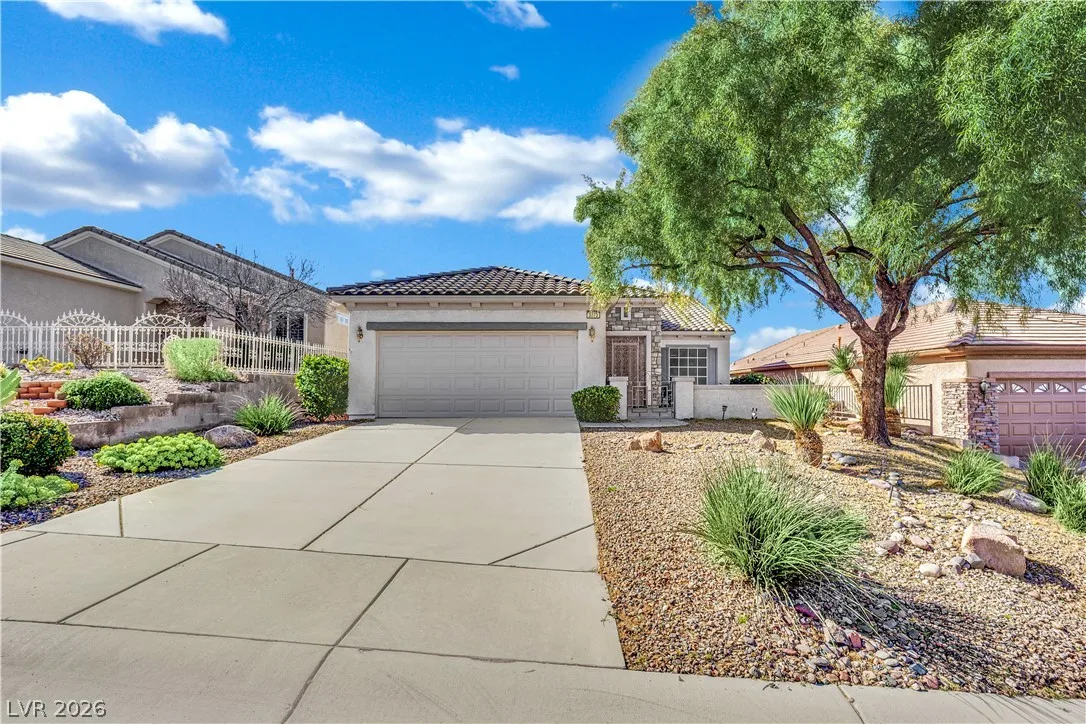
$479,0002 bd2 ba1,496 sqft$320/sqft0.28 mi1 days
$420,0002 bd2 ba1,616 sqft$260/sqft0.29 mi57 daysSold 2026-09-29
Nearest comparable sales and listings
12 comparables · median price $462,250 · range $400,000 – $610,000 · median $/sq ft $294 · average $/sq ft $296
| Address | Status | Price | $/Sq Ft | Bd / Ba | Sq Ft | Sold / market time | Distance |
|---|---|---|---|---|---|---|---|
| 3065 Olivia Heights Avenue | Sold | $610,000 | $348 | 3 / 3 | 1,754 | Sold 2026-09-08 | 0.02 mi |
| 3086 Ripe Peak Lane | Sold | $555,000 | $301 | 3 / 2 | 1,844 | Sold 2026-09-29 | 0.14 mi |
| 2143 Oliver Springs Street | Active | $475,000 | $326 | 2 / 2 | 1,456 | 34 days on market | 0.16 mi |
| 2126 Oliver Springs Street | Active | $429,900 | $287 | 2 / 2 | 1,496 | 0 days on market | 0.20 mi |
| 2072 Fort Halifax Street | Active | $434,000 | $270 | 3 / 2 | 1,610 | 205 days on market | 0.20 mi |
| 2138 Oliver Springs Street | Sold | $454,500 | $304 | 2 / 2 | 1,496 | Sold 2026-07-17 | 0.20 mi |
| 2077 Wildwood Lake Street | Sold | $440,000 | $280 | 2 / 2 | 1,569 | Sold 2026-09-22 | 0.24 mi |
| 2090 Oliver Springs Street | Active | $470,000 | $288 | 2 / 2 | 1,632 | 1 days on market | 0.27 mi |
| 3073 Brownbirds Nest Drive | Active | $479,000 | $320 | 2 / 2 | 1,496 | 1 days on market | 0.28 mi |
| 2141 Colvin Run Drive | Sold | $420,000 | $260 | 2 / 2 | 1,616 | Sold 2026-09-29 | 0.29 mi |
| 2096 Mountain City Street | Active | $528,000 | $328 | 3 / 2 | 1,610 | 81 days on market | 0.31 mi |
| 2084 Mountain City Street | Sold | $400,000 | $245 | 2 / 2 | 1,632 | Sold 2026-08-21 | 0.32 mi |


