
Comparable Sales Near 2138 Grand Traverse Street, Henderson, NV 89052
1st Realty · Comparable sales report · 1st.estate · October 20, 2026
Read the Sun City Anthem neighborhood guide →
2138 Grand Traverse Street, Henderson, NV 89052
Status: Sold
$435,000 Sold Price
$294
$ / Sq Ft
1,482
Living Area
5,663 sqft
Lot Size
3
Beds
3
Baths
2002
Year Built
Search Parameters
Property Type
Status
Radius
Sold Within
Beds
Baths
Living Area (Sq Ft)
Lot Size (Sq Ft)
This comp search reflects your current search parameters — adjust the filters above as needed for a more accurate estimate.
Estimated Value
—
Average $/Sqft
—
Check one or more comps below to calculate an estimate.
Nearest 10 of 70 comparable sales and listings within 1 mile of this home. Use the filters above and press Search to refine.
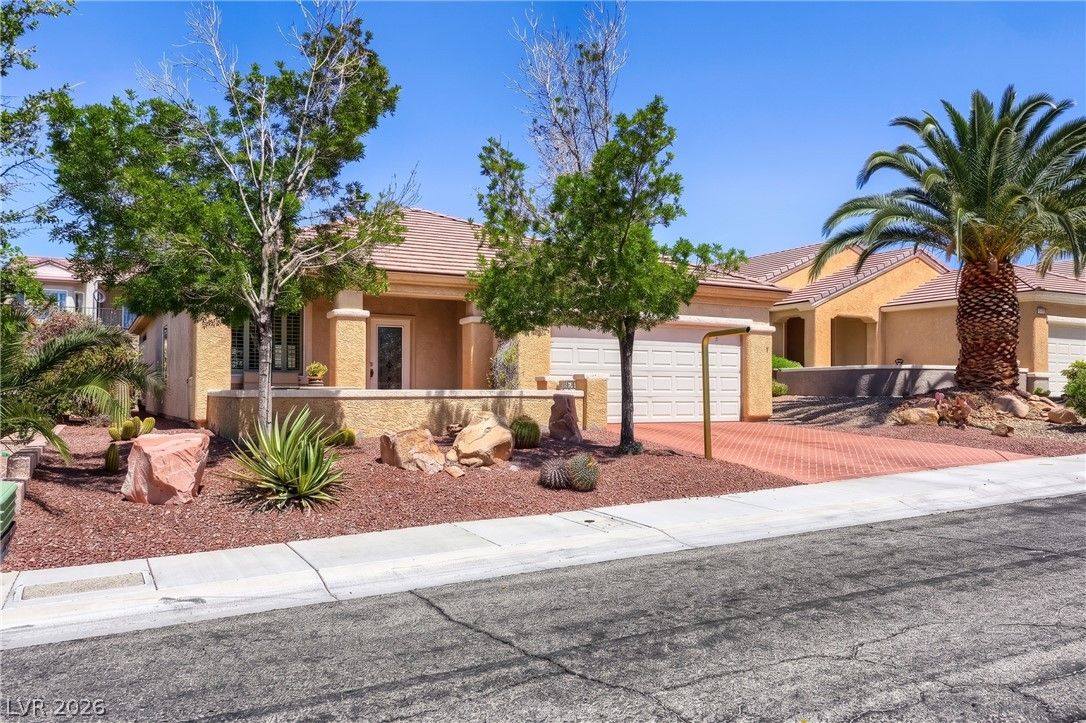
$425,0002 bd2 ba1,585 sqft$268/sqft0.21 mi109 daysSold 2026-09-16
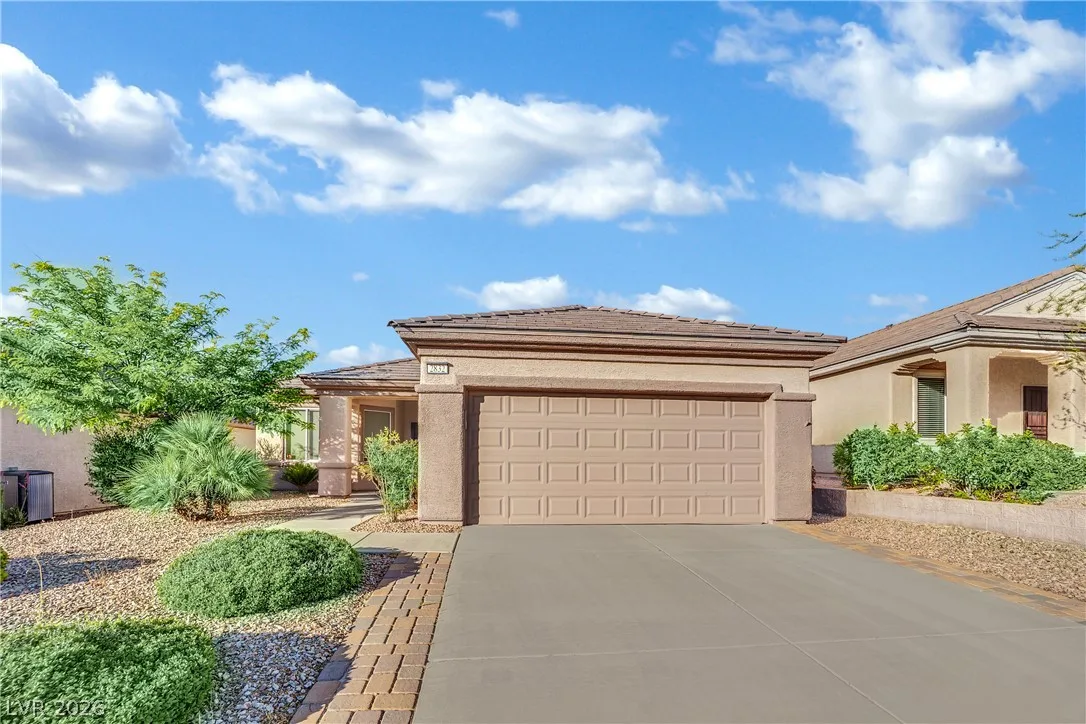
2832 Goldcreek StreetActive
$419,9002 bd2 ba1,466 sqft$286/sqft0.25 mi0 days
$635,0002 bd2 ba1,524 sqft$417/sqft0.26 mi8 daysSold 2026-06-01
$447,0002 bd2 ba1,585 sqft$282/sqft0.37 mi69 daysSold 2026-07-21
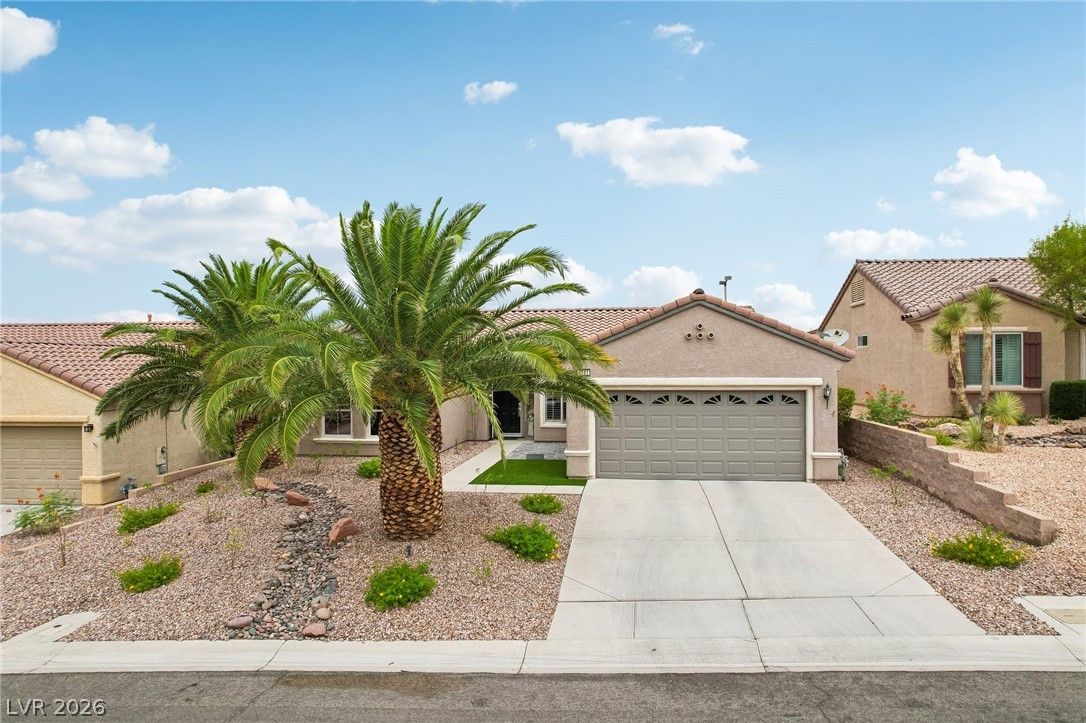
$420,0002 bd2 ba1,616 sqft$260/sqft0.41 mi57 daysSold 2026-09-29
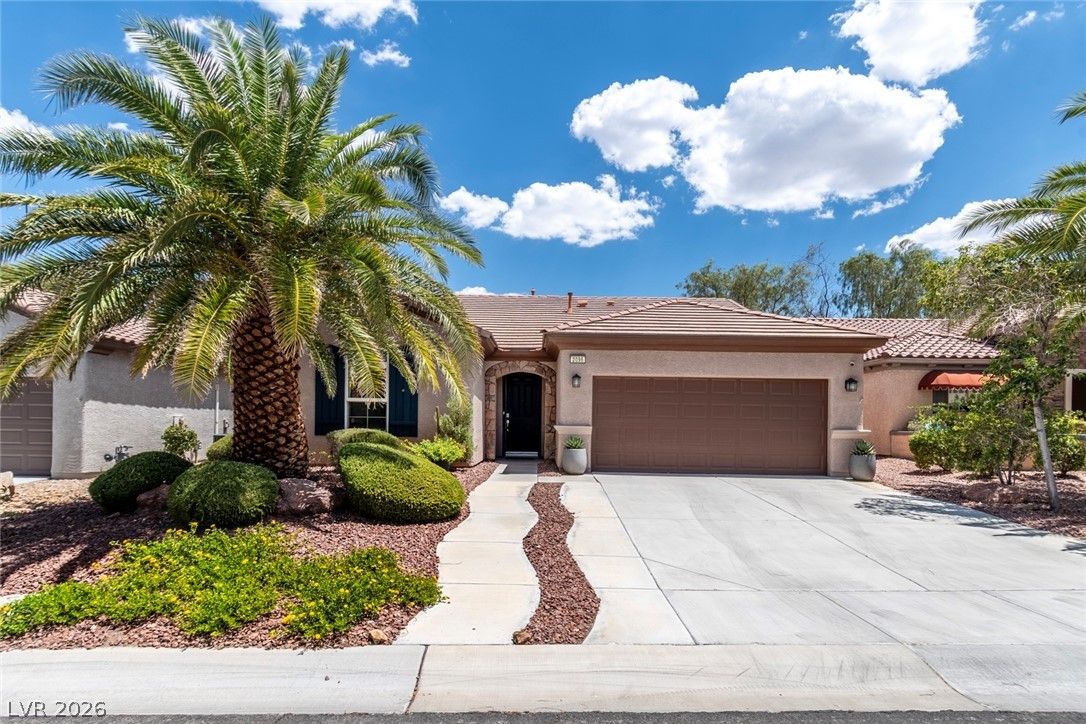
$528,0003 bd2 ba1,610 sqft$328/sqft0.46 mi81 days
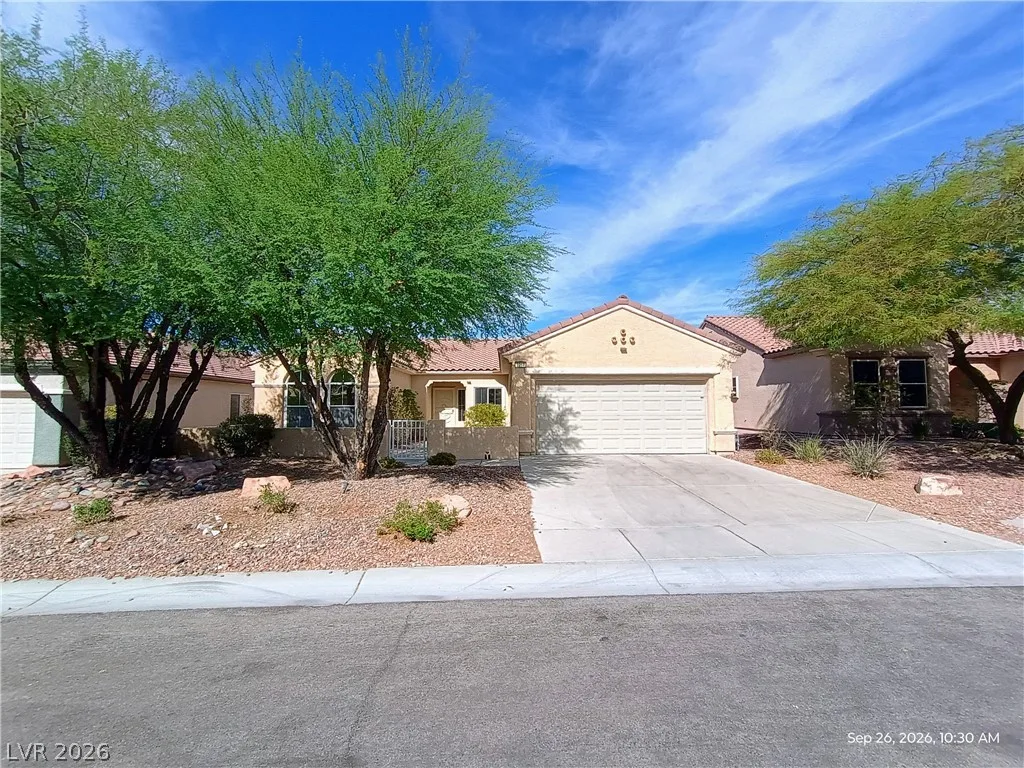
(no address on file)Active
$479,0002 bd2 ba1,632 sqft$294/sqft0.47 mi4 days
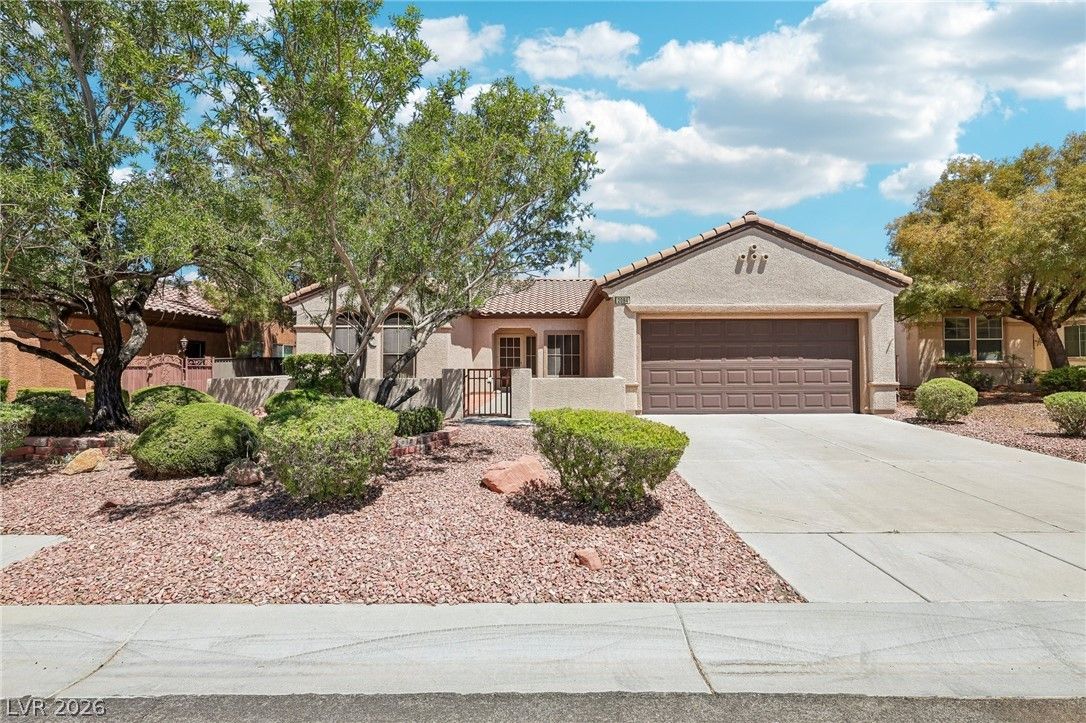
$400,0002 bd2 ba1,632 sqft$245/sqft0.47 mi76 daysSold 2026-08-21
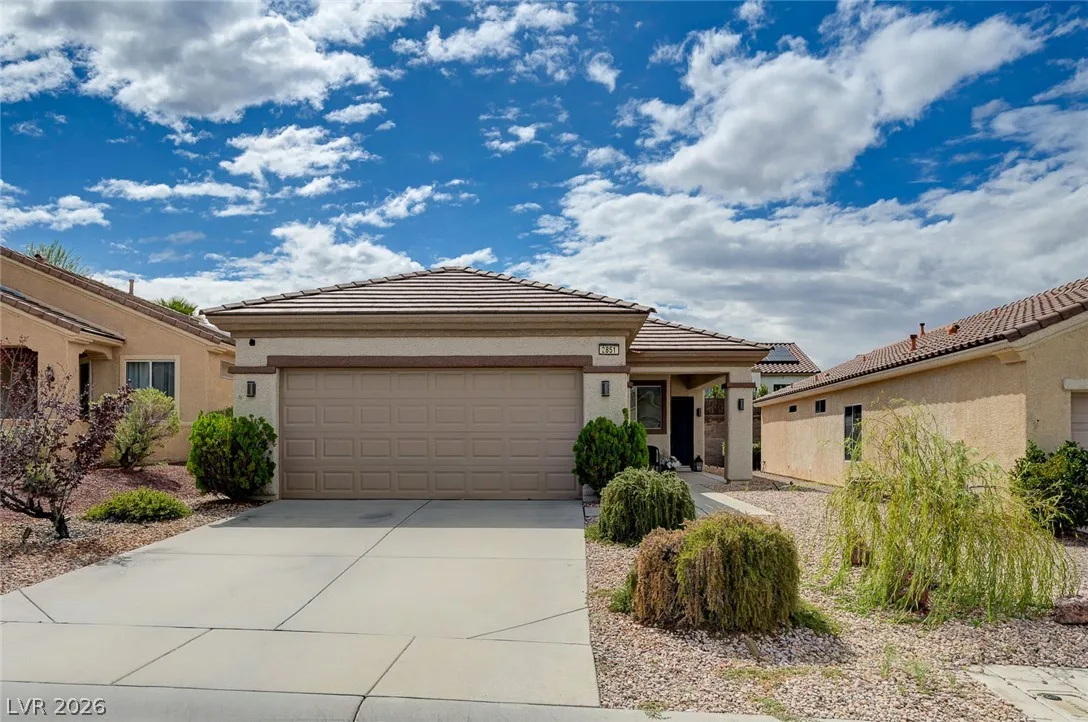
$419,0002 bd2 ba1,160 sqft$361/sqft0.48 mi18 days
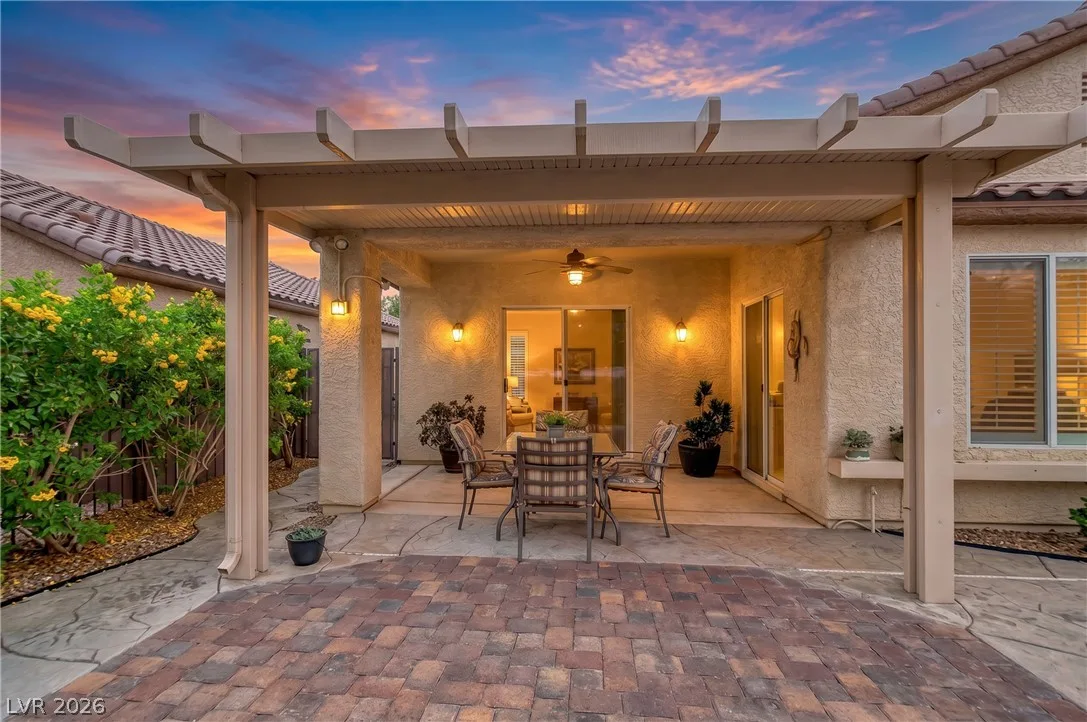
2328 Fossil Canyon DriveUnder Contract
$397,9003 bd3 ba1,340 sqft$297/sqft0.48 mi8 days
Nearest comparable sales and listings
12 comparables · median price $422,500 · range $389,900 – $635,000 · median $/sq ft $290 · average $/sq ft $305
| Address | Status | Price | $/Sq Ft | Bd / Ba | Sq Ft | Sold / market time | Distance |
|---|---|---|---|---|---|---|---|
| 2812 Goldcreek Street | Sold | $425,000 | $268 | 2 / 2 | 1,585 | Sold 2026-09-16 | 0.21 mi |
| 2832 Goldcreek Street | Active | $419,900 | $286 | 2 / 2 | 1,466 | 0 days on market | 0.25 mi |
| 2831 Goldcreek Street | Sold | $635,000 | $417 | 2 / 2 | 1,524 | Sold 2026-06-01 | 0.26 mi |
| 2880 Goldcreek Street | Sold | $447,000 | $282 | 2 / 2 | 1,585 | Sold 2026-07-21 | 0.37 mi |
| 2141 Colvin Run Drive | Sold | $420,000 | $260 | 2 / 2 | 1,616 | Sold 2026-09-29 | 0.41 mi |
| 2096 Mountain City Street | Active | $528,000 | $328 | 3 / 2 | 1,610 | 81 days on market | 0.46 mi |
| (no address on file) | Active | $479,000 | $294 | 2 / 2 | 1,632 | 4 days on market | 0.47 mi |
| 2084 Mountain City Street | Sold | $400,000 | $245 | 2 / 2 | 1,632 | Sold 2026-08-21 | 0.47 mi |
| 2851 Sapphire Desert Drive | Active | $419,000 | $361 | 2 / 2 | 1,160 | 18 days on market | 0.48 mi |
| 2328 Fossil Canyon Drive | Under Contract | $397,900 | $297 | 3 / 3 | 1,340 | 8 days on market | 0.48 mi |
| 2815 Sapphire Desert Drive | Sold | $389,900 | $336 | 2 / 2 | 1,160 | Sold 2026-05-22 | 0.48 mi |
| 2126 Oliver Springs Street | Active | $429,900 | $287 | 2 / 2 | 1,496 | 0 days on market | 0.50 mi |


