
Comparable Sales Near 3228 Jumping Hills Avenue, Henderson, NV 89052
1st Realty · Comparable sales report · 1st.estate · October 20, 2026
Read the Seven Hills neighborhood guide →
3228 Jumping Hills Avenue, Henderson, NV 89052
Status: Sold
$505,000 Sold Price
$313
$ / Sq Ft
1,612
Living Area
6,970 sqft
Lot Size
3
Beds
2
Baths
2000
Year Built
Search Parameters
Property Type
Status
Radius
Sold Within
Beds
Baths
Living Area (Sq Ft)
Lot Size (Sq Ft)
This comp search reflects your current search parameters — adjust the filters above as needed for a more accurate estimate.
Estimated Value
—
Average $/Sqft
—
Check one or more comps below to calculate an estimate.
Nearest 10 of 17 comparable sales and listings within 1 mile of this home. Use the filters above and press Search to refine.
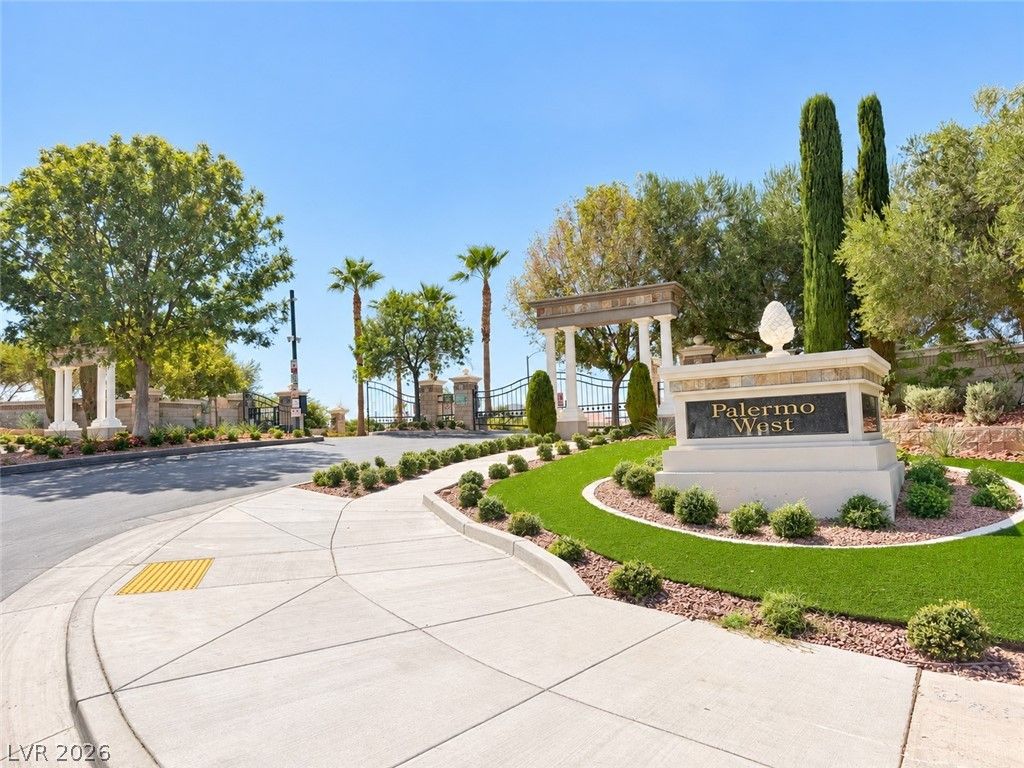
1472 Dragon Rock DriveActive
$476,0003 bd2 ba1,454 sqft$327/sqft0.03 mi5 days
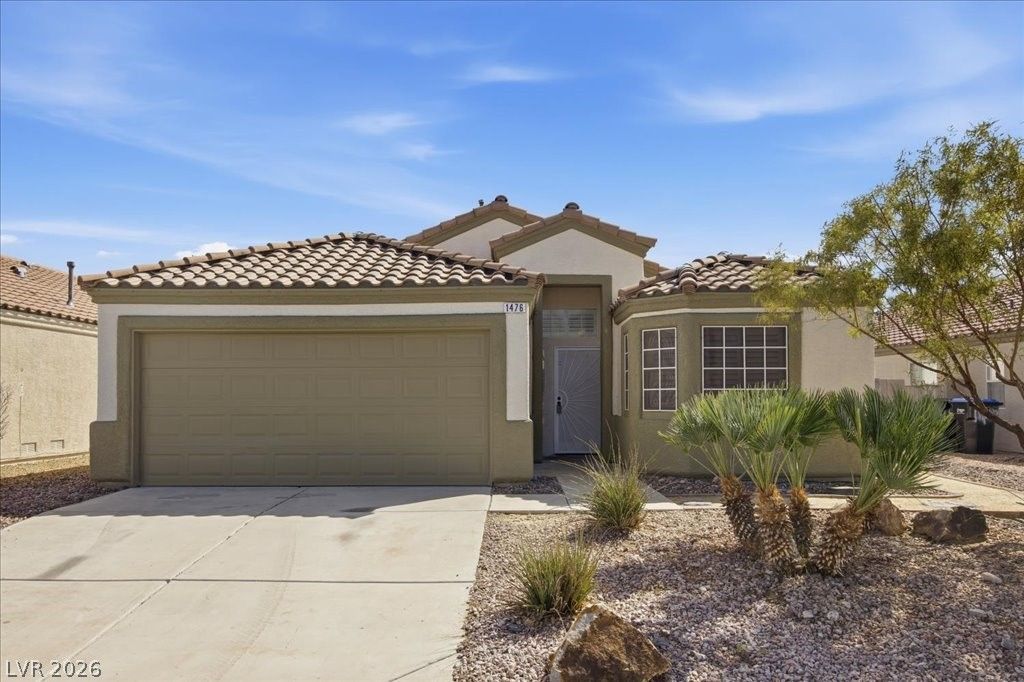
$450,0003 bd2 ba1,612 sqft$279/sqft0.03 mi76 daysSold 2026-08-25
$517,0003 bd2 ba1,612 sqft$321/sqft0.16 mi77 daysSold 2026-05-29
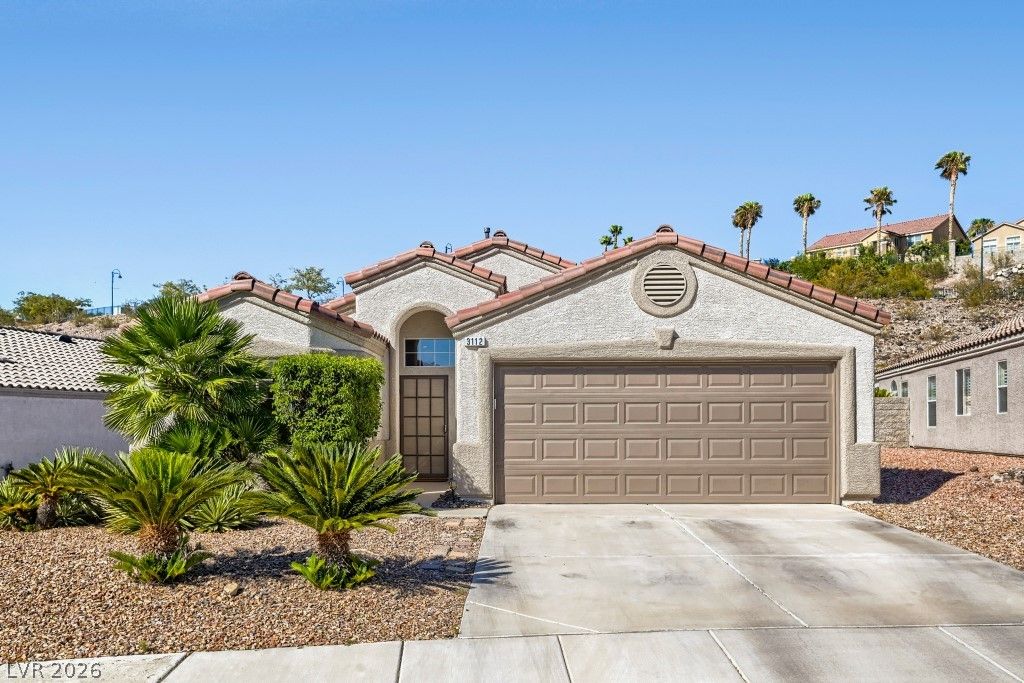
$565,0003 bd2 ba1,612 sqft$350/sqft0.28 mi4 daysSold 2026-08-21
$478,0002 bd2 ba1,242 sqft$385/sqft0.38 mi4 daysSold 2026-06-23
$550,0003 bd3 ba1,964 sqft$280/sqft0.44 mi104 daysSold 2026-07-02
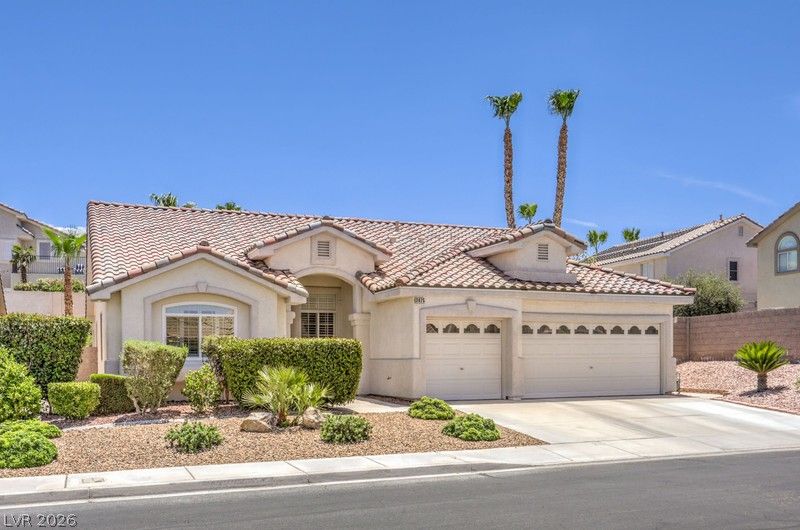
3075 Misty Moon AvenueActive
$642,0003 bd2 ba1,718 sqft$374/sqft0.48 mi33 days
$669,9994 bd3 ba1,964 sqft$341/sqft0.49 mi63 daysSold 2026-06-22
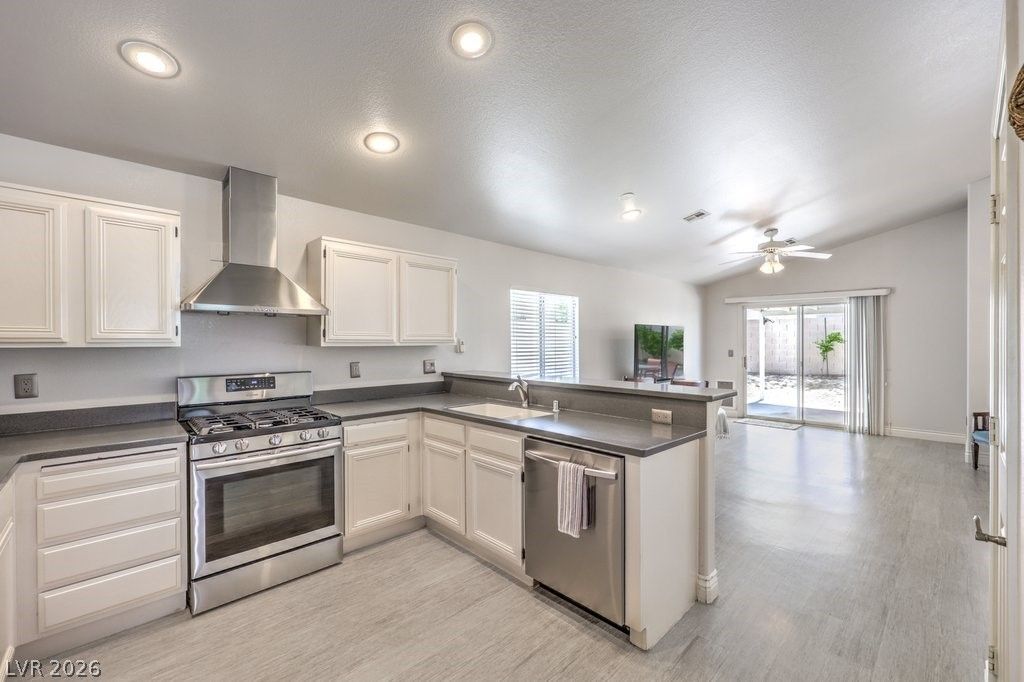
$474,9002 bd2 ba1,438 sqft$330/sqft0.57 mi93 days
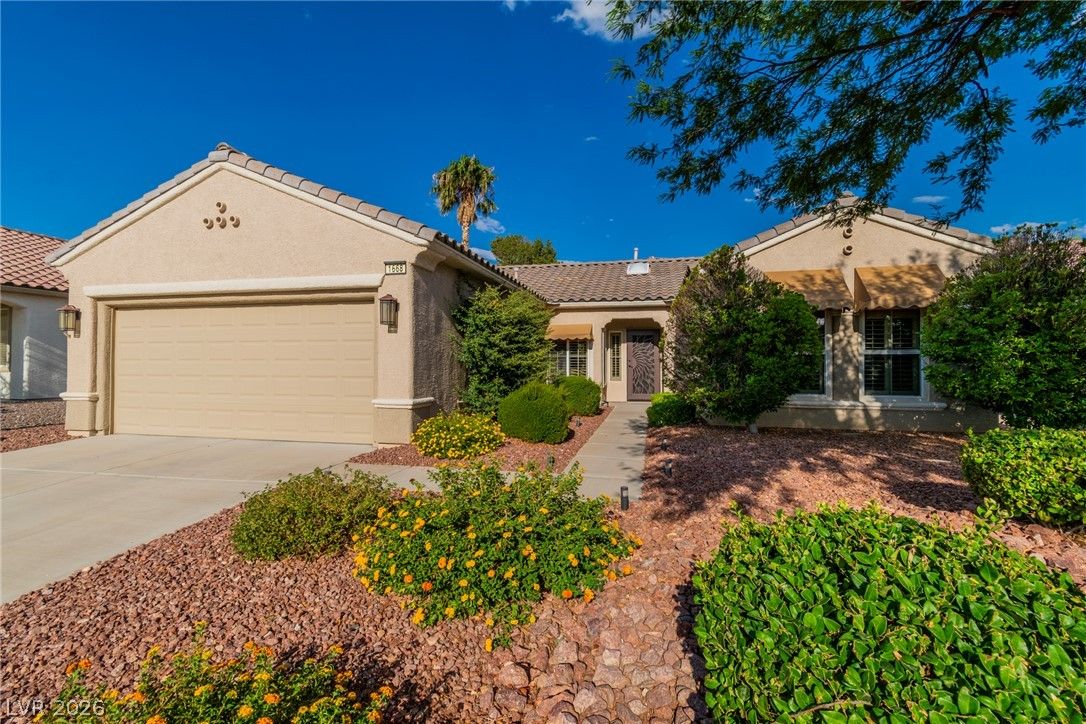
1668 Sebring Hills DriveUnder Contract
$480,0002 bd2 ba1,632 sqft$294/sqft0.68 mi28 days
Nearest comparable sales and listings
12 comparables · median price $479,000 · range $395,000 – $669,999 · median $/sq ft $325 · average $/sq ft $326
| Address | Status | Price | $/Sq Ft | Bd / Ba | Sq Ft | Sold / market time | Distance |
|---|---|---|---|---|---|---|---|
| 1472 Dragon Rock Drive | Active | $476,000 | $327 | 3 / 2 | 1,454 | 5 days on market | 0.03 mi |
| 1476 Dragon Rock Drive | Sold | $450,000 | $279 | 3 / 2 | 1,612 | Sold 2026-08-25 | 0.03 mi |
| 1517 Silver Sunset Drive | Sold | $517,000 | $321 | 3 / 2 | 1,612 | Sold 2026-05-29 | 0.16 mi |
| 3112 Twilight Hills Avenue | Sold | $565,000 | $350 | 3 / 2 | 1,612 | Sold 2026-08-21 | 0.28 mi |
| 3105 Whispering Canyon Court | Sold | $478,000 | $385 | 2 / 2 | 1,242 | Sold 2026-06-23 | 0.38 mi |
| 1299 Echo Creek Street | Sold | $550,000 | $280 | 3 / 3 | 1,964 | Sold 2026-07-02 | 0.44 mi |
| 3075 Misty Moon Avenue | Active | $642,000 | $374 | 3 / 2 | 1,718 | 33 days on market | 0.48 mi |
| 3071 Misty Moon Avenue | Sold | $669,999 | $341 | 4 / 3 | 1,964 | Sold 2026-06-22 | 0.49 mi |
| 1245 Diamond Valley Street | Active | $474,900 | $330 | 2 / 2 | 1,438 | 93 days on market | 0.57 mi |
| 1668 Sebring Hills Drive | Under Contract | $480,000 | $294 | 2 / 2 | 1,632 | 28 days on market | 0.68 mi |
| 1246 Pale Morning Street | Active | $465,000 | $323 | 3 / 2 | 1,438 | 62 days on market | 0.70 mi |
| 1664 Black Fox Canyon Road | Active | $395,000 | $309 | 2 / 2 | 1,280 | 64 days on market | 0.76 mi |


