
Comparable Sales Near 2358 Ozark Plateau Drive, Henderson, NV 89044
1st Realty · Comparable sales report · 1st.estate · October 20, 2026
Read the Sun City Anthem neighborhood guide →
2358 Ozark Plateau Drive, Henderson, NV 89044
Status: Sold
$2,895 Sold Price
$1
$ / Sq Ft
3,172
Living Area
8,712 sqft
Lot Size
2
Beds
3
Baths
2006
Year Built
Search Parameters
Property Type
Status
Radius
Sold Within
Beds
Baths
Living Area (Sq Ft)
Lot Size (Sq Ft)
This comp search reflects your current search parameters — adjust the filters above as needed for a more accurate estimate.
Estimated Value
—
Average $/Sqft
—
Check one or more comps below to calculate an estimate.
Nearest 10 of 57 comparable sales and listings within 1 mile of this home. Use the filters above and press Search to refine.
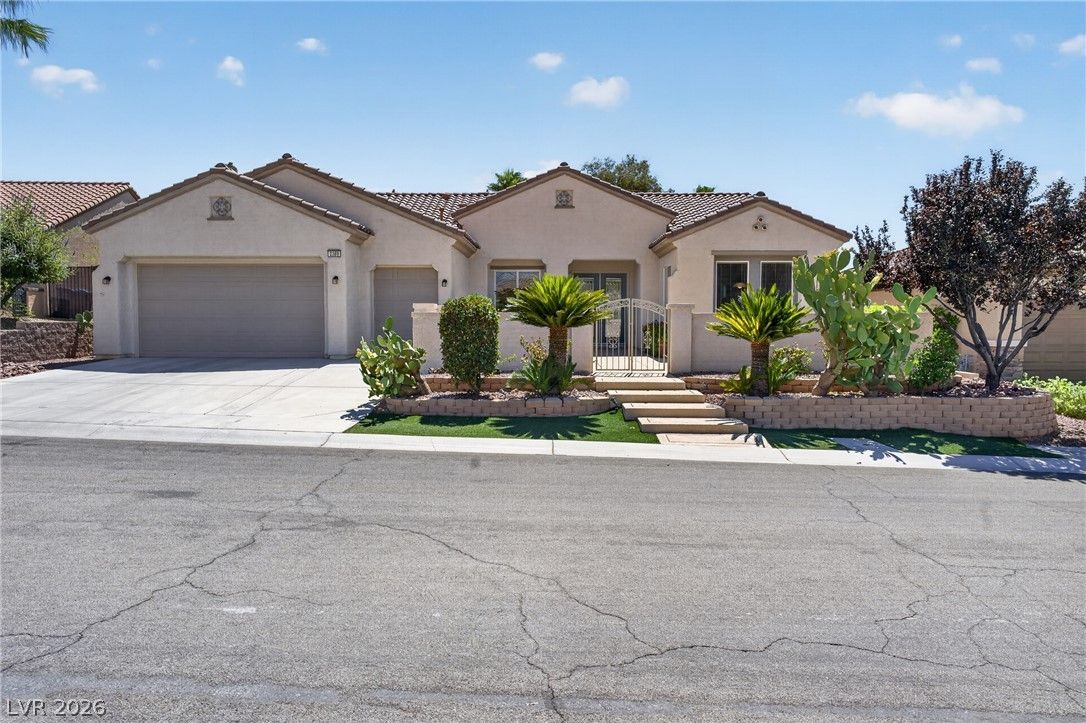
$719,9992 bd3 ba2,638 sqft$273/sqft0.12 mi61 days
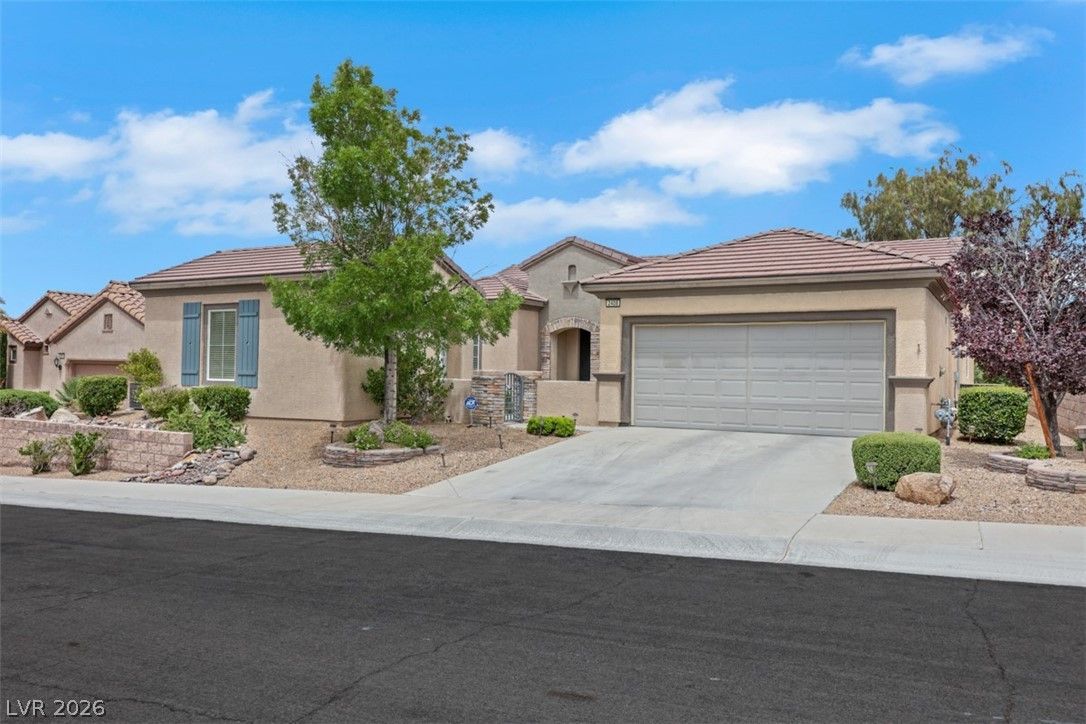
$580,0003 bd3 ba2,400 sqft$242/sqft0.14 mi122 daysSold 2026-09-30
$725,0002 bd3 ba2,638 sqft$275/sqft0.19 mi31 daysSold 2026-04-24
$625,0002 bd3 ba2,592 sqft$241/sqft0.23 mi246 daysSold 2026-06-16
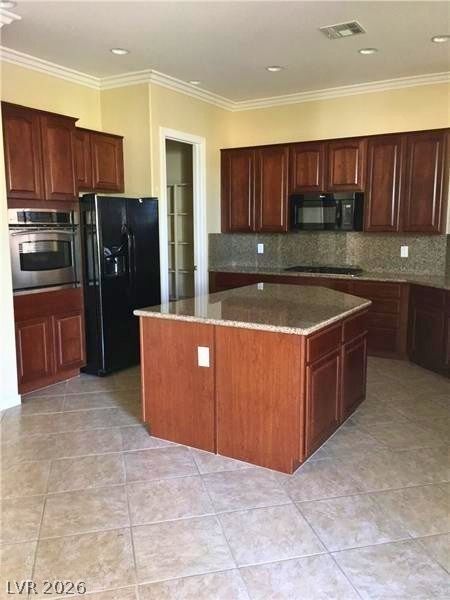
$799,9002 bd3 ba2,592 sqft$309/sqft0.24 mi2 days
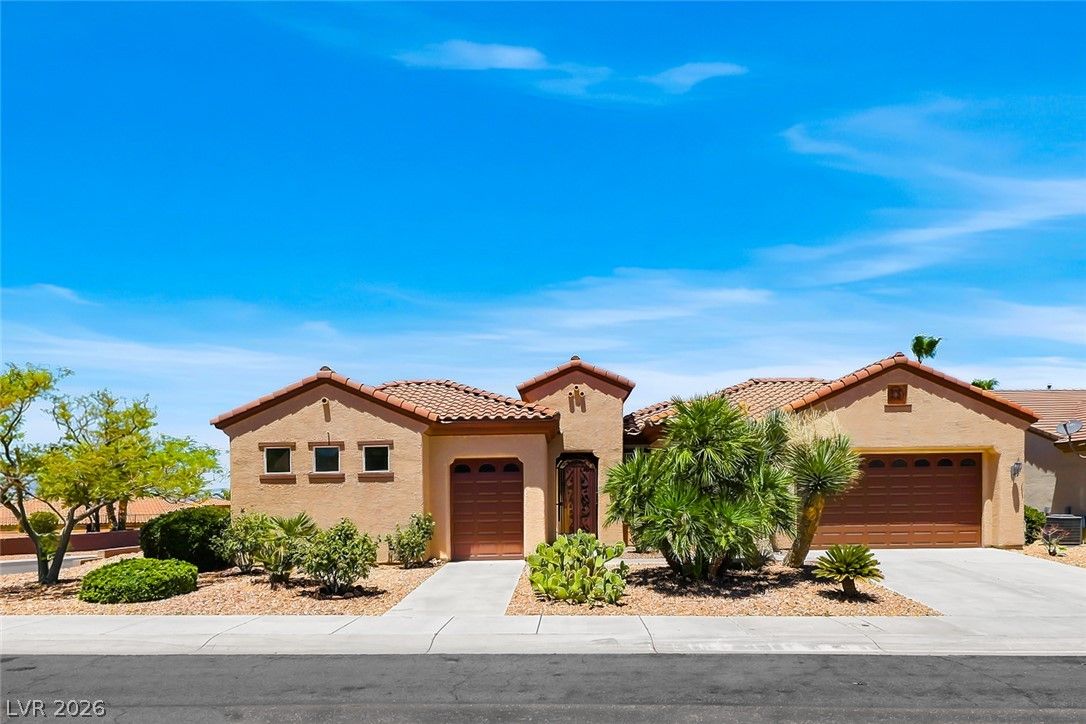
$689,0003 bd4 ba2,708 sqft$254/sqft0.26 mi27 daysSold 2026-08-31
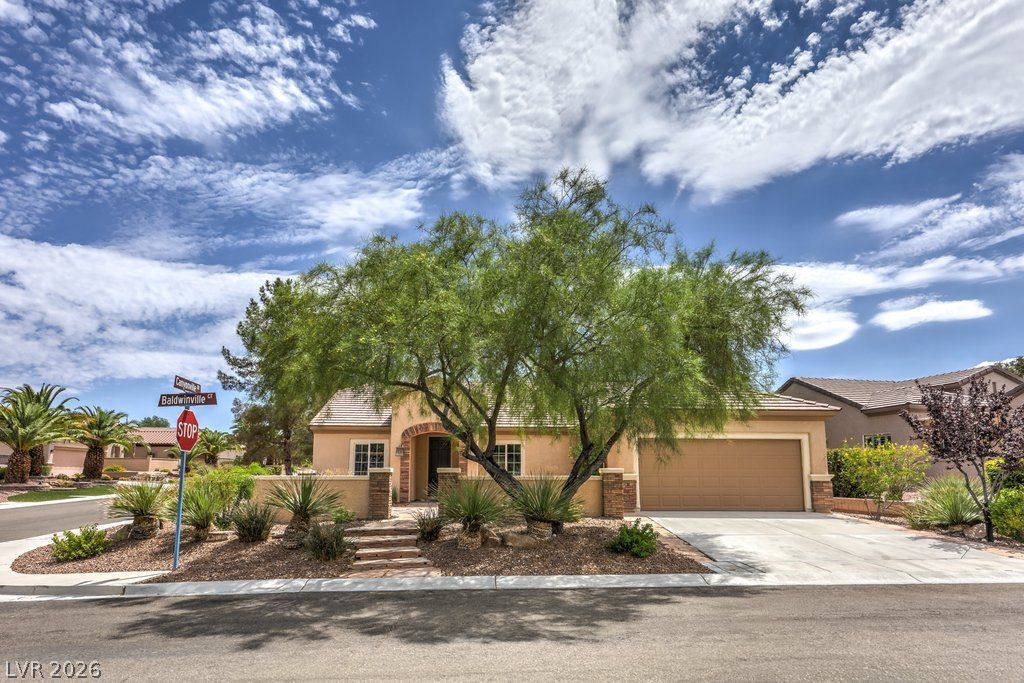
$568,0002 bd2 ba2,401 sqft$237/sqft0.29 mi33 daysSold 2026-09-22
$805,0003 bd3 ba3,172 sqft$254/sqft0.31 mi65 daysSold 2026-06-02
$819,0002 bd3 ba2,638 sqft$310/sqft0.32 mi5 days
$740,0003 bd4 ba2,827 sqft$262/sqft0.33 mi65 daysSold 2026-05-01
Nearest comparable sales and listings
12 comparables · median price $707,500 · range $568,000 – $819,000 · median $/sq ft $254 · average $/sq ft $262
| Address | Status | Price | $/Sq Ft | Bd / Ba | Sq Ft | Sold / market time | Distance |
|---|---|---|---|---|---|---|---|
| 2389 Black River Falls Drive | Active | $719,999 | $273 | 2 / 3 | 2,638 | 61 days on market | 0.12 mi |
| 2408 Black River Falls Drive | Sold | $580,000 | $242 | 3 / 3 | 2,400 | Sold 2026-09-30 | 0.14 mi |
| 2421 Black River Falls Drive | Sold | $725,000 | $275 | 2 / 3 | 2,638 | Sold 2026-04-24 | 0.19 mi |
| 2183 Clearwater Lake Drive | Sold | $625,000 | $241 | 2 / 3 | 2,592 | Sold 2026-06-16 | 0.23 mi |
| 2175 Clearwater Lake Drive | Active | $799,900 | $309 | 2 / 3 | 2,592 | 2 days on market | 0.24 mi |
| 2175 Twin Falls Drive | Sold | $689,000 | $254 | 3 / 4 | 2,708 | Sold 2026-08-31 | 0.26 mi |
| 2364 Baldwinville Court | Sold | $568,000 | $237 | 2 / 2 | 2,401 | Sold 2026-09-22 | 0.29 mi |
| 2252 Savannah River Street | Sold | $805,000 | $254 | 3 / 3 | 3,172 | Sold 2026-06-02 | 0.31 mi |
| 2147 Clearwater Lake Drive | Active | $819,000 | $310 | 2 / 3 | 2,638 | 5 days on market | 0.32 mi |
| 2288 Merrimack Valley Avenue | Sold | $740,000 | $262 | 3 / 4 | 2,827 | Sold 2026-05-01 | 0.33 mi |
| 2517 Black River Falls Drive | Sold | $578,000 | $241 | 3 / 3 | 2,400 | Sold 2026-09-15 | 0.36 mi |
| 2585 Portsmouth Creek Avenue | Sold | $695,000 | $246 | 3 / 4 | 2,827 | Sold 2026-07-07 | 0.38 mi |


