
Comparable Sales Near 1779 Sebring Hills Drive, Henderson, NV 89052
1st Realty · Comparable sales report · 1st.estate · October 21, 2026
Read the Sun City Anthem neighborhood guide →
1779 Sebring Hills Drive, Henderson, NV 89052
Status: Sold
$890,000 Sold Price
$280
$ / Sq Ft
3,175
Living Area
8,712 sqft
Lot Size
3
Beds
3
Baths
2001
Year Built
Search Parameters
Property Type
Status
Radius
Sold Within
Beds
Baths
Living Area (Sq Ft)
Lot Size (Sq Ft)
This comp search reflects your current search parameters — adjust the filters above as needed for a more accurate estimate.
Estimated Value
—
Average $/Sqft
—
Check one or more comps below to calculate an estimate.
Nearest 10 of 28 comparable sales and listings within 1 mile of this home. Use the filters above and press Search to refine.
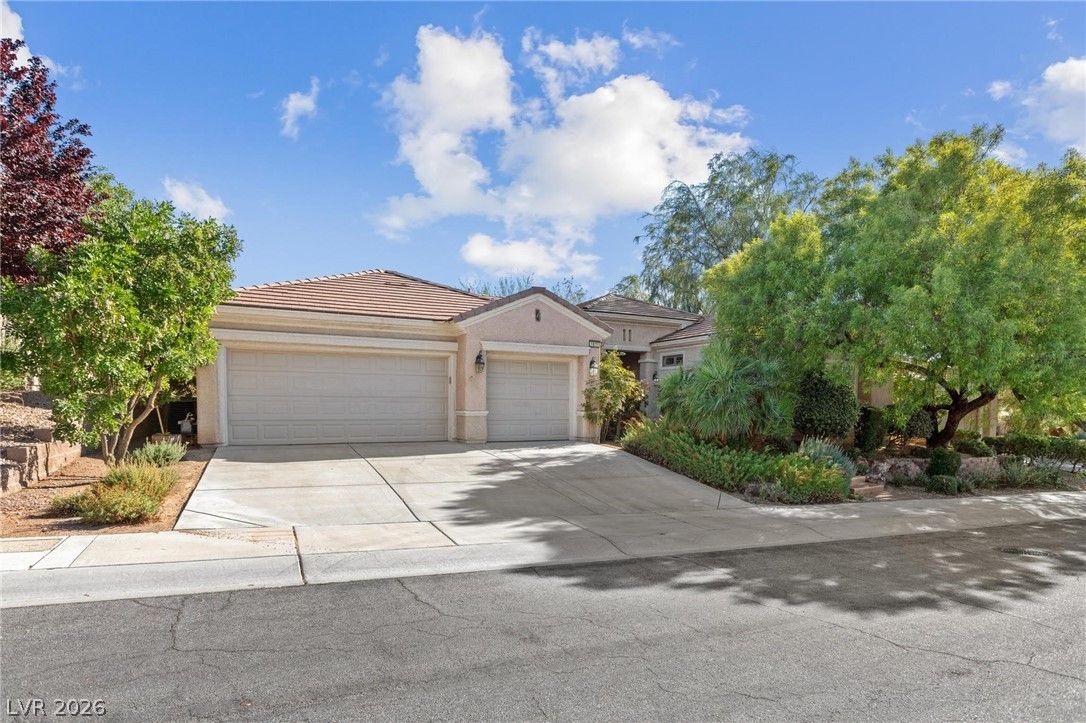
$710,3002 bd3 ba2,988 sqft$238/sqft0.23 mi27 daysSold 2026-08-25

1831 Morganton DriveActive
$665,0002 bd3 ba2,592 sqft$257/sqft0.26 mi136 days
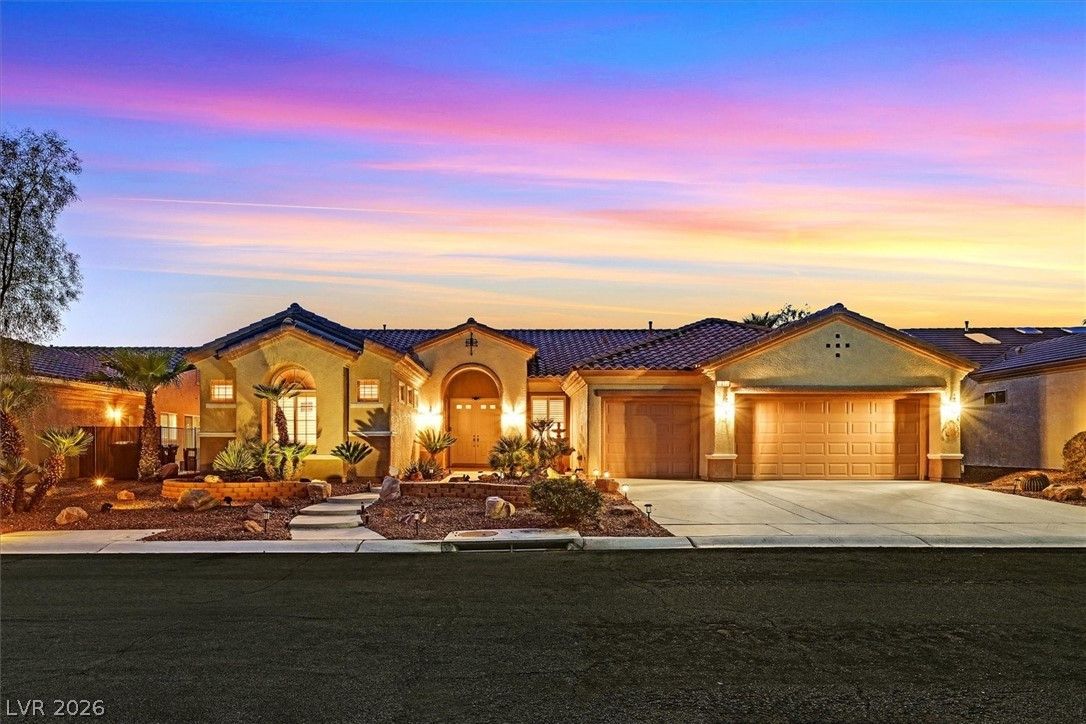
$865,0003 bd3 ba2,446 sqft$354/sqft0.27 mi90 days
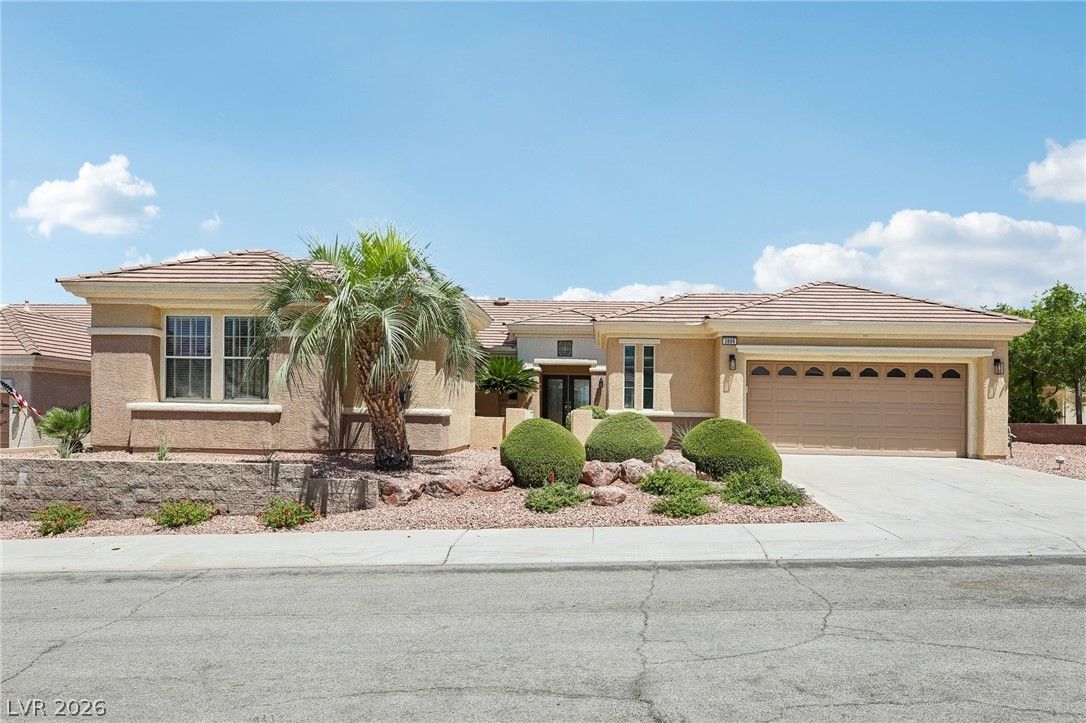
3006 Canal Walk RoadActive
$724,9003 bd3 ba2,444 sqft$297/sqft0.29 mi95 days
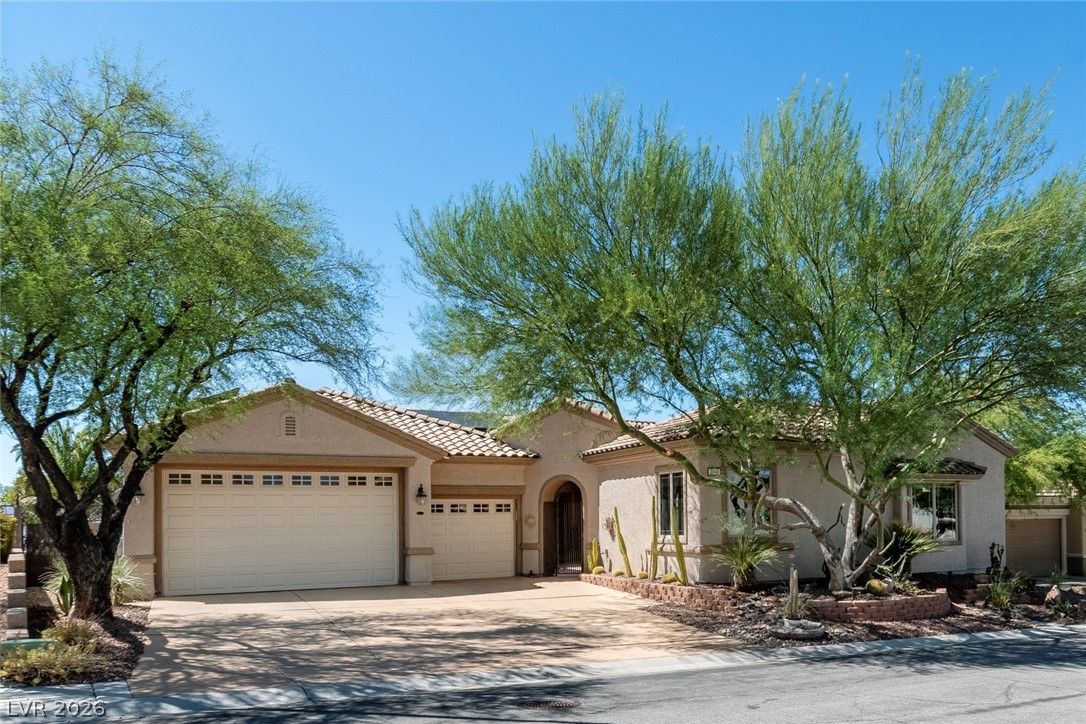
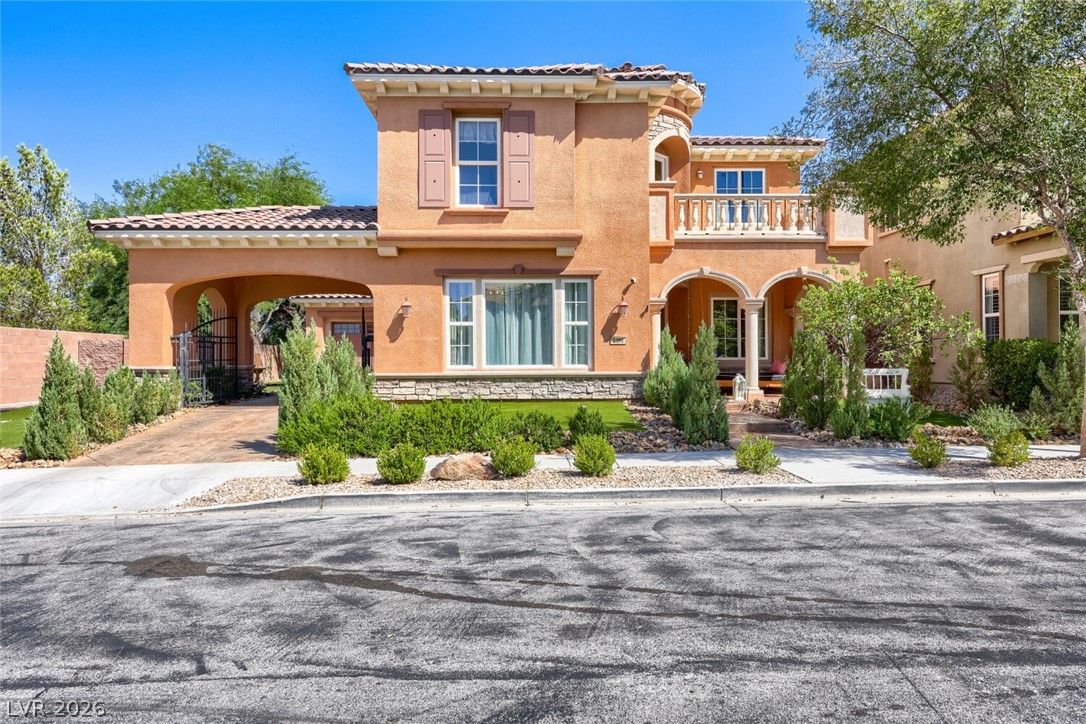
$1,244,0003 bd4 ba3,081 sqft$404/sqft0.30 mi23 daysSold 2026-10-16
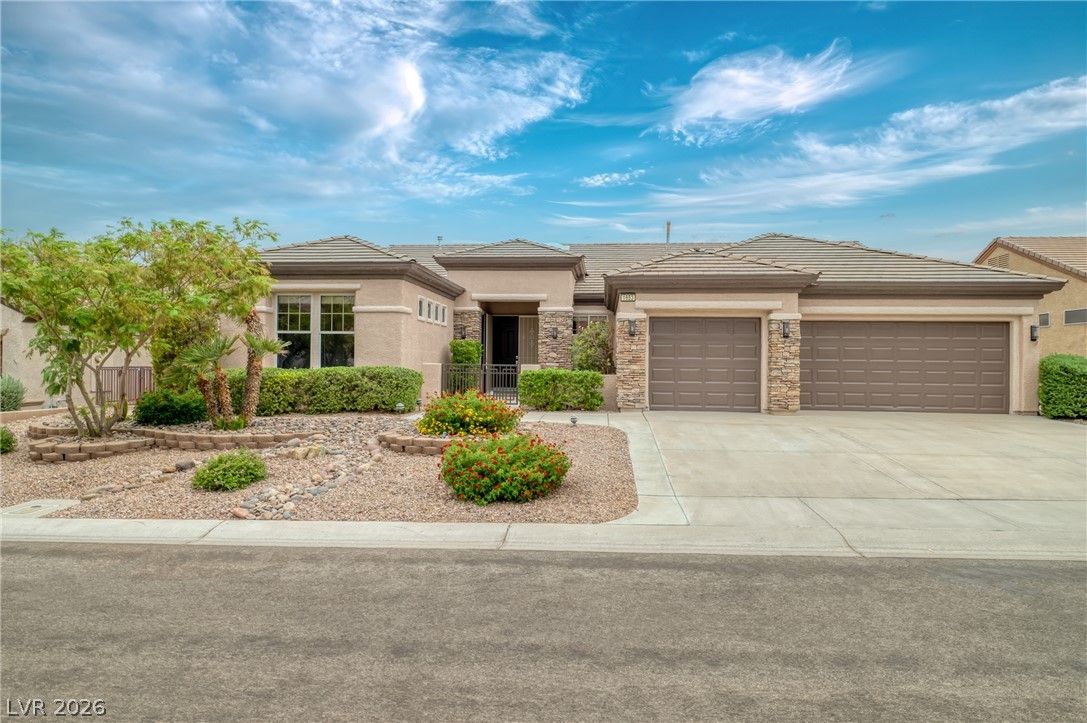
$999,7774 bd4 ba3,014 sqft$332/sqft0.37 mi48 days
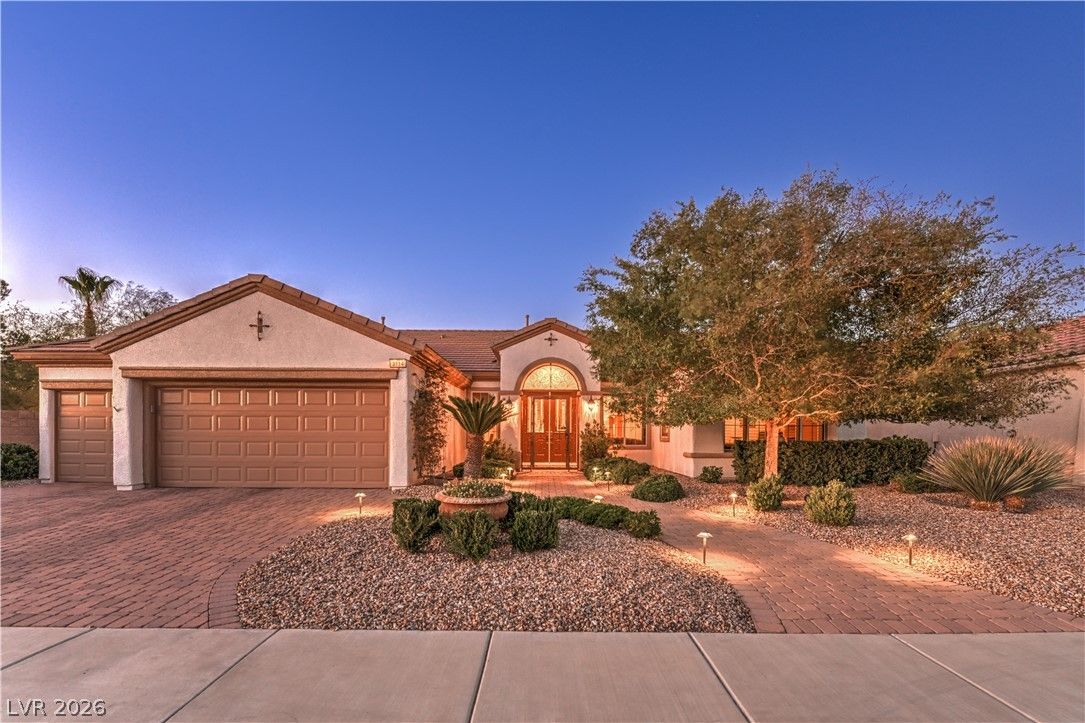
$925,0003 bd3 ba2,592 sqft$357/sqft0.43 mi18 daysSold 2026-09-08
3114 Scotts Valley DriveActive
$829,0002 bd3 ba2,769 sqft$299/sqft0.49 mi42 days
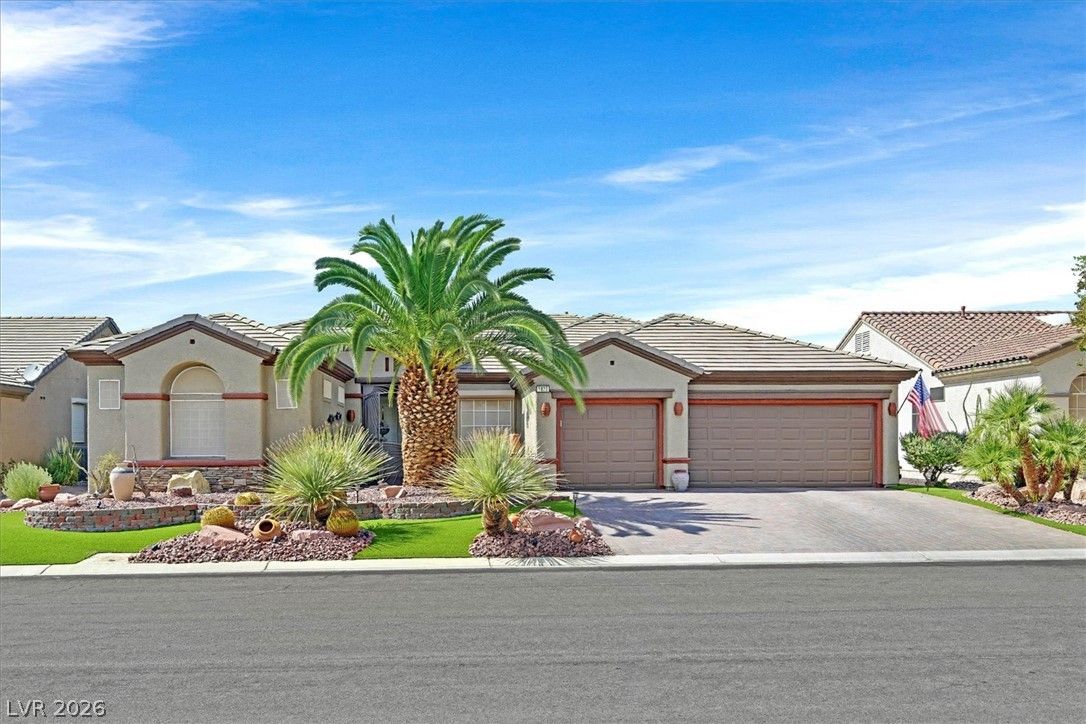
1823 Baton Rouge StreetPending
$899,0002 bd3 ba2,988 sqft$301/sqft0.54 mi22 days
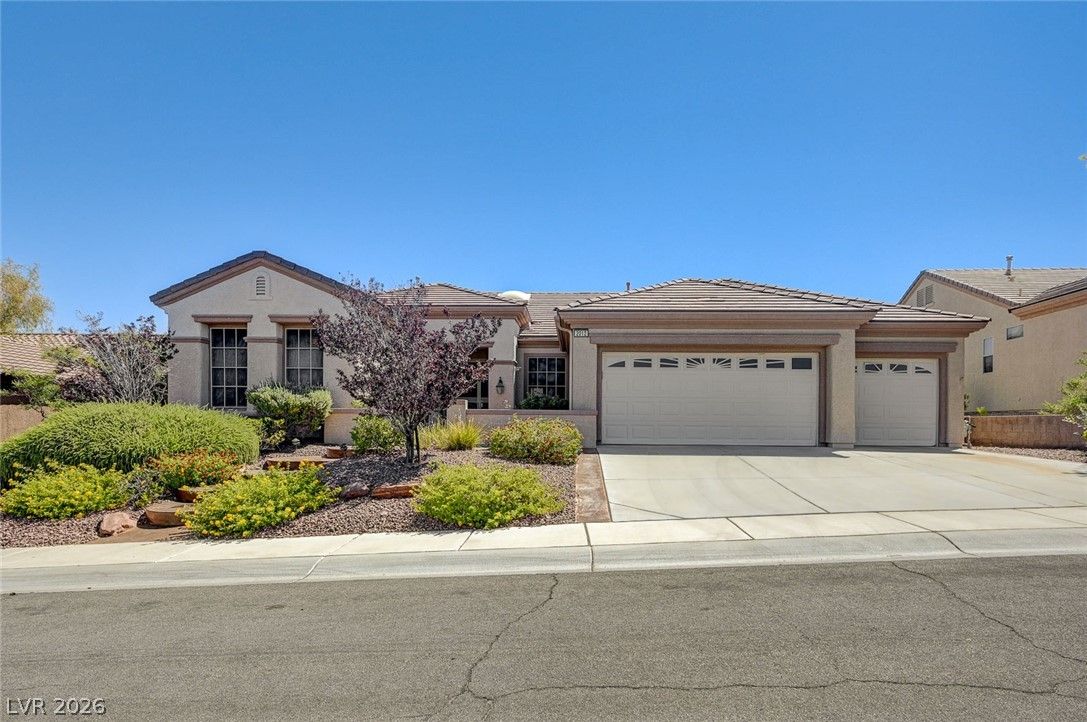
$810,0002 bd3 ba2,576 sqft$314/sqft0.55 mi11 daysSold 2026-07-24
Nearest comparable sales and listings
12 comparables · median price $829,500 · range $665,000 – $1,244,000 · median $/sq ft $308 · average $/sq ft $312
| Address | Status | Price | $/Sq Ft | Bd / Ba | Sq Ft | Sold / market time | Distance |
|---|---|---|---|---|---|---|---|
| 1805 Prichard Avenue | Sold | $710,300 | $238 | 2 / 3 | 2,988 | Sold 2026-08-25 | 0.23 mi |
| 1831 Morganton Drive | Active | $665,000 | $257 | 2 / 3 | 2,592 | 136 days on market | 0.26 mi |
| 1677 Black Fox Canyon Road | Active | $865,000 | $354 | 3 / 3 | 2,446 | 90 days on market | 0.27 mi |
| 3006 Canal Walk Road | Active | $724,900 | $297 | 3 / 3 | 2,444 | 95 days on market | 0.29 mi |
| 3046 Sumter Valley Circle | Sold | $1,244,000 | $404 | 3 / 4 | 3,081 | Sold 2026-10-16 | 0.30 mi |
| 3198 Stella Cilento Avenue | Active | $999,777 | $332 | 4 / 4 | 3,014 | 48 days on market | 0.37 mi |
| 1653 Wellington Springs Avenue | Sold | $925,000 | $357 | 3 / 3 | 2,592 | Sold 2026-09-08 | 0.43 mi |
| 3114 Scotts Valley Drive | Active | $829,000 | $299 | 2 / 3 | 2,769 | 42 days on market | 0.49 mi |
| 1823 Baton Rouge Street | Pending | $899,000 | $301 | 2 / 3 | 2,988 | 22 days on market | 0.54 mi |
| 2012 Oliver Springs Street | Sold | $810,000 | $314 | 2 / 3 | 2,576 | Sold 2026-07-24 | 0.55 mi |
| 2875 Scotts Valley Drive | Sold | $830,000 | $320 | 2 / 3 | 2,592 | Sold 2026-08-05 | 0.57 mi |
| 1817 Tarrant City Street | Sold | $665,000 | $269 | 3 / 3 | 2,476 | Sold 2026-10-01 | 0.60 mi |


