
Comparable Sales Near 1703 Comstock Drive 0, Henderson, NV 89014
1st Realty · Comparable sales report · 1st.estate · October 20, 2026
Read the Henderson area guide →
1703 Comstock Drive 0, Henderson, NV 89014
Status: Sold
$1,750 Sold Price
$1
$ / Sq Ft
1,200
Living Area
4,356 sqft
Lot Size
2
Beds
3
Baths
1993
Year Built
Search Parameters
Property Type
Status
Radius
Sold Within
Beds
Baths
Living Area (Sq Ft)
Lot Size (Sq Ft)
This comp search reflects your current search parameters — adjust the filters above as needed for a more accurate estimate.
Estimated Value
—
Average $/Sqft
—
Check one or more comps below to calculate an estimate.
Nearest 10 of 35 comparable sales and listings within 1 mile of this home. Use the filters above and press Search to refine.
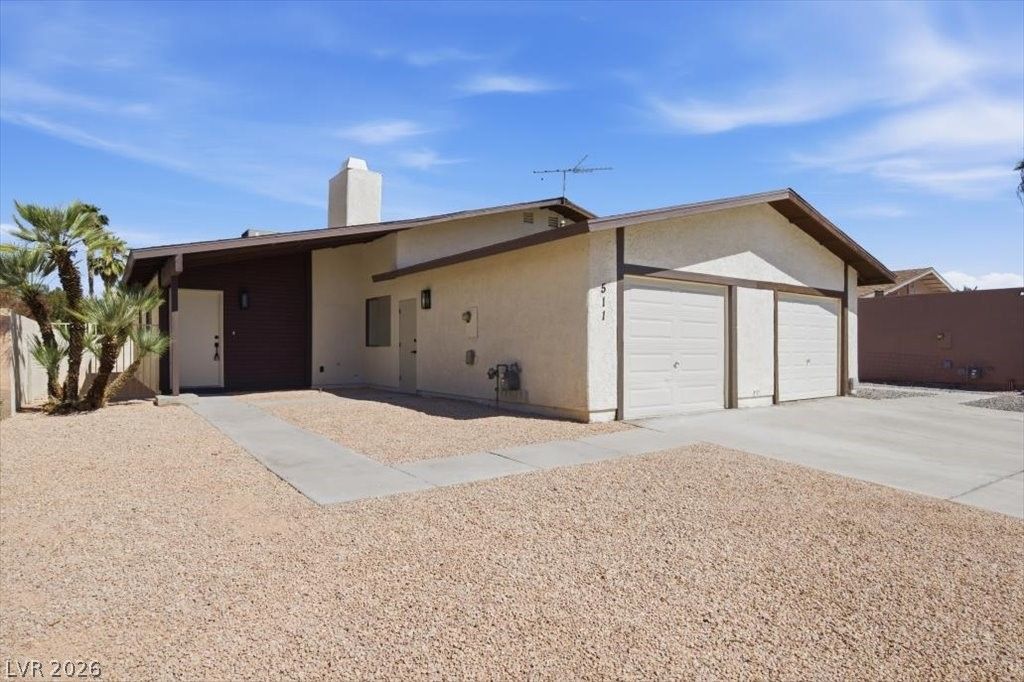
$319,0002 bd2 ba1,036 sqft$308/sqft0.29 mi99 daysSold 2026-09-14
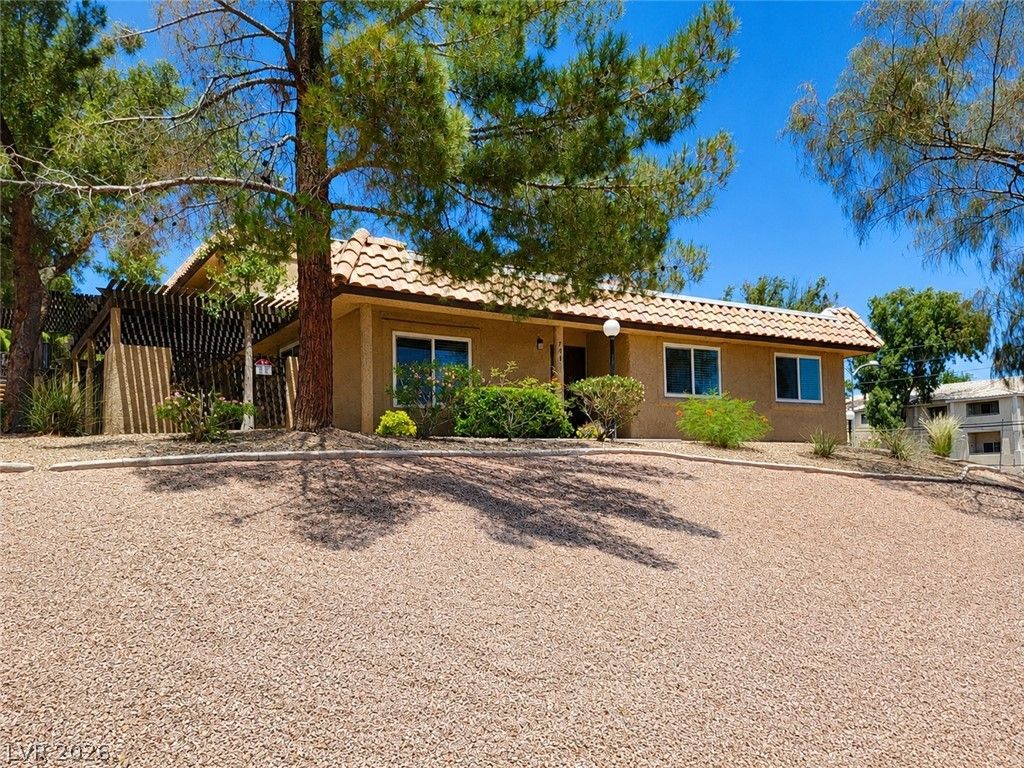
$325,0003 bd2 ba1,176 sqft$276/sqft0.34 mi36 daysSold 2026-08-14
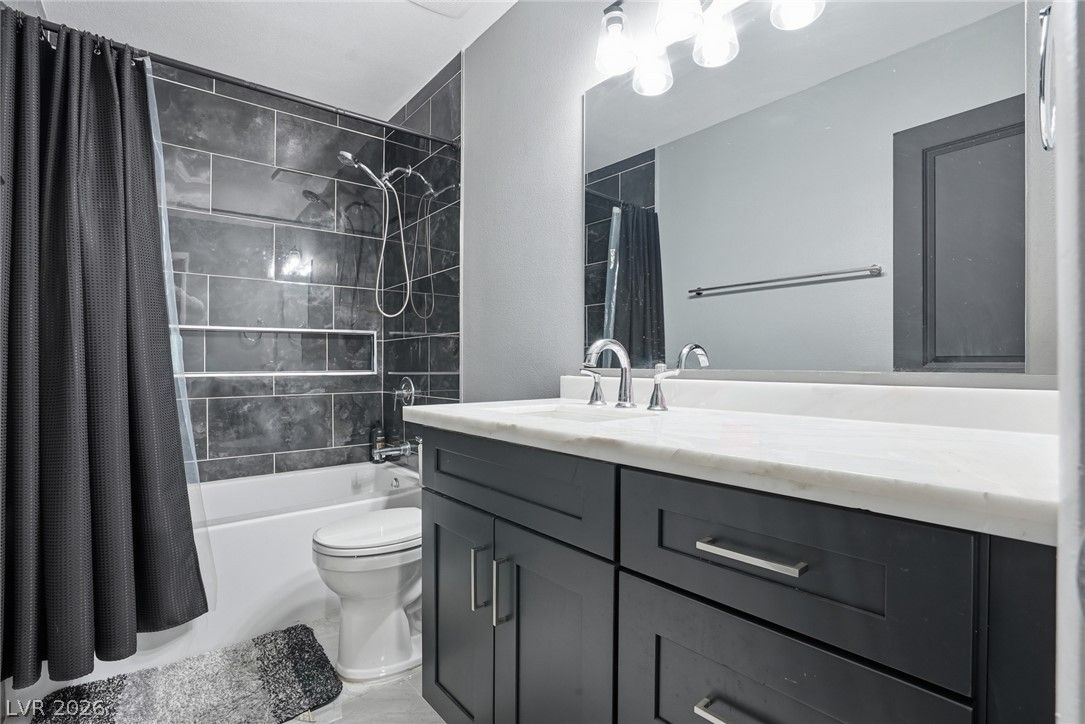
$323,0003 bd2 ba1,260 sqft$256/sqft0.34 mi5 daysSold 2026-09-28
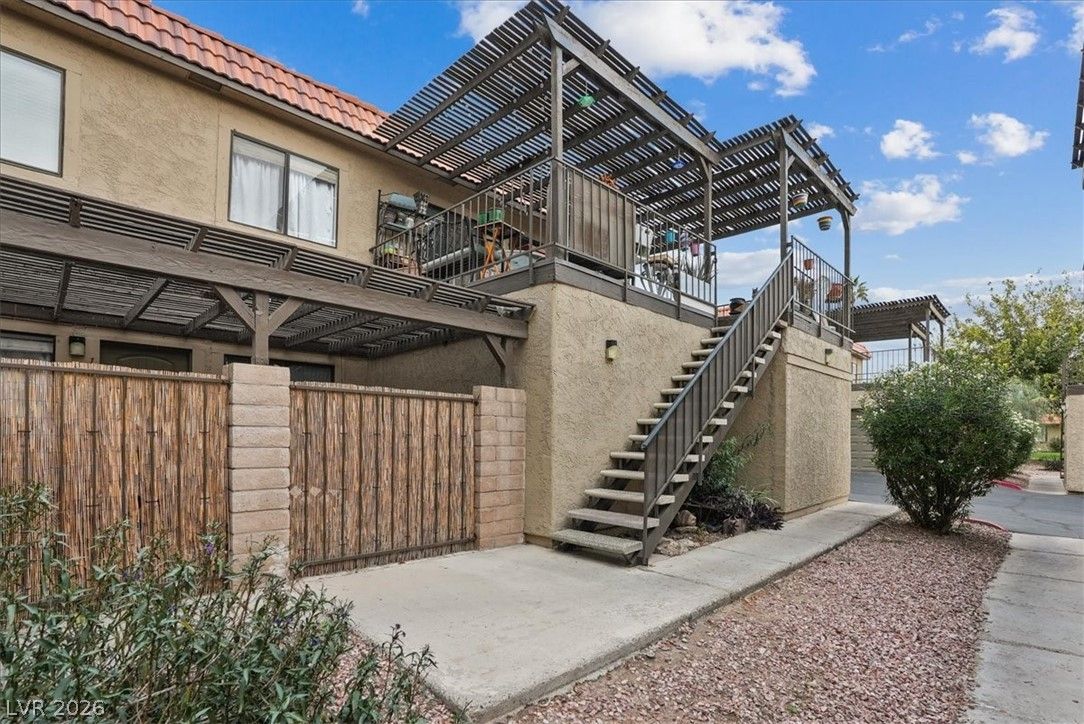
1853 Mimosa CourtActive
$187,5002 bd2 ba924 sqft$203/sqft0.40 mi72 days
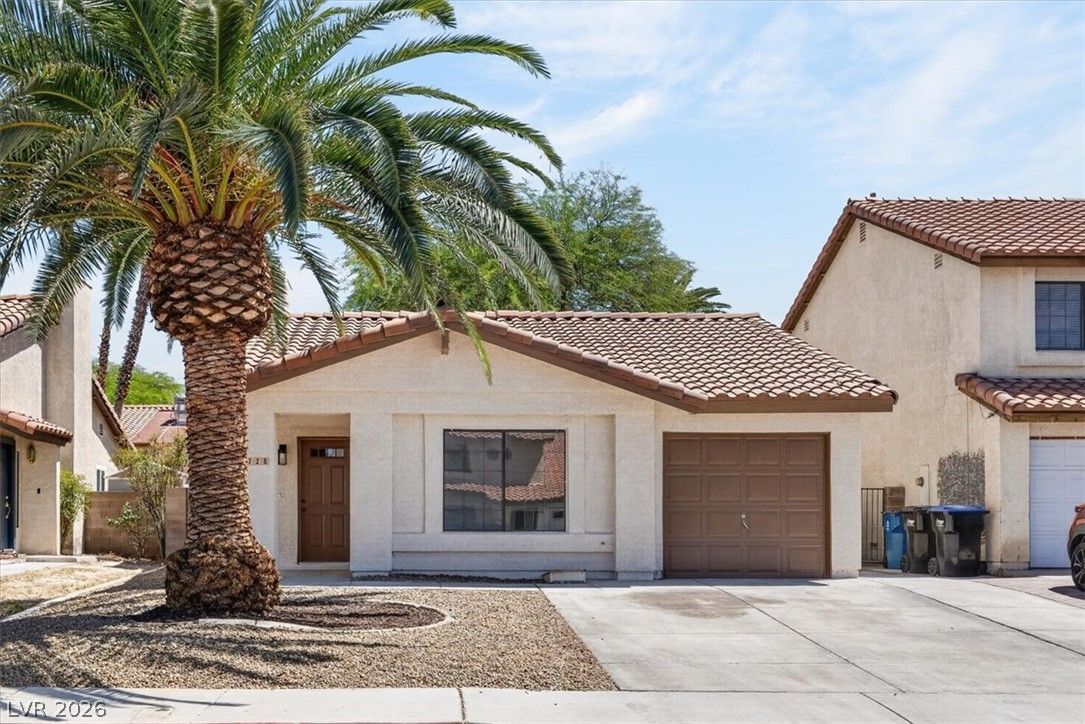
$345,0003 bd2 ba930 sqft$371/sqft0.40 mi17 daysSold 2026-08-07
$360,0003 bd2 ba1,064 sqft$338/sqft0.42 mi76 daysSold 2026-07-06
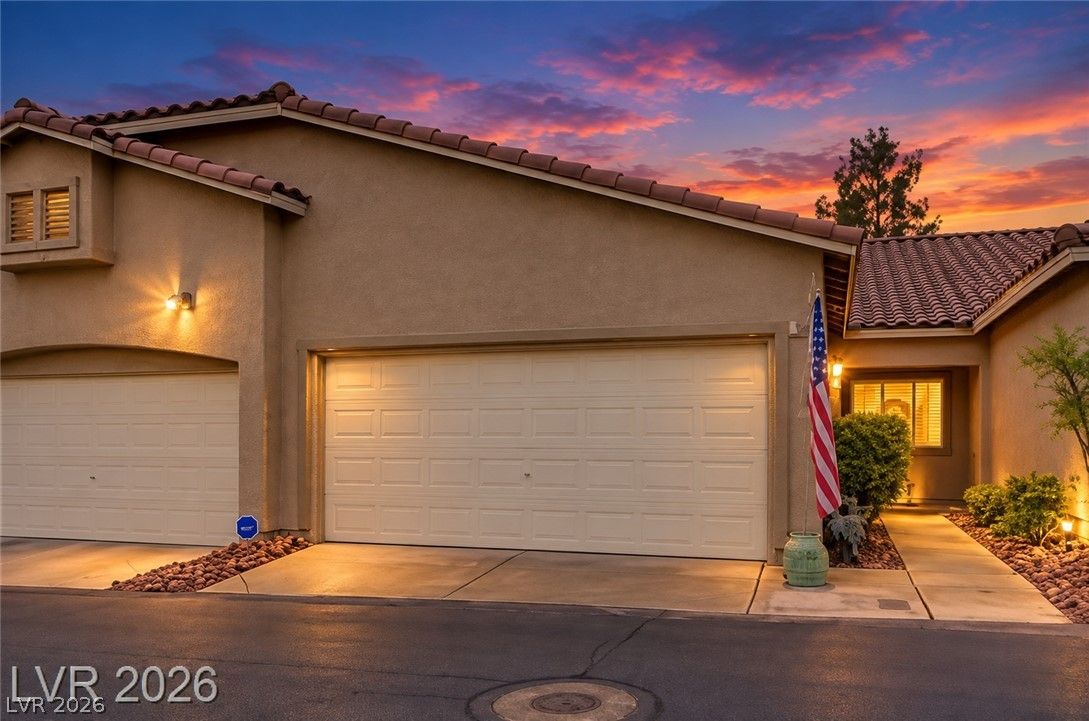
393 Blanca Springs DriveActive
$315,0002 bd2 ba1,060 sqft$297/sqft0.43 mi23 days
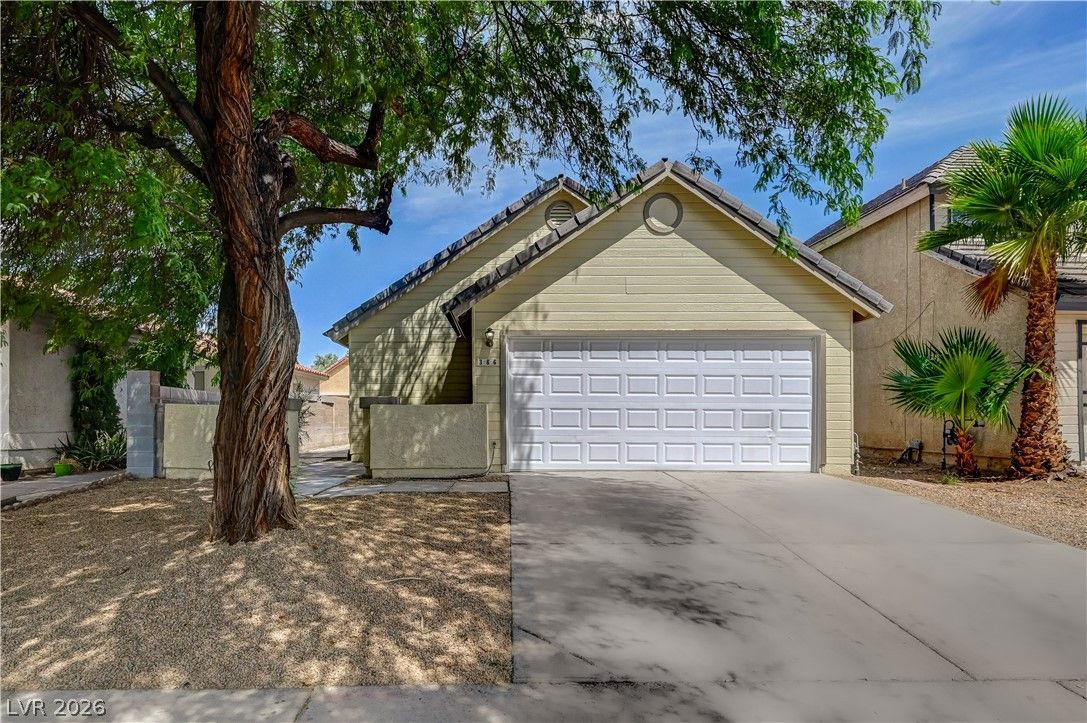
386 El Pico DriveActive
$394,9003 bd2 ba1,350 sqft$293/sqft0.45 mi27 days
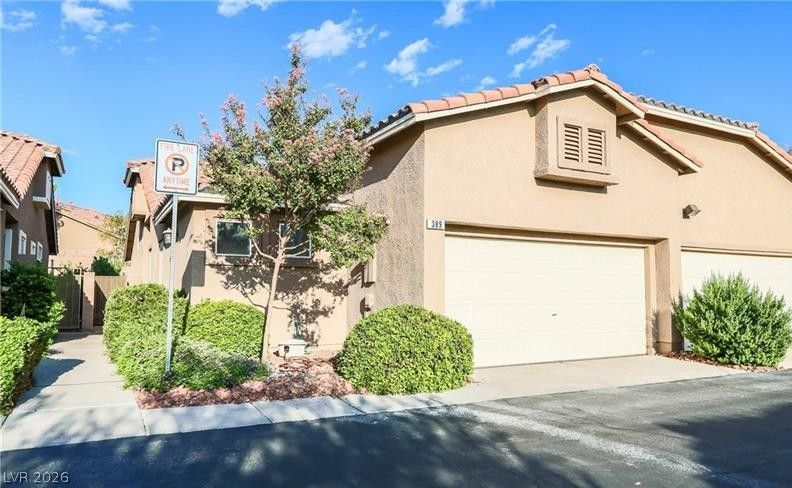
389 Rosado SpringsActive
$400,0003 bd2 ba1,220 sqft$328/sqft0.45 mi2 days
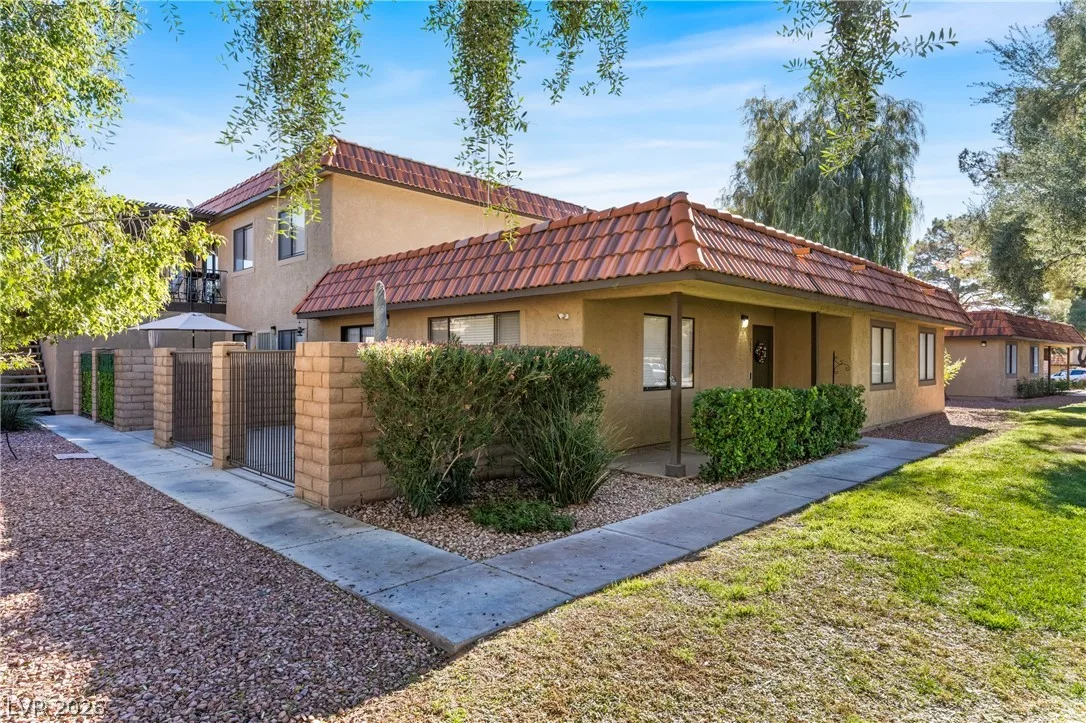
735 Apple Tree CourtActive
$310,0003 bd2 ba1,176 sqft$264/sqft0.45 mi5 days
Nearest comparable sales and listings
12 comparables · median price $324,000 · range $187,500 – $400,000 · median $/sq ft $295 · average $/sq ft $291
| Address | Status | Price | $/Sq Ft | Bd / Ba | Sq Ft | Sold / market time | Distance |
|---|---|---|---|---|---|---|---|
| 511 Chelsea Drive | Sold | $319,000 | $308 | 2 / 2 | 1,036 | Sold 2026-09-14 | 0.29 mi |
| 748 Nectarine Court | Sold | $325,000 | $276 | 3 / 2 | 1,176 | Sold 2026-08-14 | 0.34 mi |
| 531 Chelsea Drive | Sold | $323,000 | $256 | 3 / 2 | 1,260 | Sold 2026-09-28 | 0.34 mi |
| 1853 Mimosa Court | Active | $187,500 | $203 | 2 / 2 | 924 | 72 days on market | 0.40 mi |
| 1728 Duarte Drive | Sold | $345,000 | $371 | 3 / 2 | 930 | Sold 2026-08-07 | 0.40 mi |
| 546 Grimsby Avenue | Sold | $360,000 | $338 | 3 / 2 | 1,064 | Sold 2026-07-06 | 0.42 mi |
| 393 Blanca Springs Drive | Active | $315,000 | $297 | 2 / 2 | 1,060 | 23 days on market | 0.43 mi |
| 386 El Pico Drive | Active | $394,900 | $293 | 3 / 2 | 1,350 | 27 days on market | 0.45 mi |
| 389 Rosado Springs | Active | $400,000 | $328 | 3 / 2 | 1,220 | 2 days on market | 0.45 mi |
| 735 Apple Tree Court | Active | $310,000 | $264 | 3 / 2 | 1,176 | 5 days on market | 0.45 mi |
| 379 Blanca Springs Drive | Under Contract | $330,000 | $311 | 2 / 2 | 1,060 | 58 days on market | 0.46 mi |
| 377 Rosado Springs Street | Under Contract | $305,000 | $250 | 2 / 2 | 1,220 | 52 days on market | 0.48 mi |


