
Comparable Sales Near 2143 Fort Sanders Street, Henderson, NV 89052
1st Realty · Comparable sales report · 1st.estate · October 20, 2026
Read the Sun City Anthem neighborhood guide →
2143 Fort Sanders Street, Henderson, NV 89052
Status: Sold
$1,950 Sold Price
$1
$ / Sq Ft
1,632
Living Area
7,405 sqft
Lot Size
2
Beds
2
Baths
2002
Year Built
Search Parameters
Property Type
Status
Radius
Sold Within
Beds
Baths
Living Area (Sq Ft)
Lot Size (Sq Ft)
This comp search reflects your current search parameters — adjust the filters above as needed for a more accurate estimate.
Estimated Value
—
Average $/Sqft
—
Check one or more comps below to calculate an estimate.
Nearest 10 of 80 comparable sales and listings within 1 mile of this home. Use the filters above and press Search to refine.
$435,0003 bd3 ba1,482 sqft$294/sqft0.09 mi198 daysSold 2026-05-20
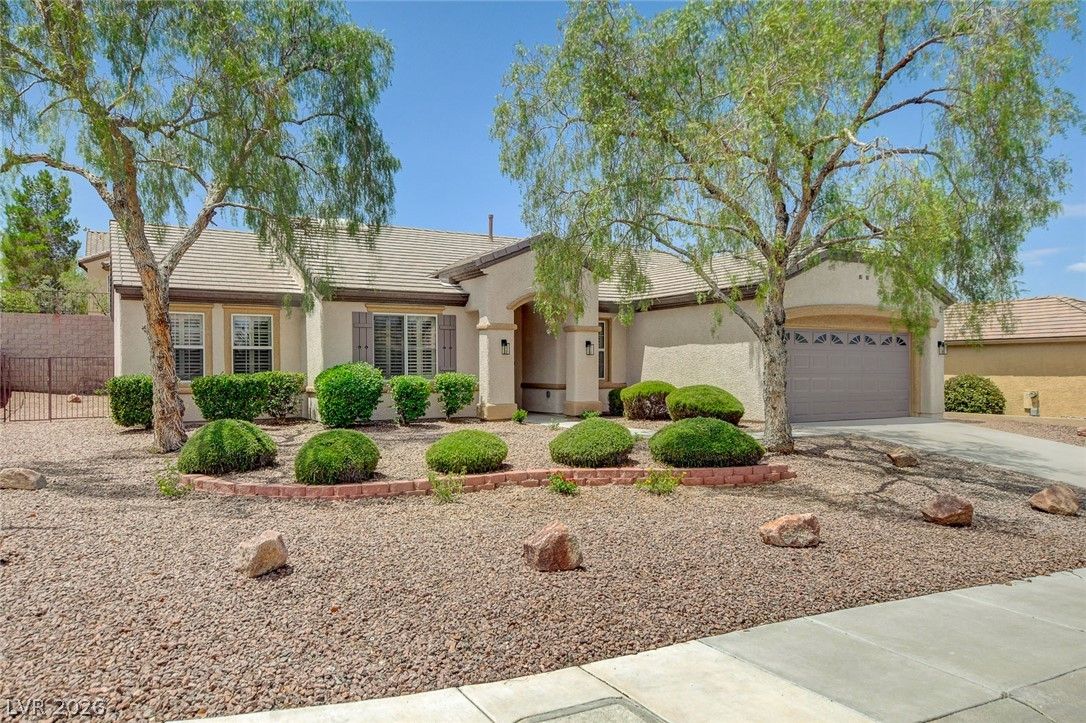
$668,9903 bd2 ba1,901 sqft$352/sqft0.17 mi25 days
$635,0002 bd2 ba1,524 sqft$417/sqft0.35 mi8 daysSold 2026-06-01
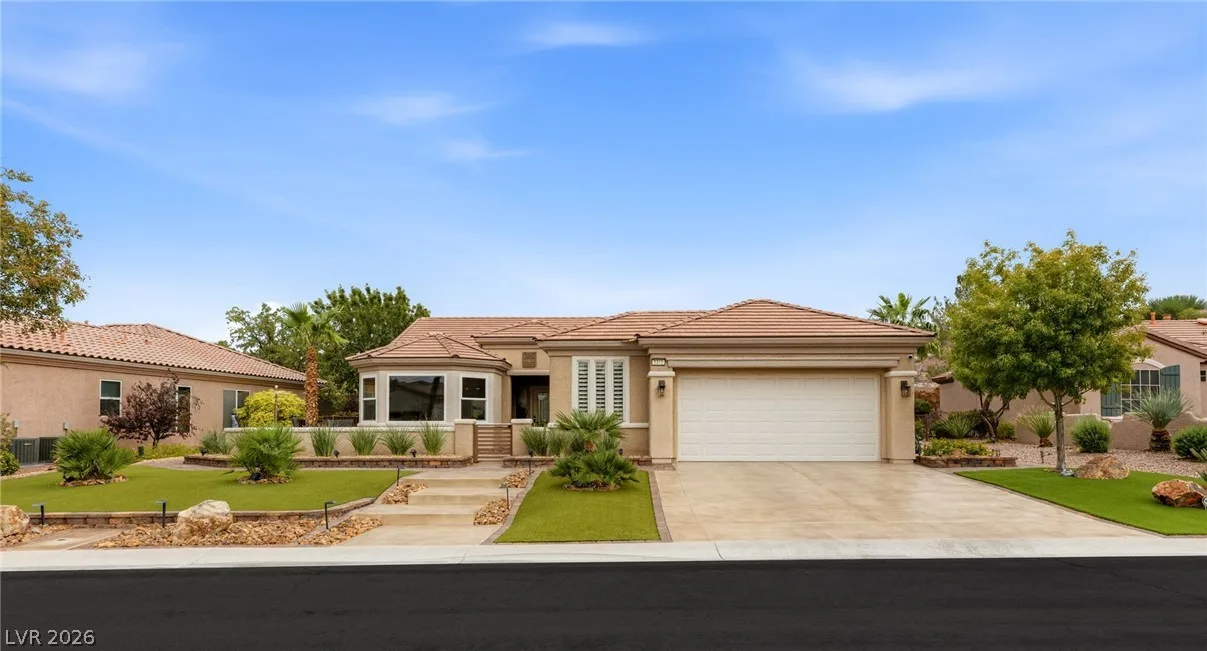
2312 Hardin Ridge DriveActive
$825,0002 bd3 ba2,032 sqft$406/sqft0.39 mi0 days
$637,0002 bd2 ba1,683 sqft$378/sqft0.41 mi16 daysSold 2026-05-06
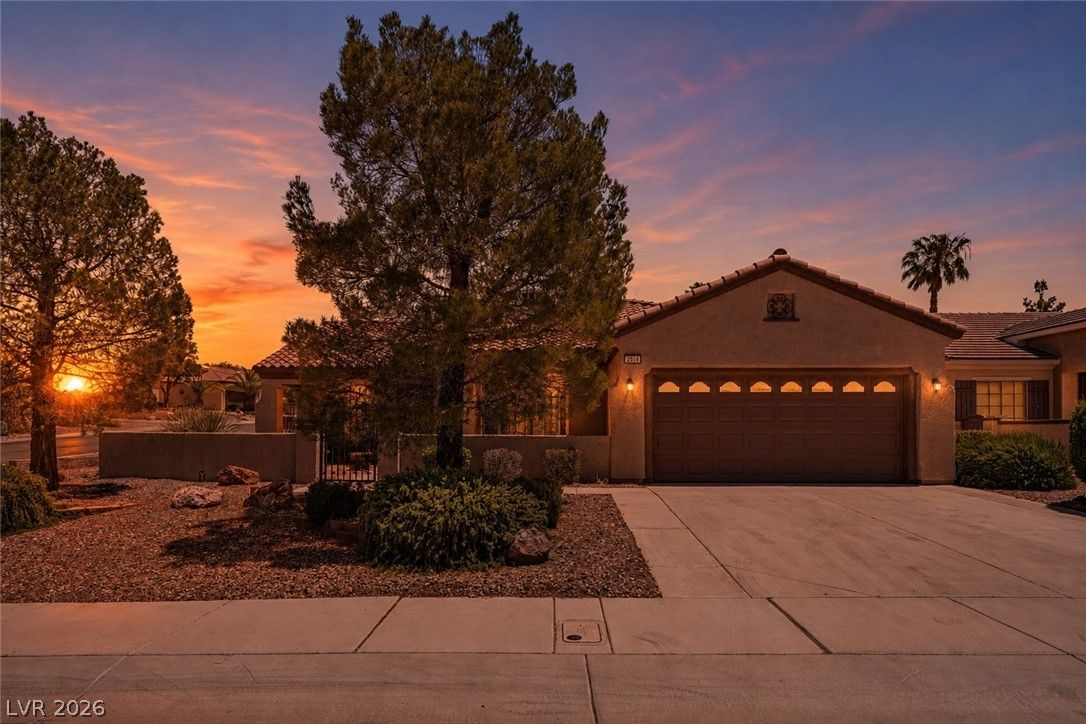
$445,0002 bd2 ba1,836 sqft$242/sqft0.42 mi58 daysSold 2026-08-04
$447,0002 bd2 ba1,585 sqft$282/sqft0.45 mi69 daysSold 2026-07-21

$460,0003 bd2 ba1,610 sqft$286/sqft0.46 mi28 daysSold 2026-10-19
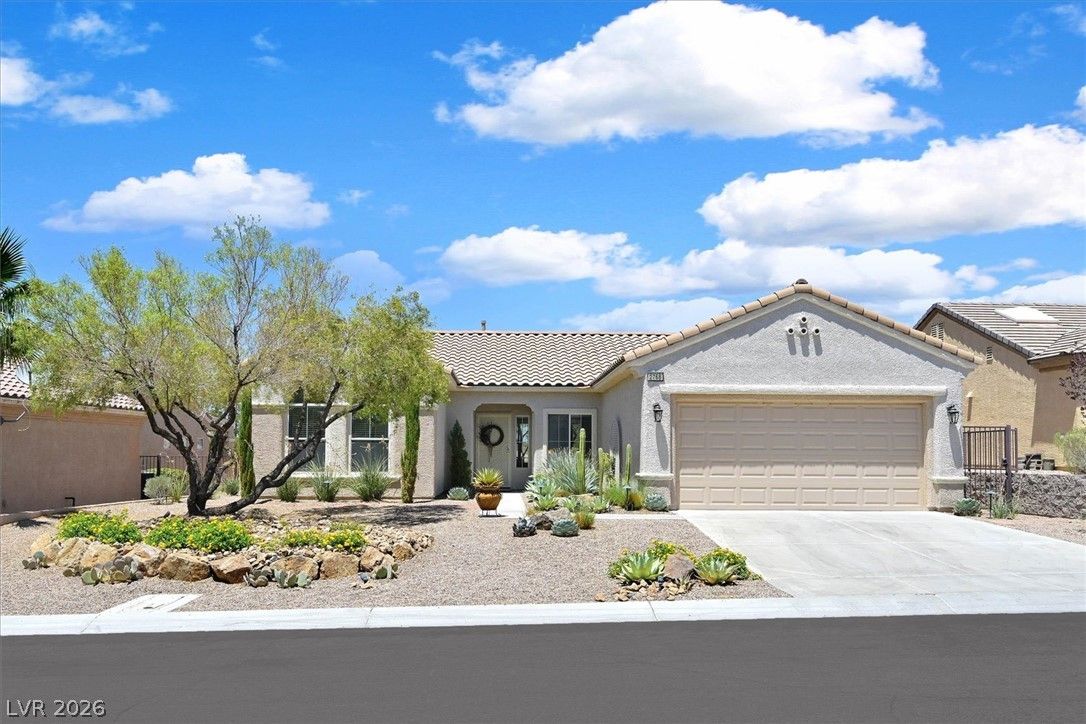
$490,0002 bd2 ba1,632 sqft$300/sqft0.46 mi31 daysSold 2026-08-18
$525,0003 bd3 ba2,016 sqft$260/sqft0.46 mi37 daysSold 2026-07-15
Nearest comparable sales and listings
12 comparables · median price $507,450 · range $435,000 – $825,000 · median $/sq ft $290 · average $/sq ft $313
| Address | Status | Price | $/Sq Ft | Bd / Ba | Sq Ft | Sold / market time | Distance |
|---|---|---|---|---|---|---|---|
| 2138 Grand Traverse Street | Sold | $435,000 | $294 | 3 / 3 | 1,482 | Sold 2026-05-20 | 0.09 mi |
| 2741 Hartwick Pines Drive Avenue | Active | $668,990 | $352 | 3 / 2 | 1,901 | 25 days on market | 0.17 mi |
| 2831 Goldcreek Street | Sold | $635,000 | $417 | 2 / 2 | 1,524 | Sold 2026-06-01 | 0.35 mi |
| 2312 Hardin Ridge Drive | Active | $825,000 | $406 | 2 / 3 | 2,032 | 0 days on market | 0.39 mi |
| 2893 Foxtail Creek Avenue | Sold | $637,000 | $378 | 2 / 2 | 1,683 | Sold 2026-05-06 | 0.41 mi |
| 2314 Sand Lily Street | Sold | $445,000 | $242 | 2 / 2 | 1,836 | Sold 2026-08-04 | 0.42 mi |
| 2880 Goldcreek Street | Sold | $447,000 | $282 | 2 / 2 | 1,585 | Sold 2026-07-21 | 0.45 mi |
| 2734 White Sage Drive | Sold | $460,000 | $286 | 3 / 2 | 1,610 | Sold 2026-10-19 | 0.46 mi |
| 2768 White Sage Drive | Sold | $490,000 | $300 | 2 / 2 | 1,632 | Sold 2026-08-18 | 0.46 mi |
| 2772 White Sage Drive | Sold | $525,000 | $260 | 3 / 3 | 2,016 | Sold 2026-07-15 | 0.46 mi |
| 2126 Alyssa Jade Drive | Sold | $450,000 | $280 | 3 / 2 | 1,610 | Sold 2026-06-30 | 0.47 mi |
| 2559 Deora Way | Active | $524,900 | $261 | 2 / 2 | 2,012 | 25 days on market | 0.48 mi |


