
Comparable Sales Near 168 Red Tee Lane, Las Vegas, NV 89148
1st Realty · Comparable sales report · 1st.estate · October 20, 2026
Read the Rhodes Ranch neighborhood guide →
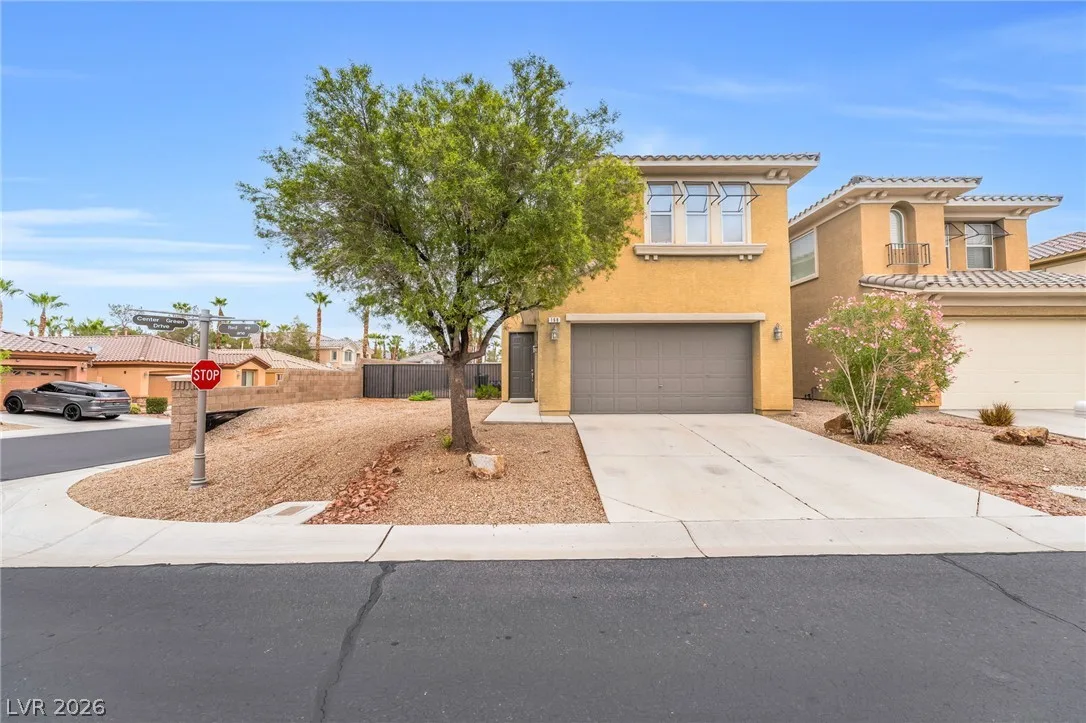
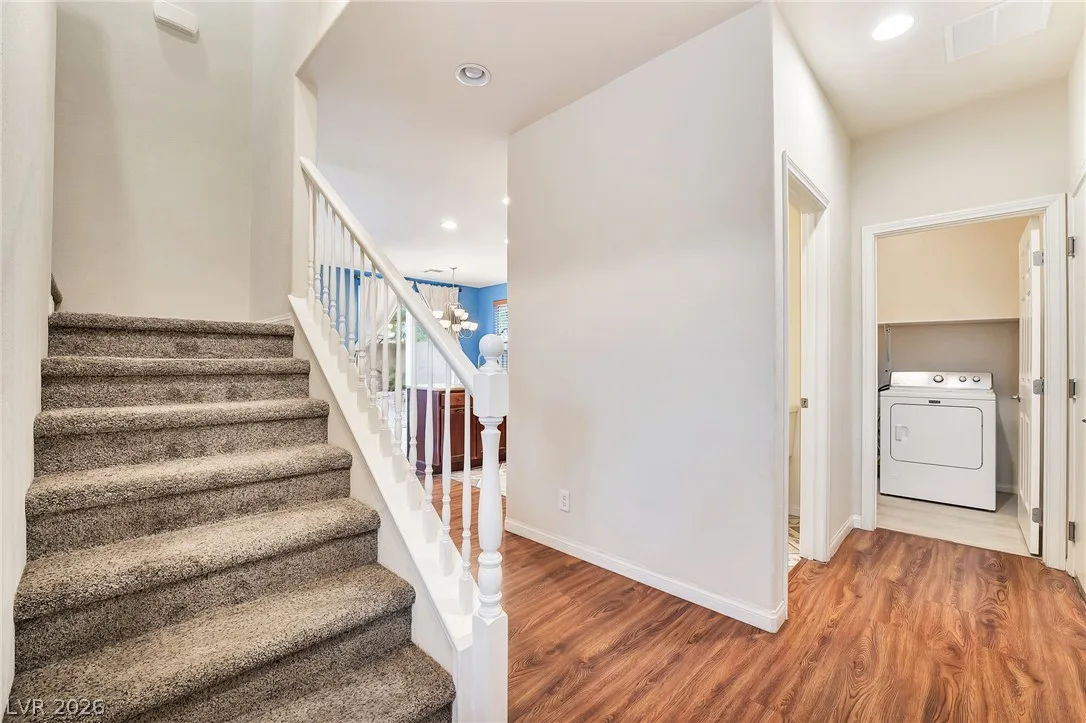
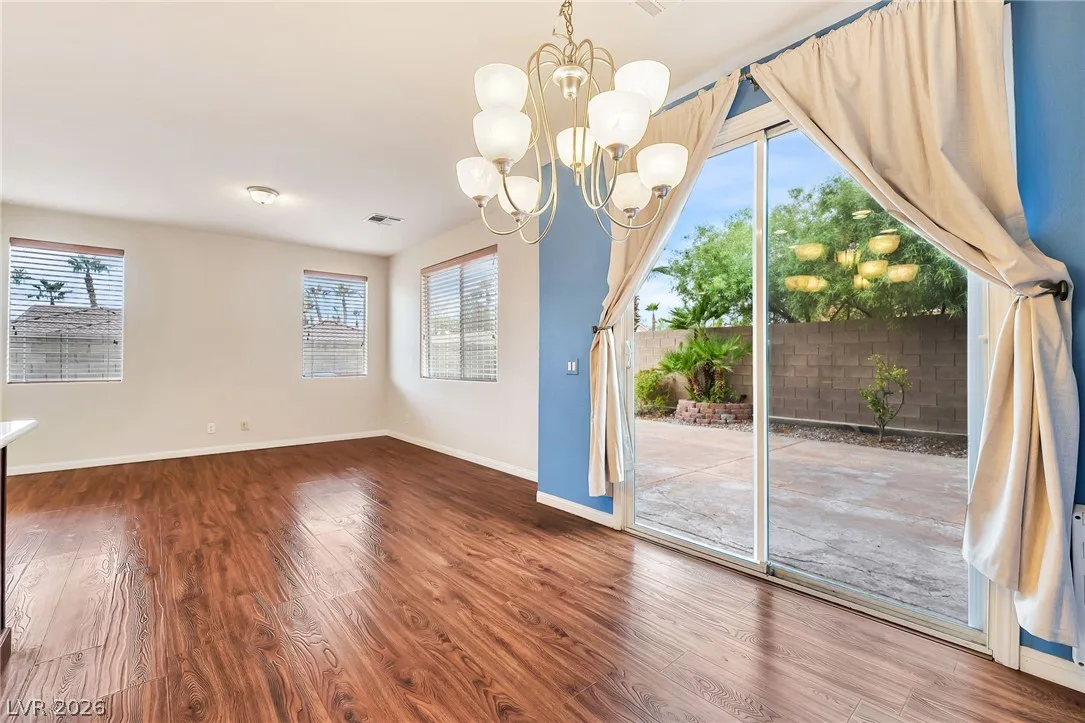
168 Red Tee Lane, Las Vegas, NV 89148
Status: For Rent
$2,250 List Price
$1
$ / Sq Ft
1,714
Living Area
4,792 sqft
Lot Size
3
Beds
3
Baths
2009
Year Built
Search Parameters
Property Type
Status
Radius
Sold Within
Beds
Baths
Living Area (Sq Ft)
Lot Size (Sq Ft)
This comp search reflects your current search parameters — adjust the filters above as needed for a more accurate estimate.
Estimated Value
—
Average $/Sqft
—
Check one or more comps below to calculate an estimate.
Nearest 10 of 46 comparable sales and listings within 1 mile of this home. Use the filters above and press Search to refine.
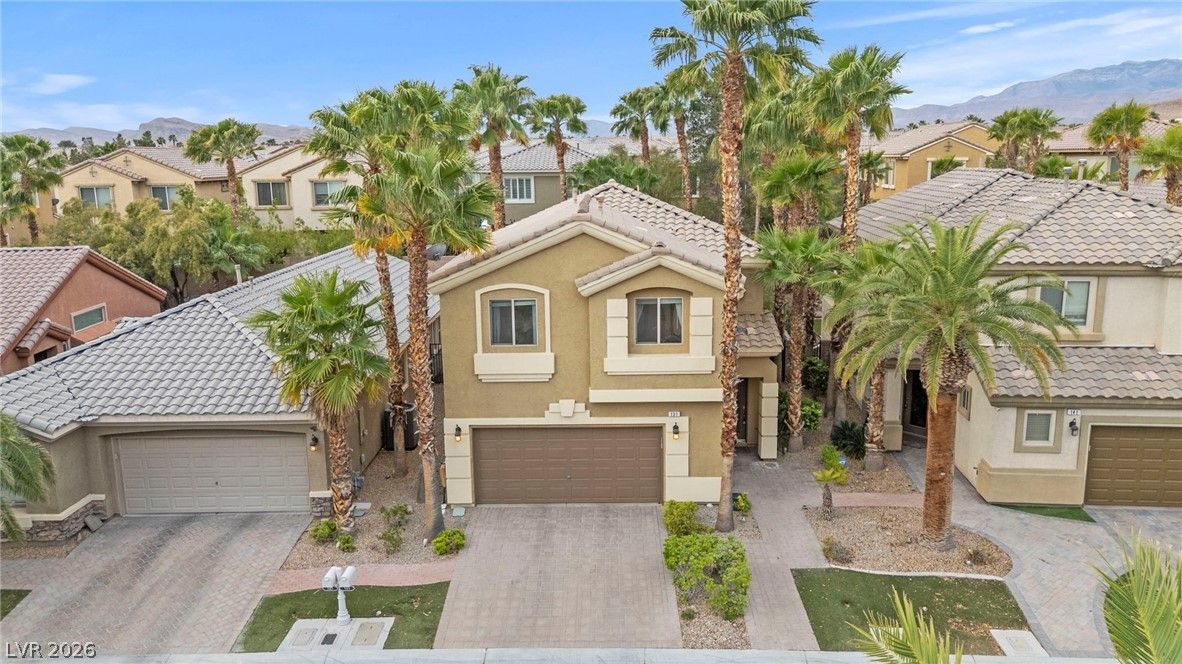
$485,0003 bd3 ba1,820 sqft$266/sqft0.04 mi105 daysSold 2026-09-24
$450,0003 bd3 ba1,819 sqft$247/sqft0.09 mi40 daysSold 2026-07-14
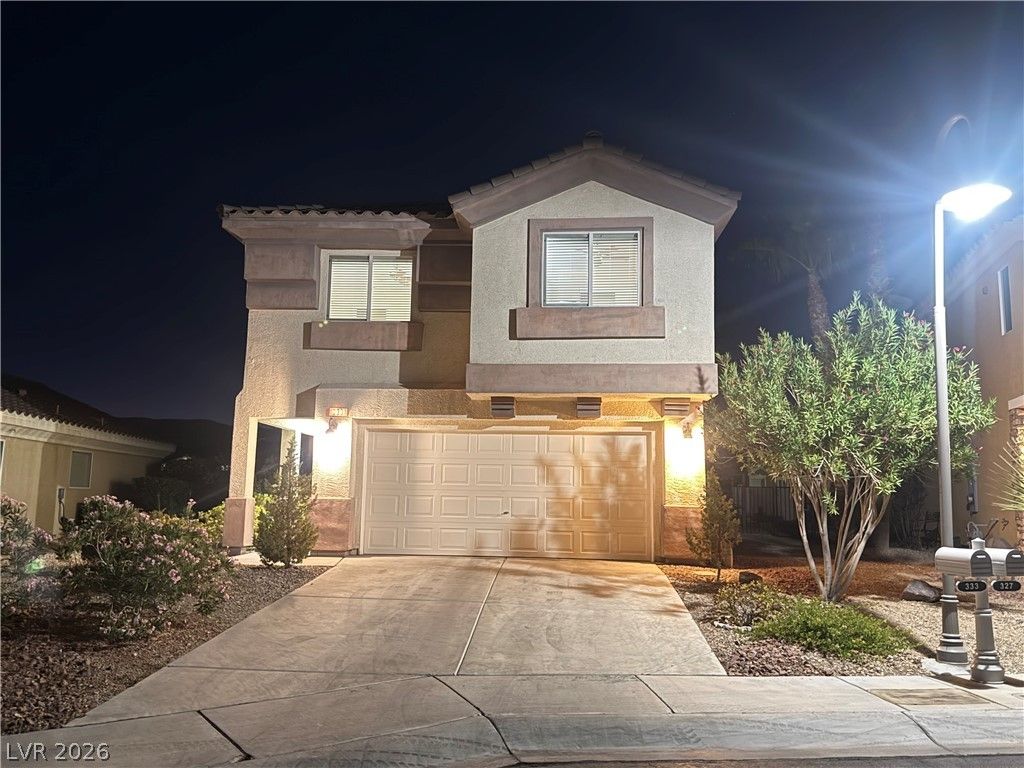
$435,0003 bd3 ba1,715 sqft$254/sqft0.11 mi10 daysSold 2026-10-13
122 Broken Putter WayActive
$565,0003 bd3 ba1,819 sqft$311/sqft0.13 mi134 days
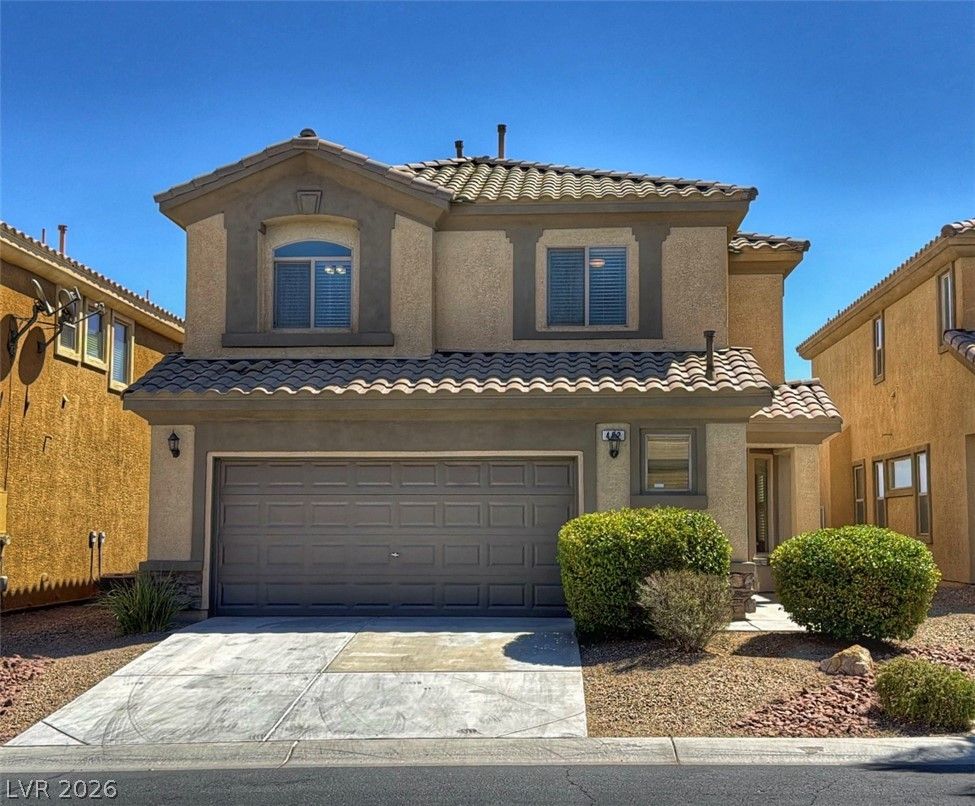
$480,0004 bd3 ba2,119 sqft$227/sqft0.16 mi10 daysSold 2026-09-23
$470,0004 bd3 ba2,119 sqft$222/sqft0.16 mi36 daysSold 2026-04-23
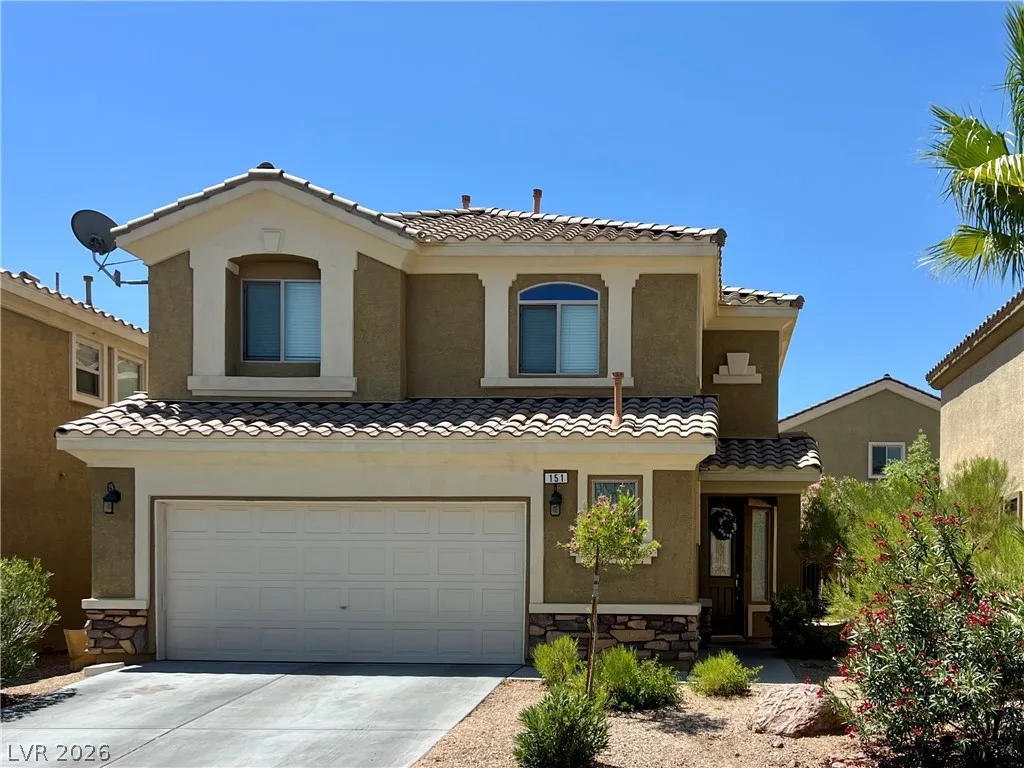
151 Short Ruff WayActive
$495,0004 bd3 ba2,119 sqft$234/sqft0.20 mi14 days
$447,5003 bd3 ba1,820 sqft$246/sqft0.21 mi41 daysSold 2026-05-06
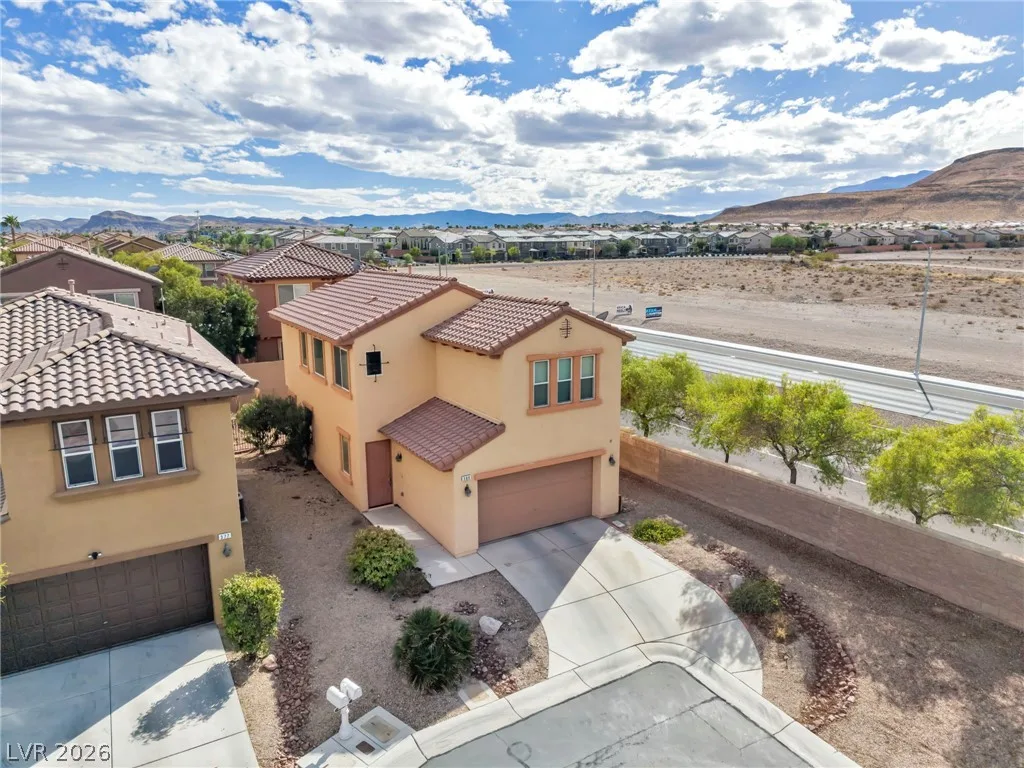
389 Fringe Ruff DriveActive
$450,0003 bd3 ba1,714 sqft$263/sqft0.29 mi10 days
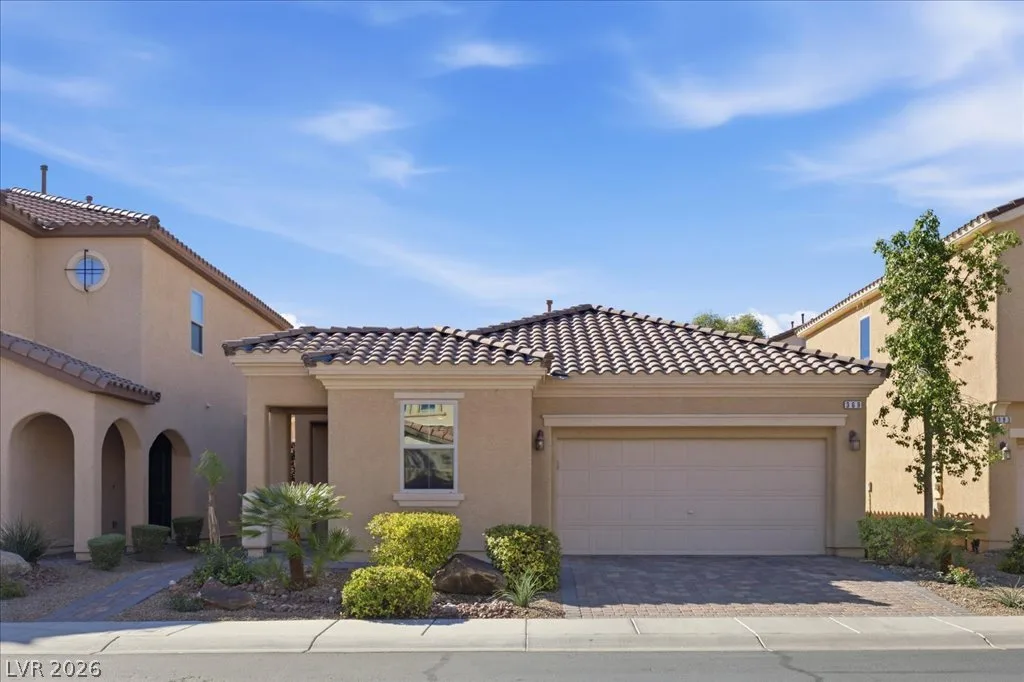
369 Hillhead CourtActive
$550,0003 bd2 ba1,848 sqft$298/sqft0.30 mi6 days
Nearest comparable sales and listings
12 comparables · median price $475,000 · range $435,000 – $579,000 · median $/sq ft $258 · average $/sq ft $264
| Address | Status | Price | $/Sq Ft | Bd / Ba | Sq Ft | Sold / market time | Distance |
|---|---|---|---|---|---|---|---|
| 131 Sandy Bunker Lane | Sold | $485,000 | $266 | 3 / 3 | 1,820 | Sold 2026-09-24 | 0.04 mi |
| 124 Water Hazard Lane | Sold | $450,000 | $247 | 3 / 3 | 1,819 | Sold 2026-07-14 | 0.09 mi |
| 333 CART CROSSING Way | Sold | $435,000 | $254 | 3 / 3 | 1,715 | Sold 2026-10-13 | 0.11 mi |
| 122 Broken Putter Way | Active | $565,000 | $311 | 3 / 3 | 1,819 | 134 days on market | 0.13 mi |
| 482 Center Green Drive | Sold | $480,000 | $227 | 4 / 3 | 2,119 | Sold 2026-09-23 | 0.16 mi |
| 135 Broken Putter Way | Sold | $470,000 | $222 | 4 / 3 | 2,119 | Sold 2026-04-23 | 0.16 mi |
| 151 Short Ruff Way | Active | $495,000 | $234 | 4 / 3 | 2,119 | 14 days on market | 0.20 mi |
| 181 Short Ruff Way | Sold | $447,500 | $246 | 3 / 3 | 1,820 | Sold 2026-05-06 | 0.21 mi |
| 389 Fringe Ruff Drive | Active | $450,000 | $263 | 3 / 3 | 1,714 | 10 days on market | 0.29 mi |
| 369 Hillhead Court | Active | $550,000 | $298 | 3 / 2 | 1,848 | 6 days on market | 0.30 mi |
| 245 Spring Hollow Drive | Sold | $455,000 | $310 | 3 / 2 | 1,467 | Sold 2026-07-10 | 0.39 mi |
| 664 Orchard Course Drive | Sold | $579,000 | $288 | 3 / 3 | 2,007 | Sold 2026-05-12 | 0.42 mi |


