
Comparable Sales Near 3822 Flickering Star Drive, Las Vegas, NV 89103
1st Realty · Comparable sales report · 1st.estate · October 20, 2026
Read the Spring Valley neighborhood guide →
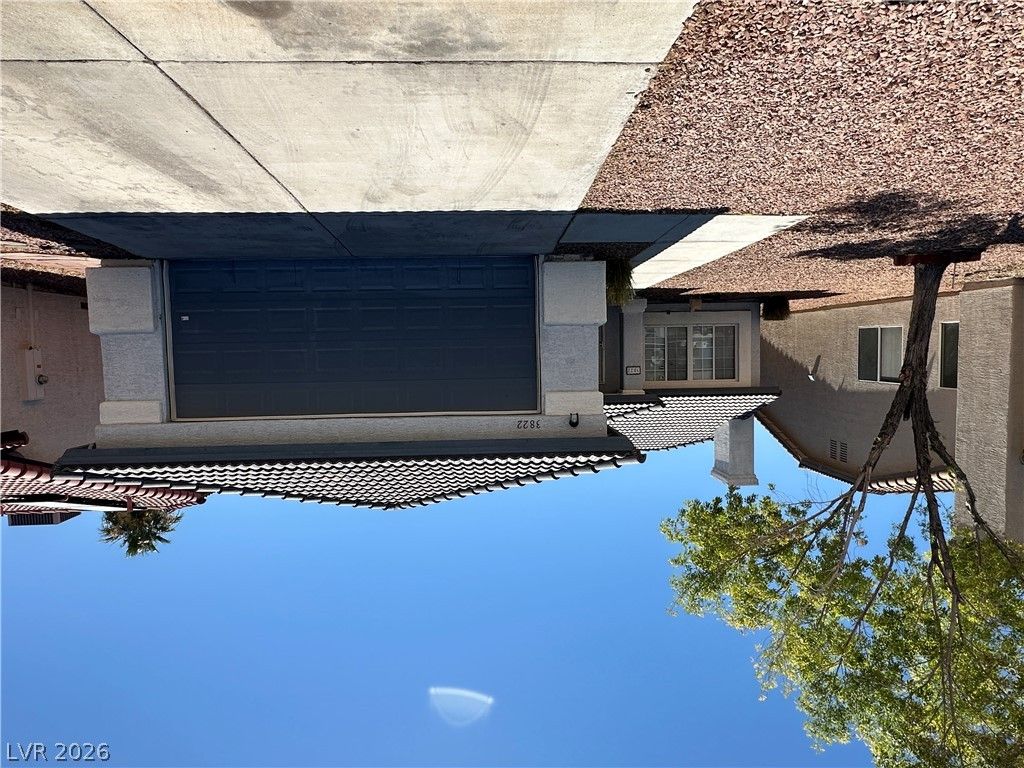
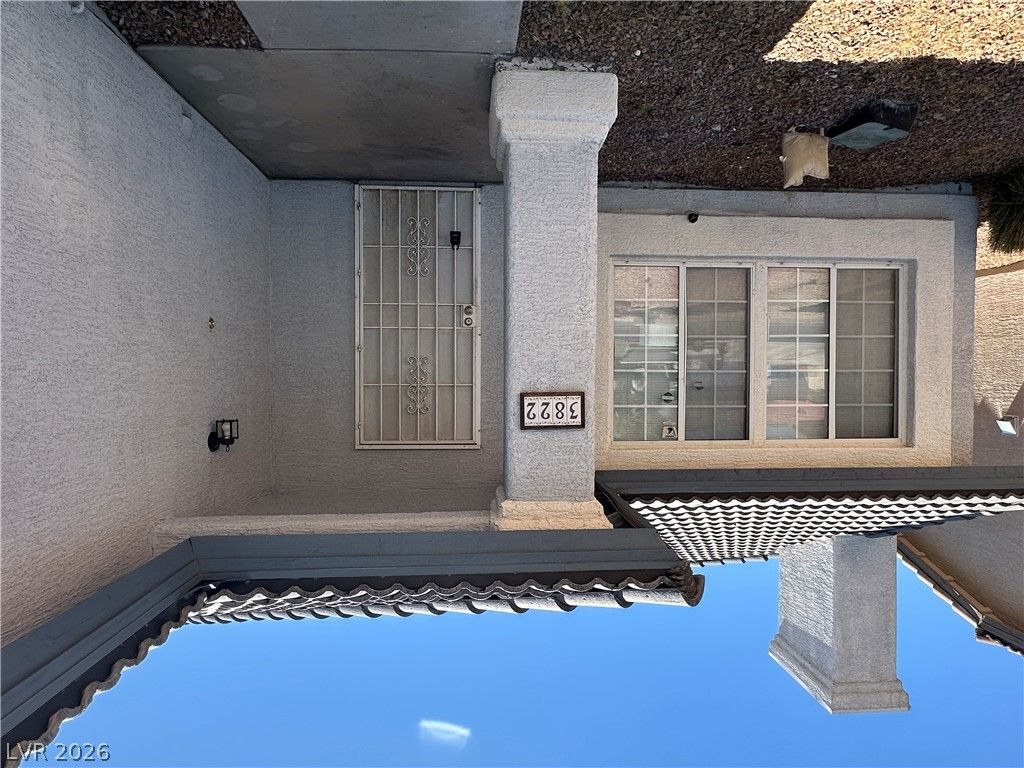
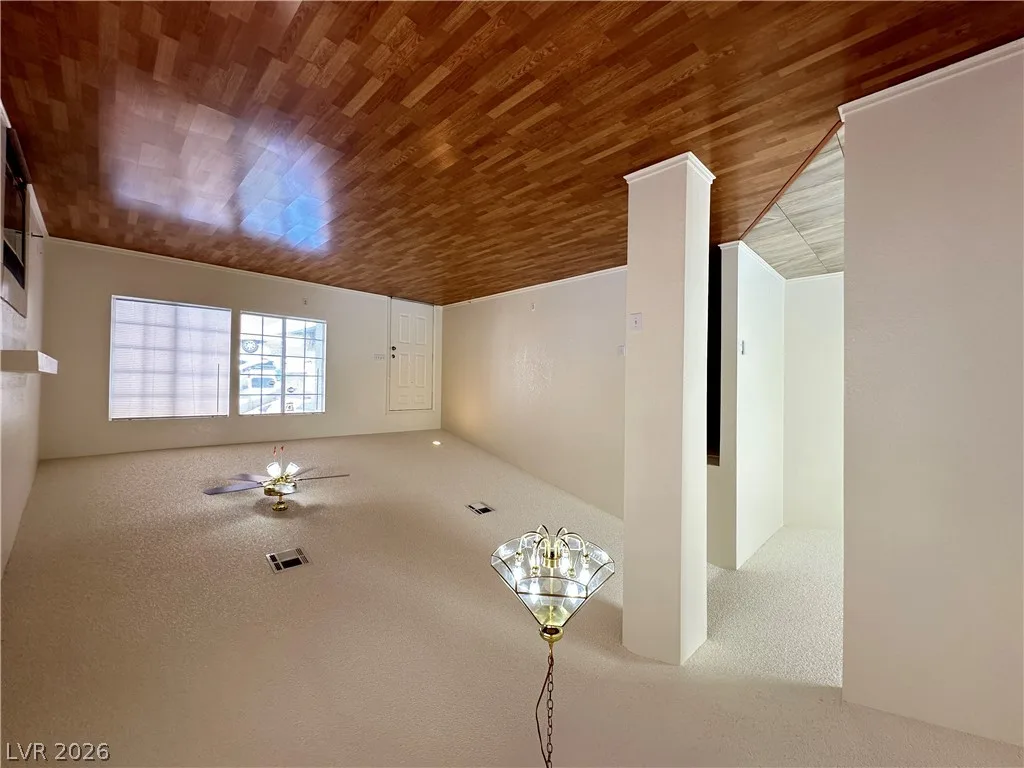
3822 Flickering Star Drive, Las Vegas, NV 89103
Status: Sold
$1,945 Sold Price
$1
$ / Sq Ft
1,644
Living Area
6,098 sqft
Lot Size
3
Beds
2
Baths
1993
Year Built
Search Parameters
Property Type
Status
Radius
Sold Within
Beds
Baths
Living Area (Sq Ft)
Lot Size (Sq Ft)
This comp search reflects your current search parameters — adjust the filters above as needed for a more accurate estimate.
Estimated Value
—
Average $/Sqft
—
Check one or more comps below to calculate an estimate.
Nearest 10 of 52 comparable sales and listings within 1 mile of this home. Use the filters above and press Search to refine.
$349,9903 bd2 ba1,526 sqft$229/sqft0.16 mi7 daysSold 2026-04-24
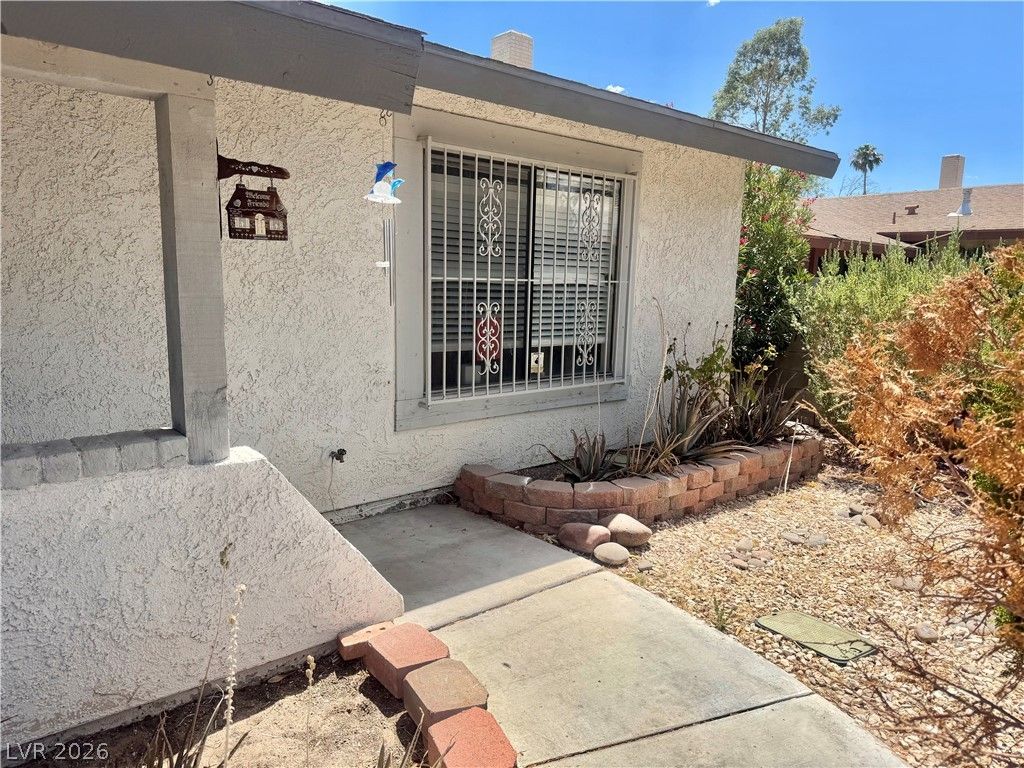
6461 West Viking RoadActive
$399,0002 bd2 ba1,526 sqft$261/sqft0.18 mi116 days
$357,0003 bd2 ba1,401 sqft$255/sqft0.20 mi4 daysSold 2026-06-16
$505,0004 bd3 ba1,993 sqft$253/sqft0.23 mi21 daysSold 2026-07-06
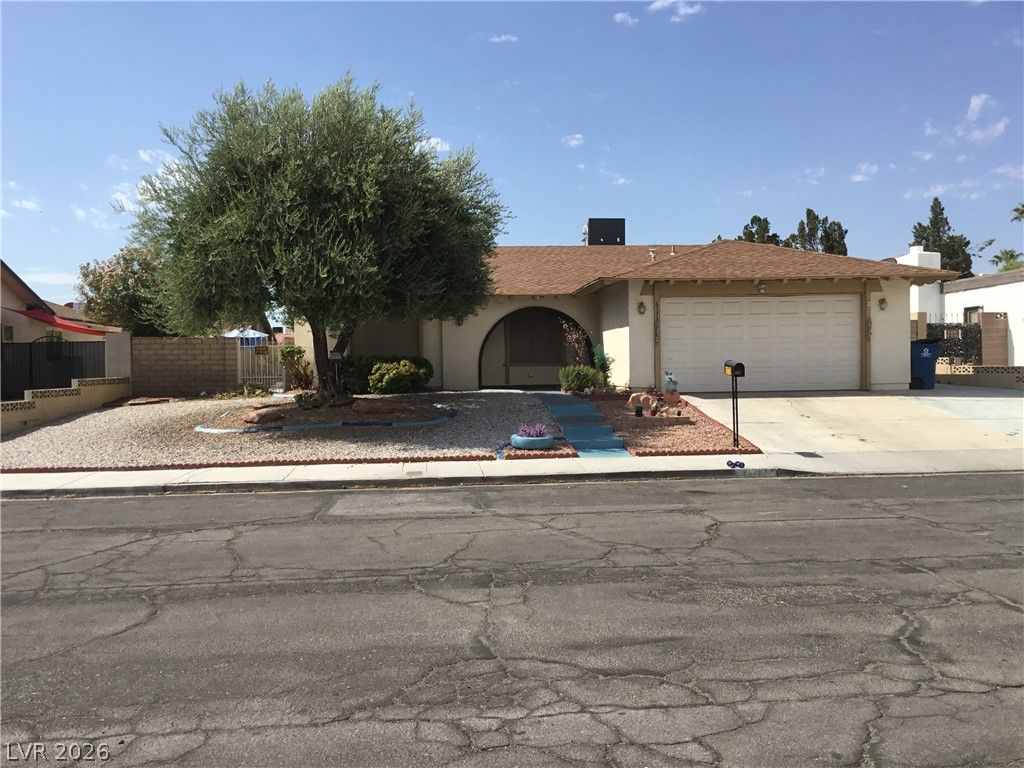
$327,0003 bd2 ba1,306 sqft$250/sqft0.24 mi6 daysSold 2026-08-27
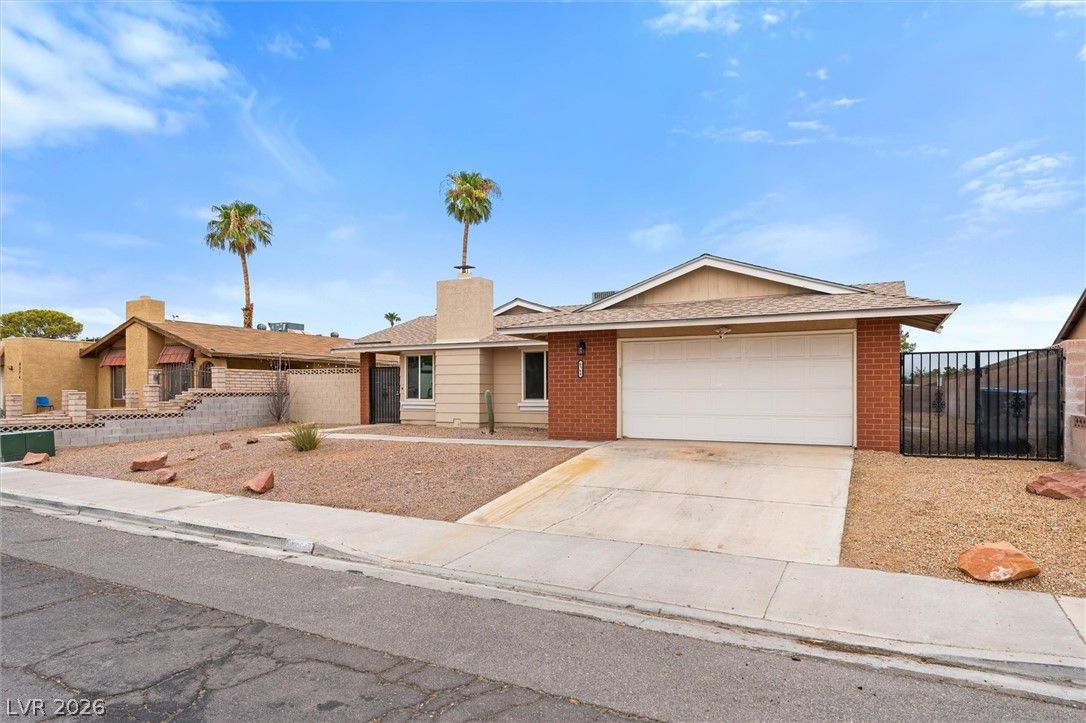
$385,0003 bd2 ba1,397 sqft$276/sqft0.25 mi3 daysSold 2026-08-31
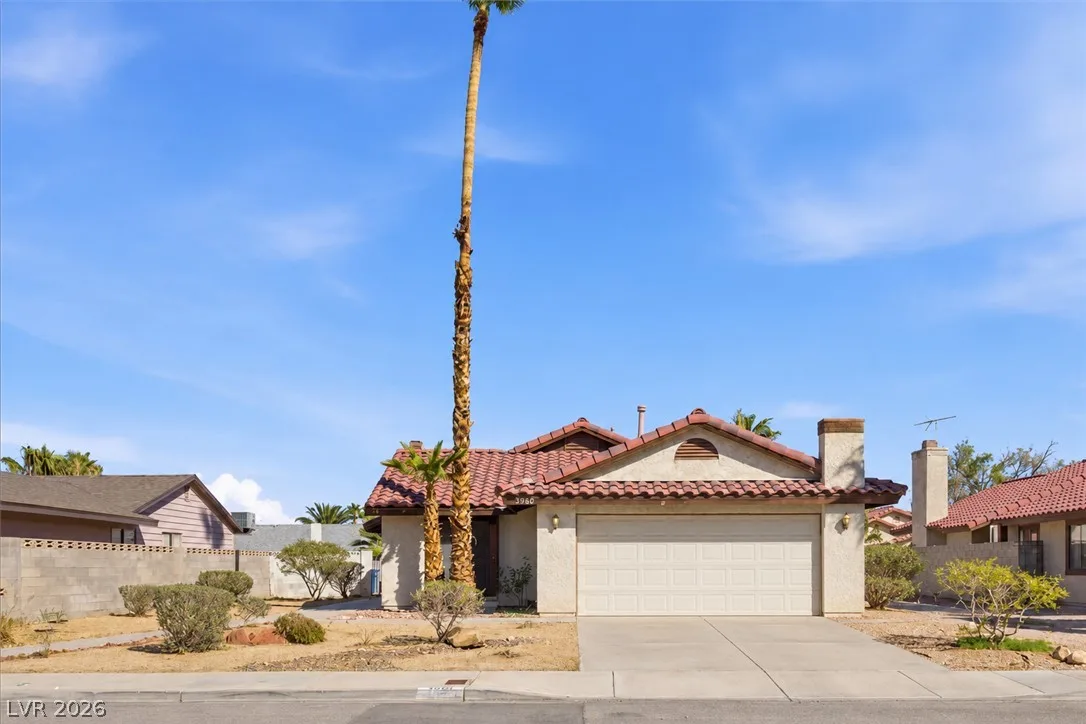
3960 Grapefruit CircleActive
$380,0003 bd2 ba1,326 sqft$287/sqft0.26 mi0 days
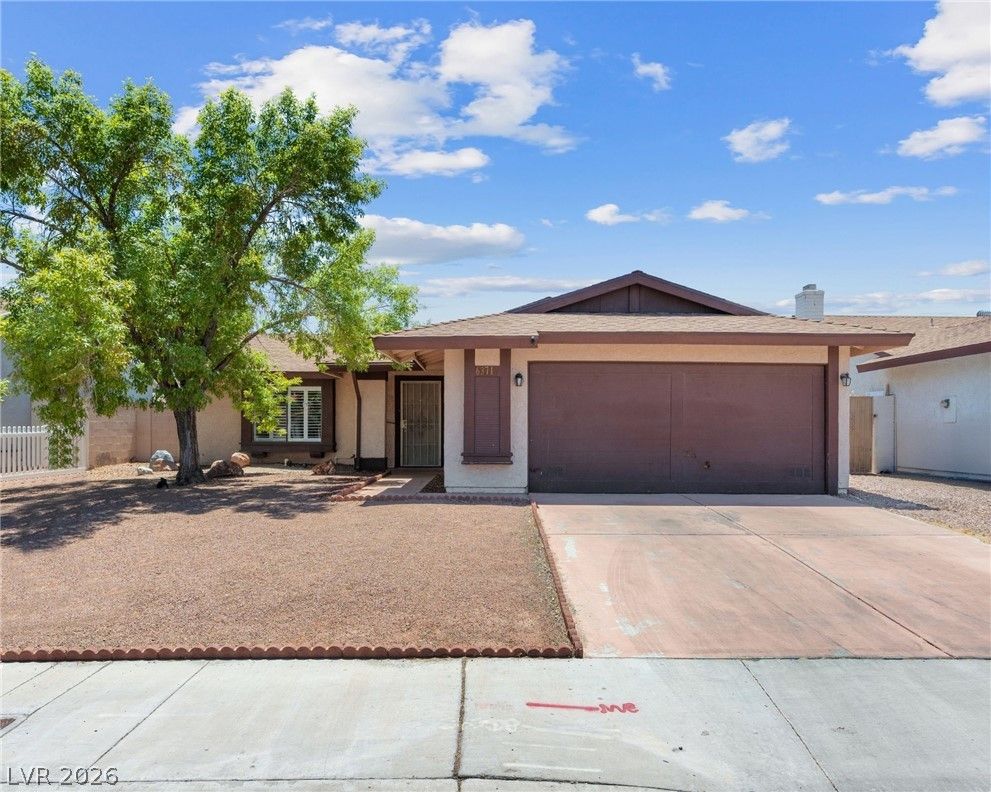
6371 West Viking RoadActive
$409,9003 bd2 ba1,406 sqft$292/sqft0.27 mi51 days
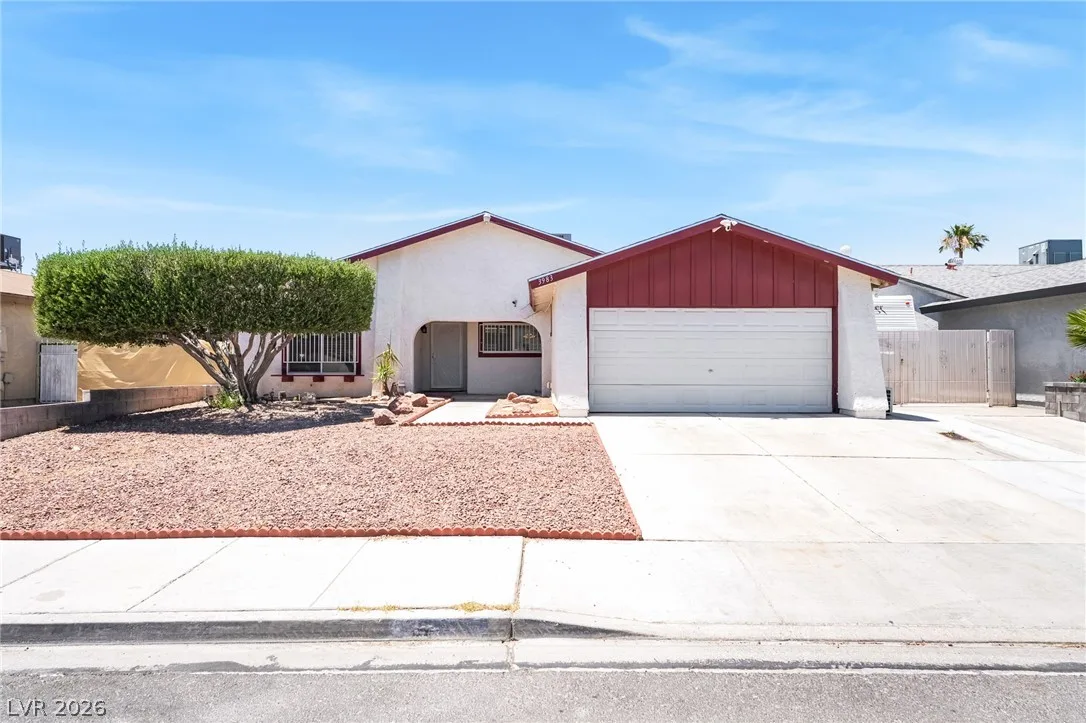
3983 Redwood StreetPending
$479,9993 bd2 ba1,574 sqft$305/sqft0.28 mi9 days
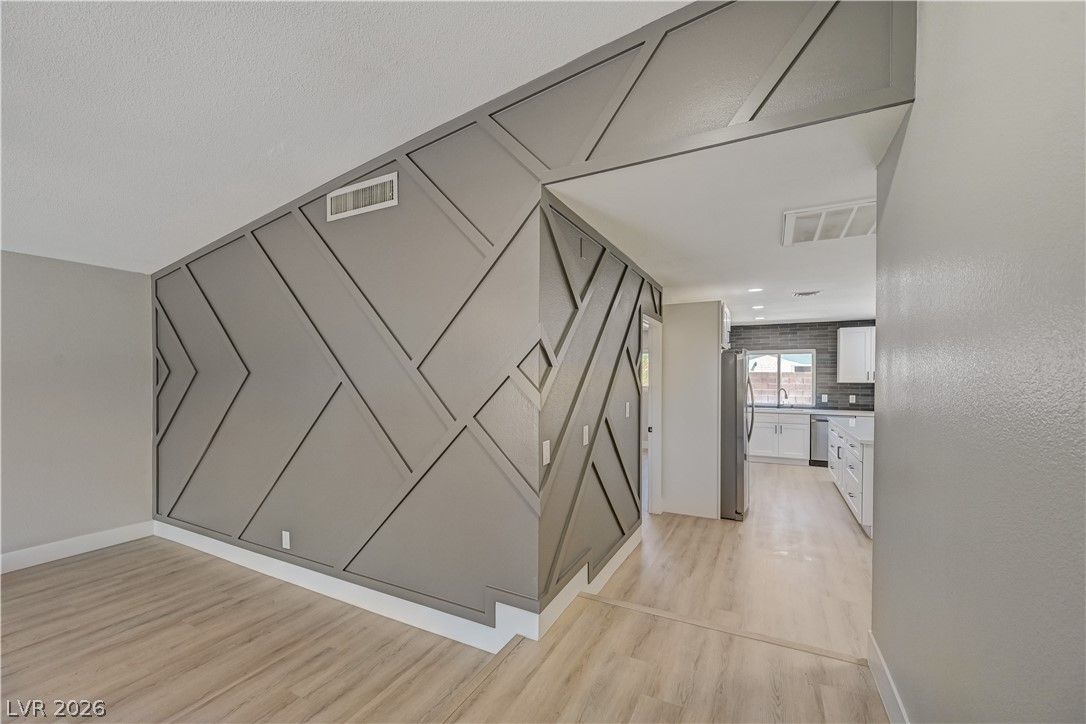
6784 Mataro DrivePending
$434,9004 bd2 ba1,562 sqft$278/sqft0.28 mi98 days
Nearest comparable sales and listings
12 comparables · median price $392,000 · range $327,000 – $505,000 · median $/sq ft $269 · average $/sq ft $267
| Address | Status | Price | $/Sq Ft | Bd / Ba | Sq Ft | Sold / market time | Distance |
|---|---|---|---|---|---|---|---|
| 6491 West Viking Road | Sold | $349,990 | $229 | 3 / 2 | 1,526 | Sold 2026-04-24 | 0.16 mi |
| 6461 West Viking Road | Active | $399,000 | $261 | 2 / 2 | 1,526 | 116 days on market | 0.18 mi |
| 6635 Baywood Avenue | Sold | $357,000 | $255 | 3 / 2 | 1,401 | Sold 2026-06-16 | 0.20 mi |
| 6441 Hummingbird Lane | Sold | $505,000 | $253 | 4 / 3 | 1,993 | Sold 2026-07-06 | 0.23 mi |
| 6373 Whippoorwill Way | Sold | $327,000 | $250 | 3 / 2 | 1,306 | Sold 2026-08-27 | 0.24 mi |
| 6364 Whippoorwill Way | Sold | $385,000 | $276 | 3 / 2 | 1,397 | Sold 2026-08-31 | 0.25 mi |
| 3960 Grapefruit Circle | Active | $380,000 | $287 | 3 / 2 | 1,326 | 0 days on market | 0.26 mi |
| 6371 West Viking Road | Active | $409,900 | $292 | 3 / 2 | 1,406 | 51 days on market | 0.27 mi |
| 3983 Redwood Street | Pending | $479,999 | $305 | 3 / 2 | 1,574 | 9 days on market | 0.28 mi |
| 6784 Mataro Drive | Pending | $434,900 | $278 | 4 / 2 | 1,562 | 98 days on market | 0.28 mi |
| 6357 Sparrow Lane | Active | $435,000 | $288 | 4 / 2 | 1,512 | 40 days on market | 0.34 mi |
| 6624 Mountainwood Lane | Sold | $365,000 | $227 | 3 / 2 | 1,606 | Sold 2026-06-30 | 0.36 mi |


