
Comparable Sales Near 11225 Sweet Cicely Avenue, Las Vegas, NV 89138
1st Realty · Comparable sales report · 1st.estate · October 20, 2026
Read the Summerlin neighborhood guide →
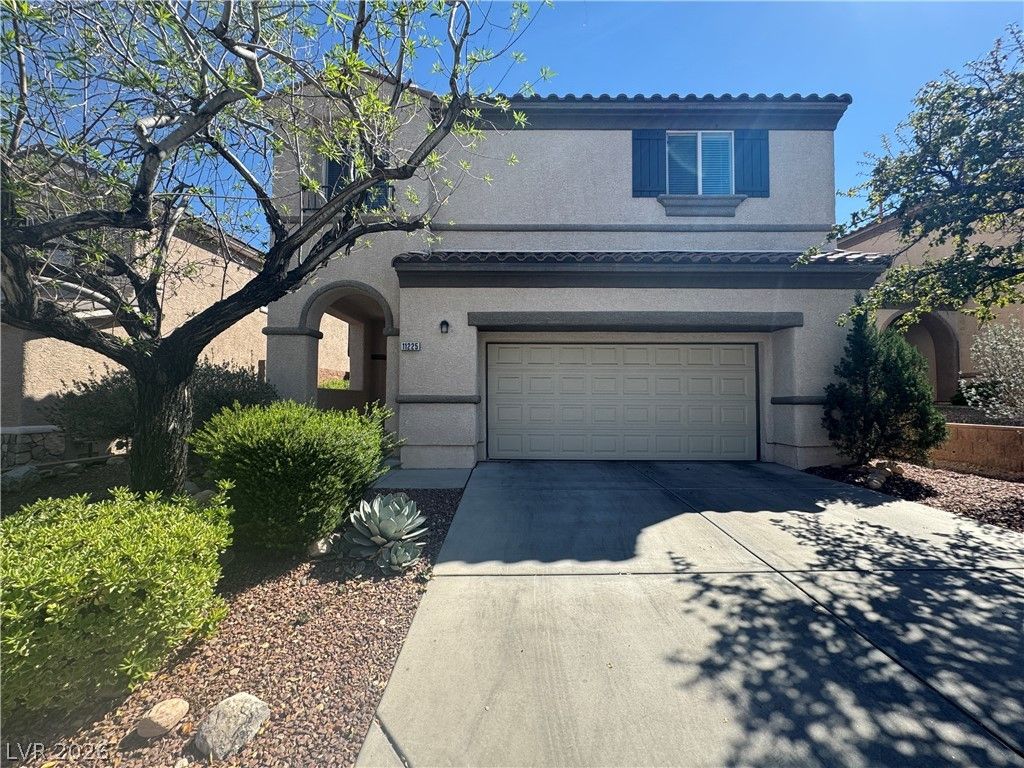
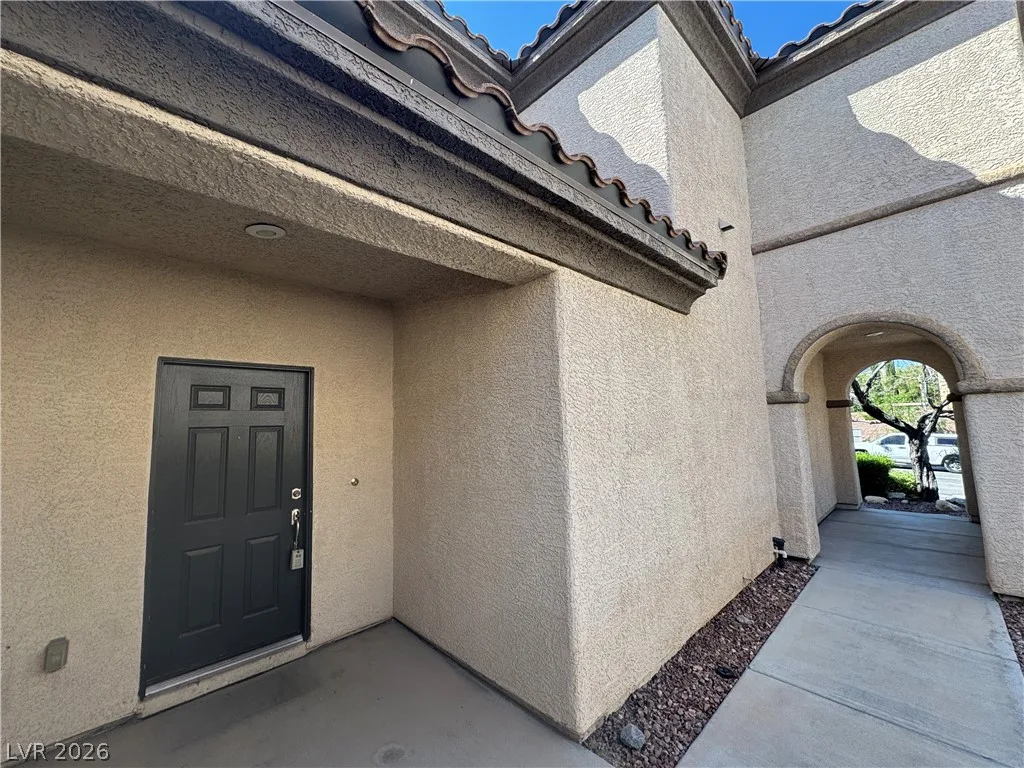
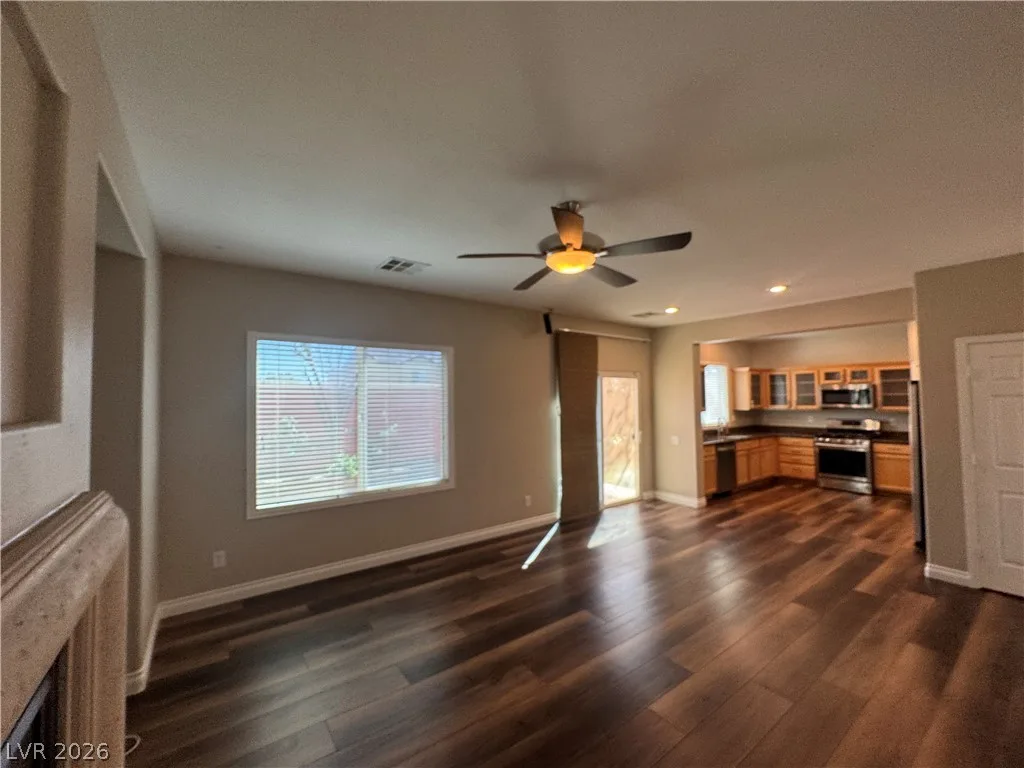
11225 Sweet Cicely Avenue, Las Vegas, NV 89138
Status: Sold
$2,390 Sold Price
$1
$ / Sq Ft
2,031
Living Area
3,920 sqft
Lot Size
3
Beds
3
Baths
2004
Year Built
Search Parameters
Property Type
Status
Radius
Sold Within
Beds
Baths
Living Area (Sq Ft)
Lot Size (Sq Ft)
This comp search reflects your current search parameters — adjust the filters above as needed for a more accurate estimate.
Estimated Value
—
Average $/Sqft
—
Check one or more comps below to calculate an estimate.
Nearest 10 of 52 comparable sales and listings within 1 mile of this home. Use the filters above and press Search to refine.
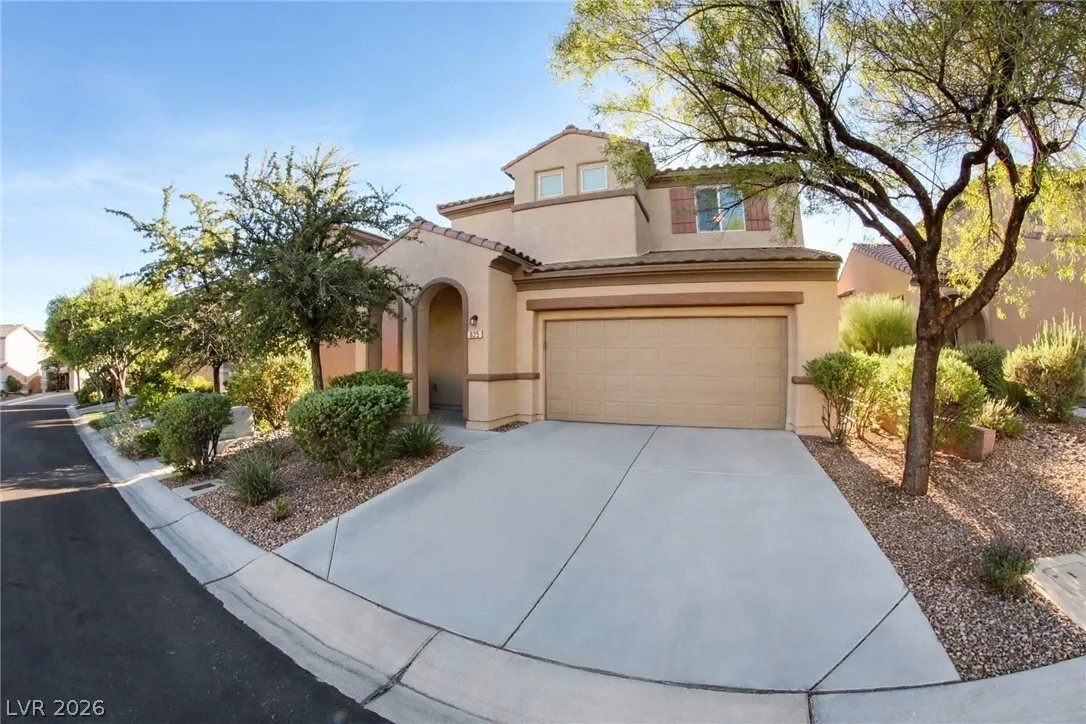
825 Jacobs Ladder PlaceActive
$459,0003 bd3 ba1,568 sqft$293/sqft0.05 mi2 days
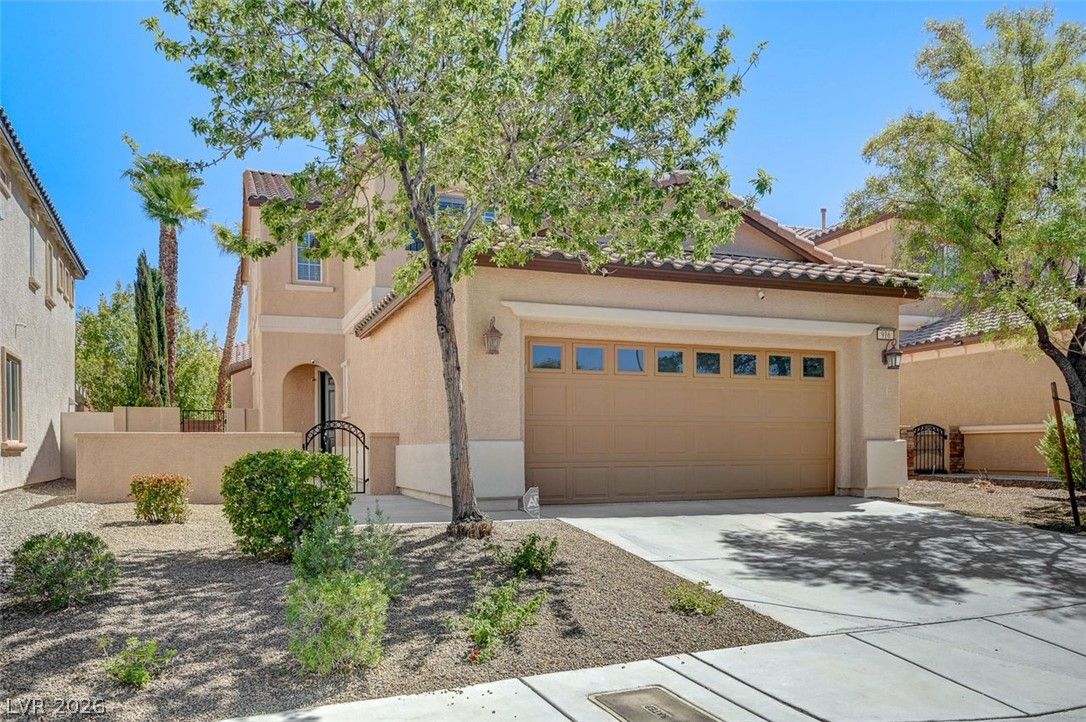
916 Baronet DriveActive
$565,0004 bd4 ba1,989 sqft$284/sqft0.07 mi33 days
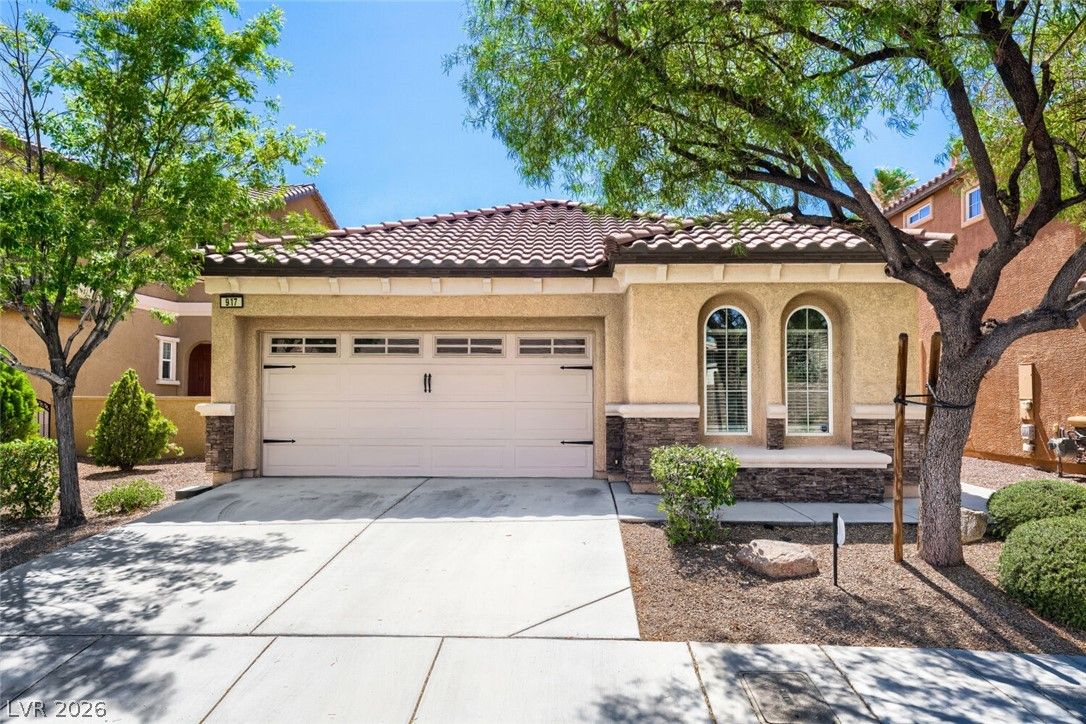
$596,0003 bd3 ba1,620 sqft$368/sqft0.08 mi8 daysSold 2026-08-11
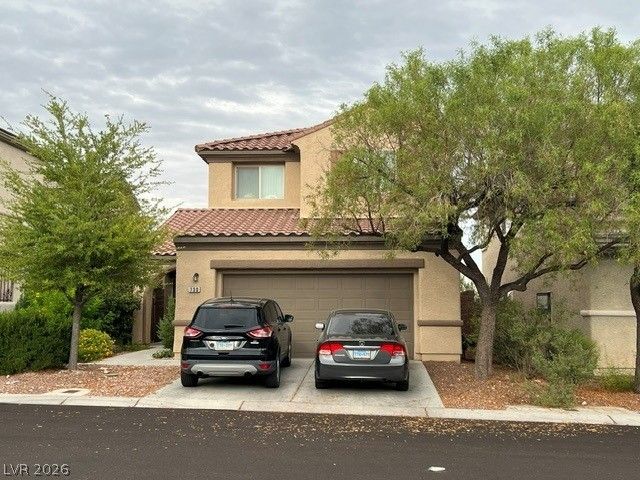
730 Sand Primrose StreetActive
$545,0003 bd3 ba1,708 sqft$319/sqft0.12 mi3 days
$495,0003 bd3 ba1,708 sqft$290/sqft0.15 mi4 daysSold 2026-05-01
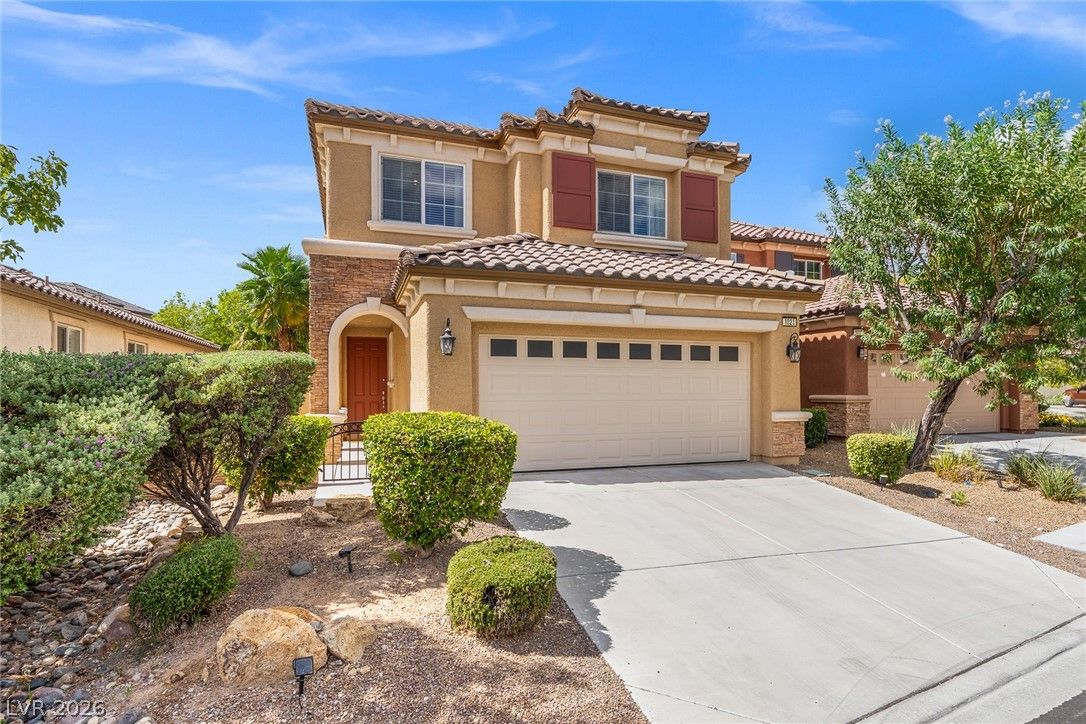
$649,9903 bd3 ba2,215 sqft$293/sqft0.23 mi15 days
$715,0004 bd3 ba2,483 sqft$288/sqft0.29 mi13 daysSold 2026-05-08

11037 Meadow Leaf AvenueActive
$480,0004 bd3 ba1,683 sqft$285/sqft0.35 mi0 days
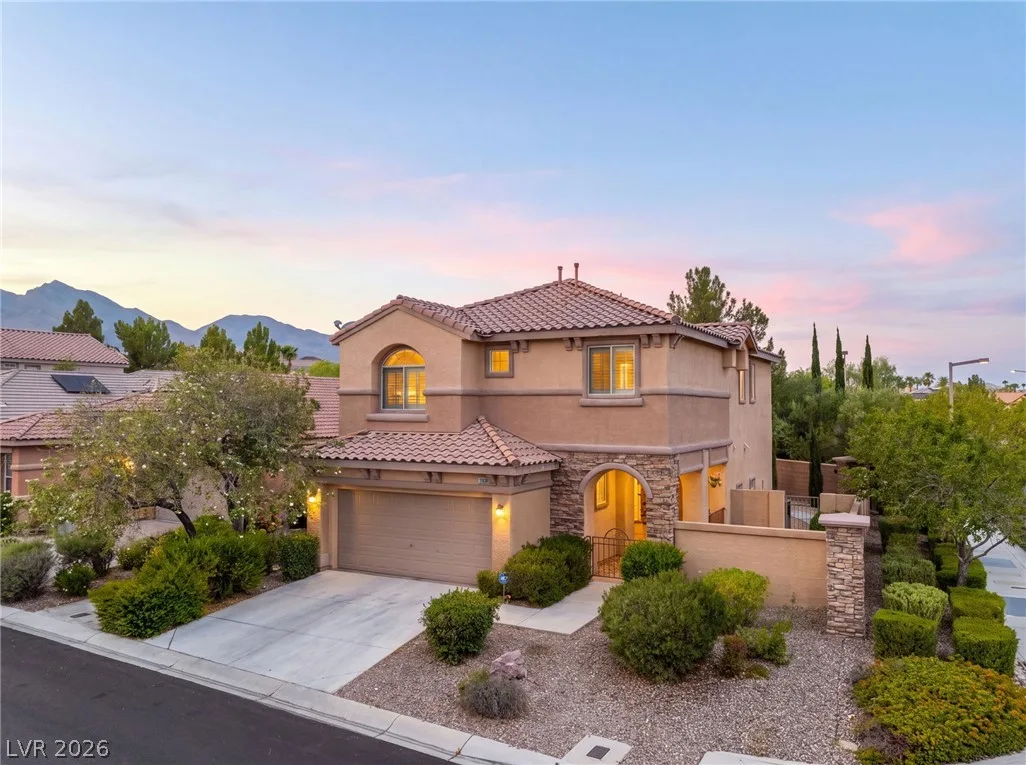
11436 Diveley AvenueActive
$609,0003 bd3 ba1,922 sqft$317/sqft0.37 mi0 days
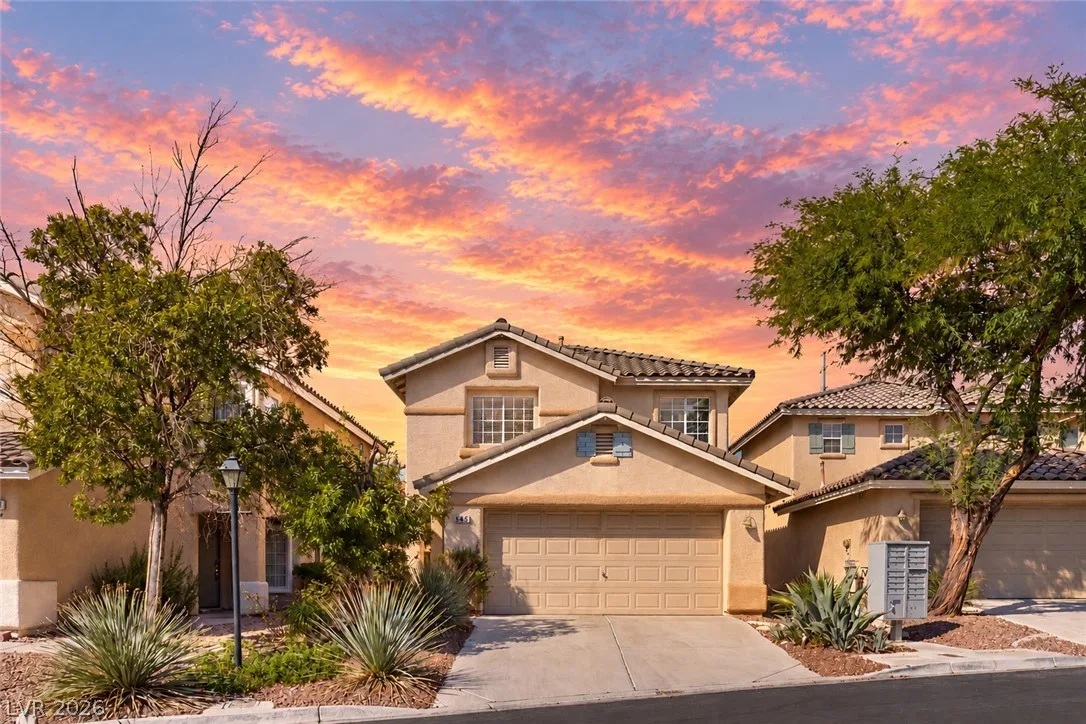
545 Aspen Leaf StreetActive
$455,0003 bd3 ba1,683 sqft$270/sqft0.38 mi19 days
Nearest comparable sales and listings
12 comparables · median price $525,000 · range $455,000 – $715,000 · median $/sq ft $291 · average $/sq ft $299
| Address | Status | Price | $/Sq Ft | Bd / Ba | Sq Ft | Sold / market time | Distance |
|---|---|---|---|---|---|---|---|
| 825 Jacobs Ladder Place | Active | $459,000 | $293 | 3 / 3 | 1,568 | 2 days on market | 0.05 mi |
| 916 Baronet Drive | Active | $565,000 | $284 | 4 / 4 | 1,989 | 33 days on market | 0.07 mi |
| 917 Ambrosia Drive | Sold | $596,000 | $368 | 3 / 3 | 1,620 | Sold 2026-08-11 | 0.08 mi |
| 730 Sand Primrose Street | Active | $545,000 | $319 | 3 / 3 | 1,708 | 3 days on market | 0.12 mi |
| 11237 Woodland Violet Avenue | Sold | $495,000 | $290 | 3 / 3 | 1,708 | Sold 2026-05-01 | 0.15 mi |
| 1021 Chestnut Chase Street | Active | $649,990 | $293 | 3 / 3 | 2,215 | 15 days on market | 0.23 mi |
| 11221 Stanwick Avenue | Sold | $715,000 | $288 | 4 / 3 | 2,483 | Sold 2026-05-08 | 0.29 mi |
| 11037 Meadow Leaf Avenue | Active | $480,000 | $285 | 4 / 3 | 1,683 | 0 days on market | 0.35 mi |
| 11436 Diveley Avenue | Active | $609,000 | $317 | 3 / 3 | 1,922 | 0 days on market | 0.37 mi |
| 545 Aspen Leaf Street | Active | $455,000 | $270 | 3 / 3 | 1,683 | 19 days on market | 0.38 mi |
| 1052 Brinkman Street | Sold | $505,000 | $263 | 3 / 3 | 1,922 | Sold 2026-09-09 | 0.39 mi |
| 11421 Drappo Avenue | Sold | $489,000 | $314 | 3 / 2 | 1,555 | Sold 2026-09-21 | 0.40 mi |


