
Comparable Sales Near 925 Lexington Cross Drive, Las Vegas, NV 89144
1st Realty · Comparable sales report · 1st.estate · October 20, 2026
Read the Summerlin neighborhood guide →
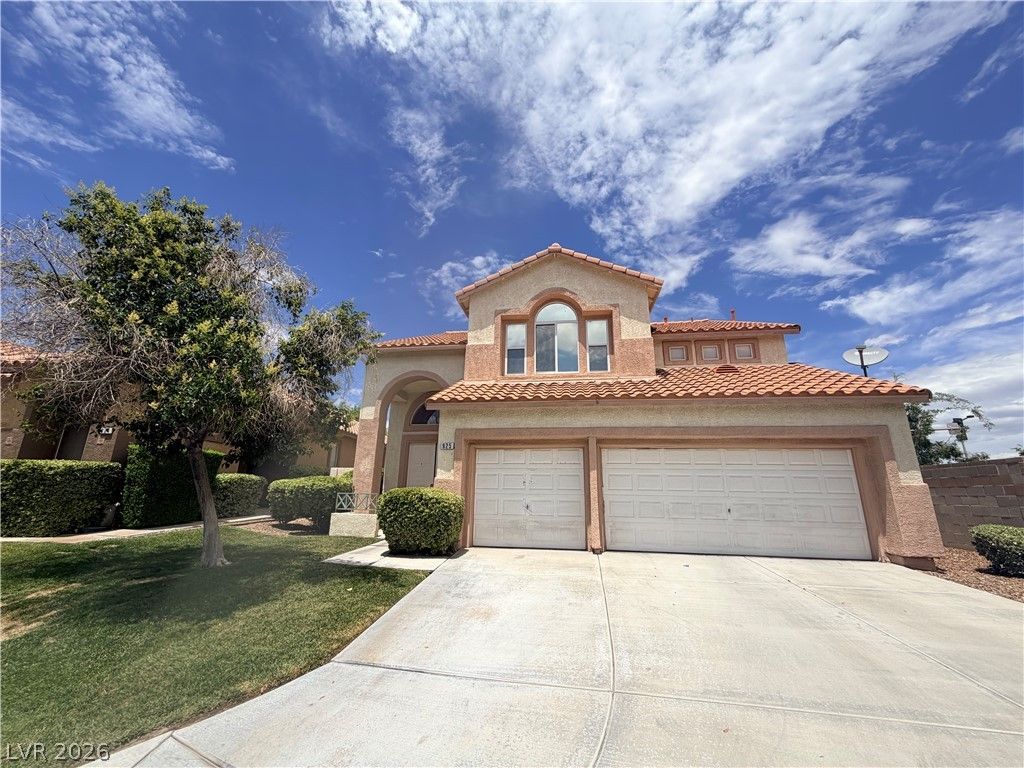
925 Lexington Cross Drive, Las Vegas, NV 89144
Status: Sold
$2,891 Sold Price
$1
$ / Sq Ft
2,625
Living Area
6,534 sqft
Lot Size
4
Beds
4
Baths
1996
Year Built
Search Parameters
Property Type
Status
Radius
Sold Within
Beds
Baths
Living Area (Sq Ft)
Lot Size (Sq Ft)
This comp search reflects your current search parameters — adjust the filters above as needed for a more accurate estimate.
Estimated Value
—
Average $/Sqft
—
Check one or more comps below to calculate an estimate.
Nearest 10 of 35 comparable sales and listings within 1 mile of this home. Use the filters above and press Search to refine.
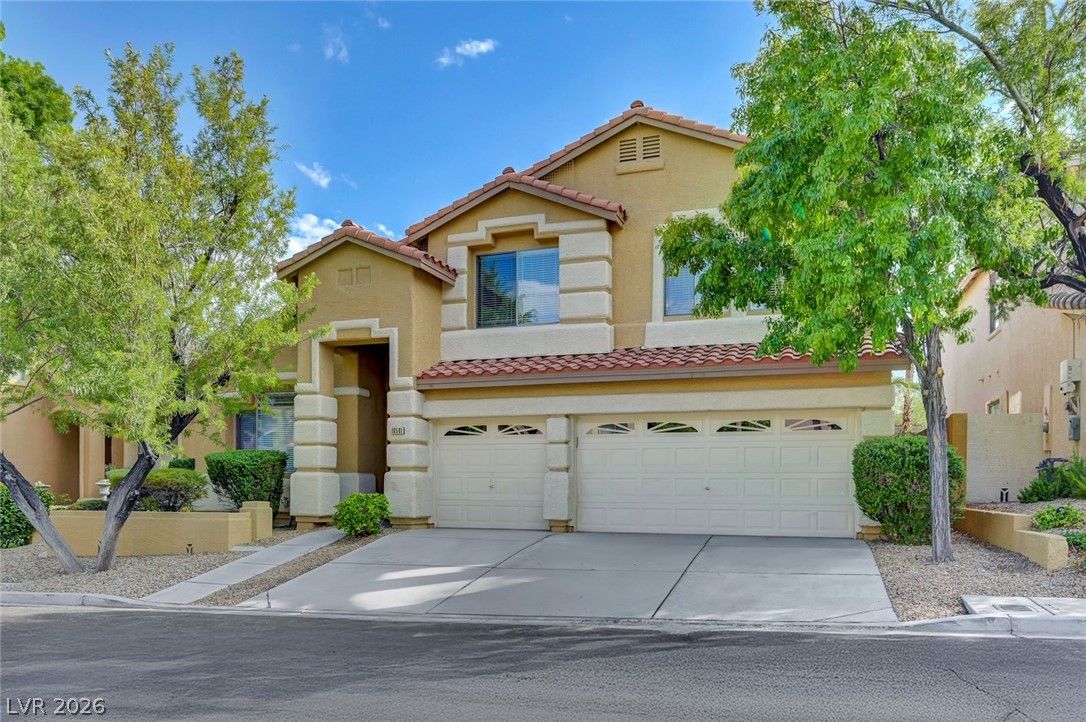
$699,0004 bd3 ba2,934 sqft$238/sqft0.19 mi42 days
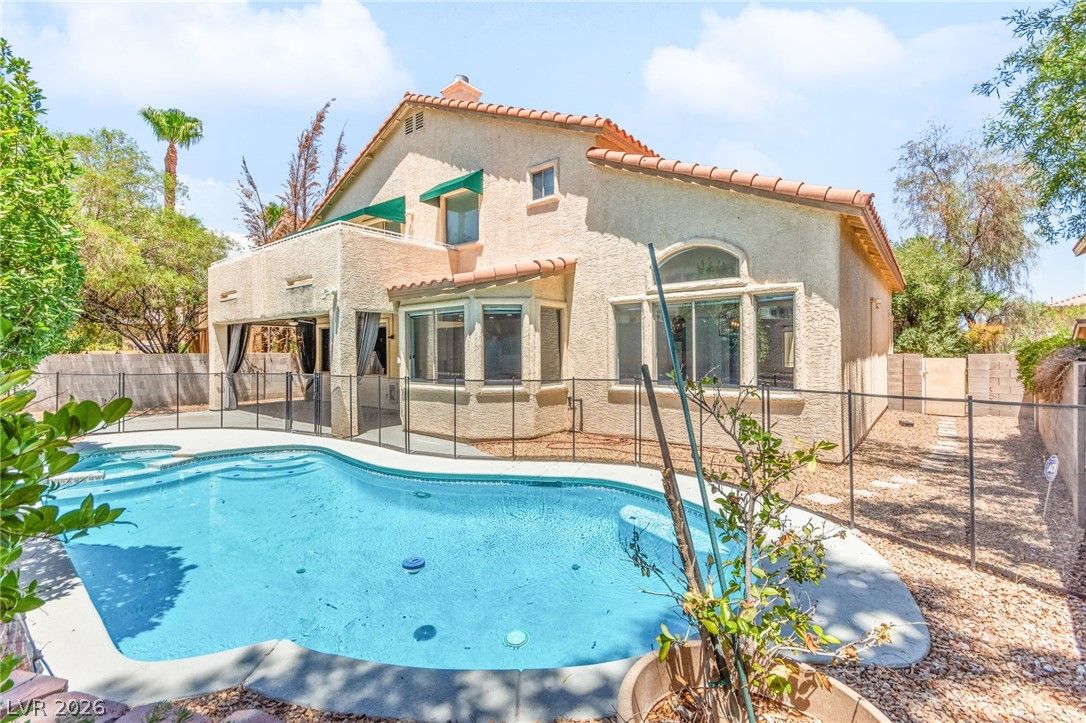
$785,0005 bd4 ba3,229 sqft$243/sqft0.21 mi13 daysSold 2026-09-23
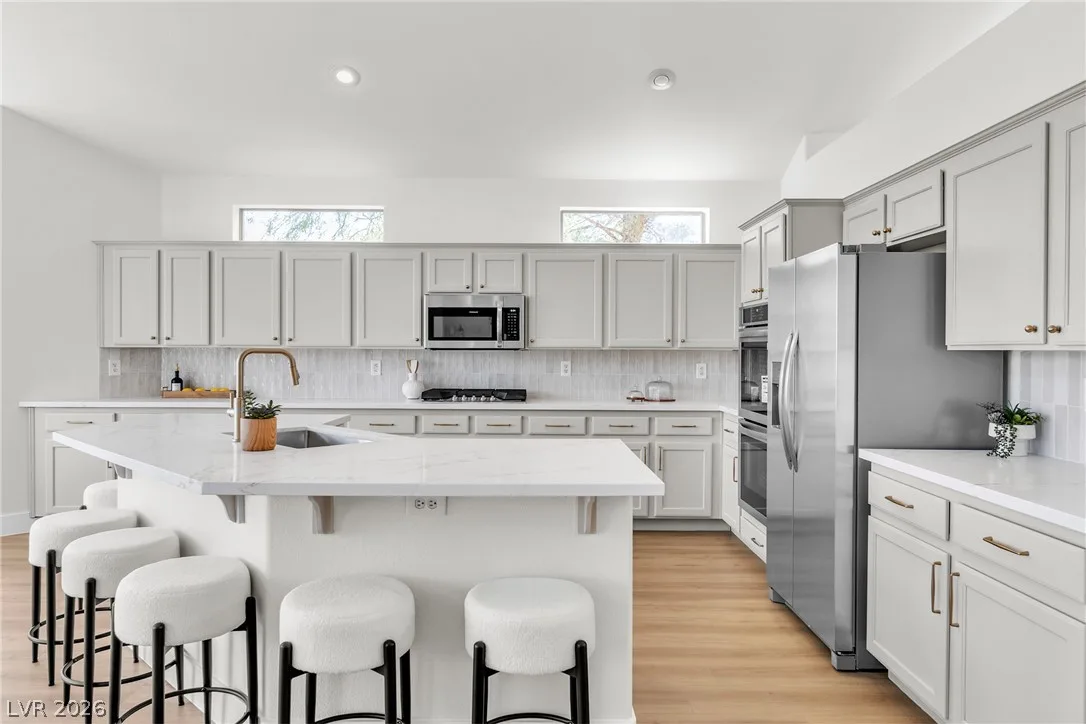
$799,0004 bd3 ba3,116 sqft$256/sqft0.29 mi8 days
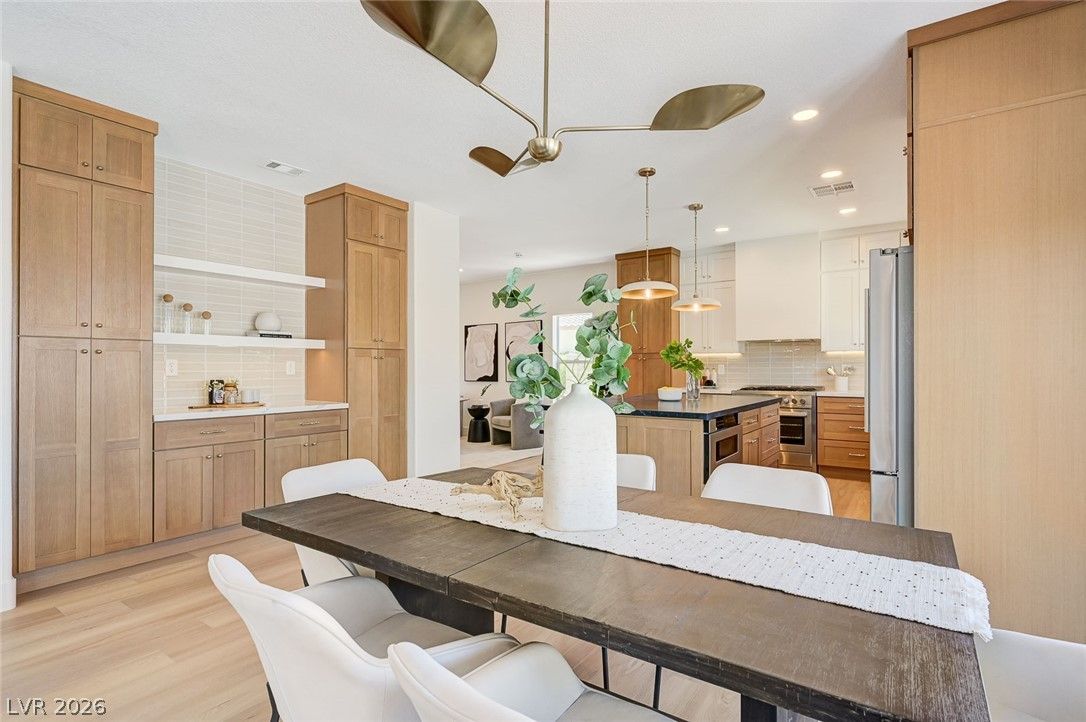
$755,0005 bd3 ba2,518 sqft$300/sqft0.29 mi7 daysSold 2026-09-30
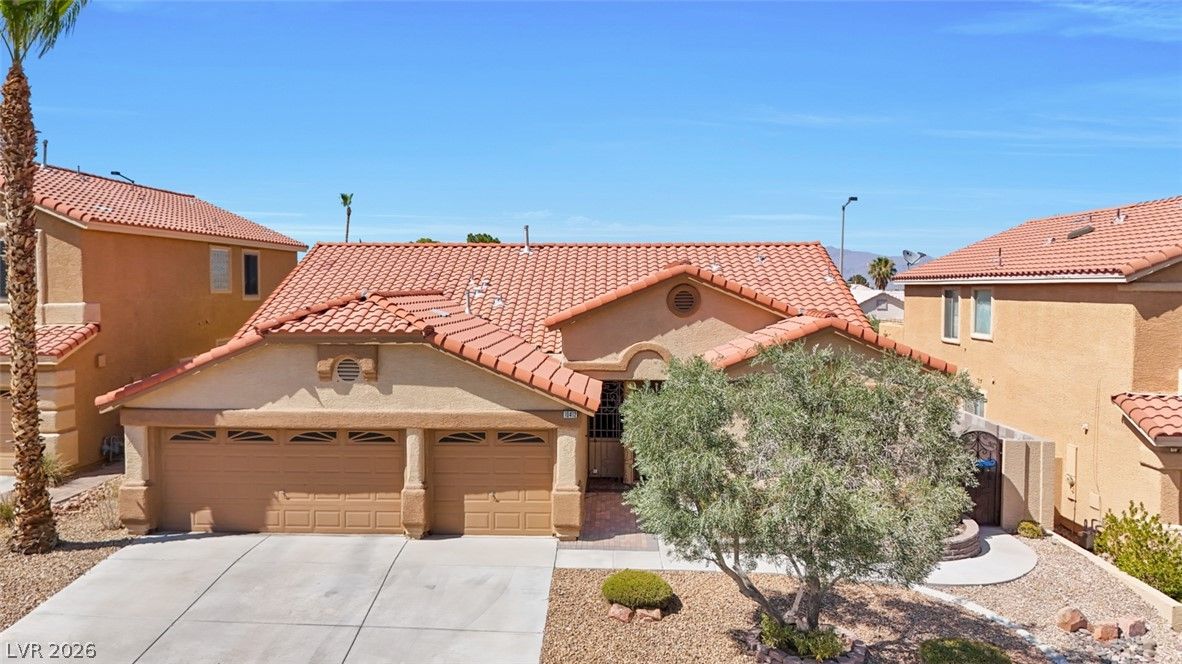
$589,0004 bd3 ba2,193 sqft$269/sqft0.33 mi72 daysSold 2026-10-08
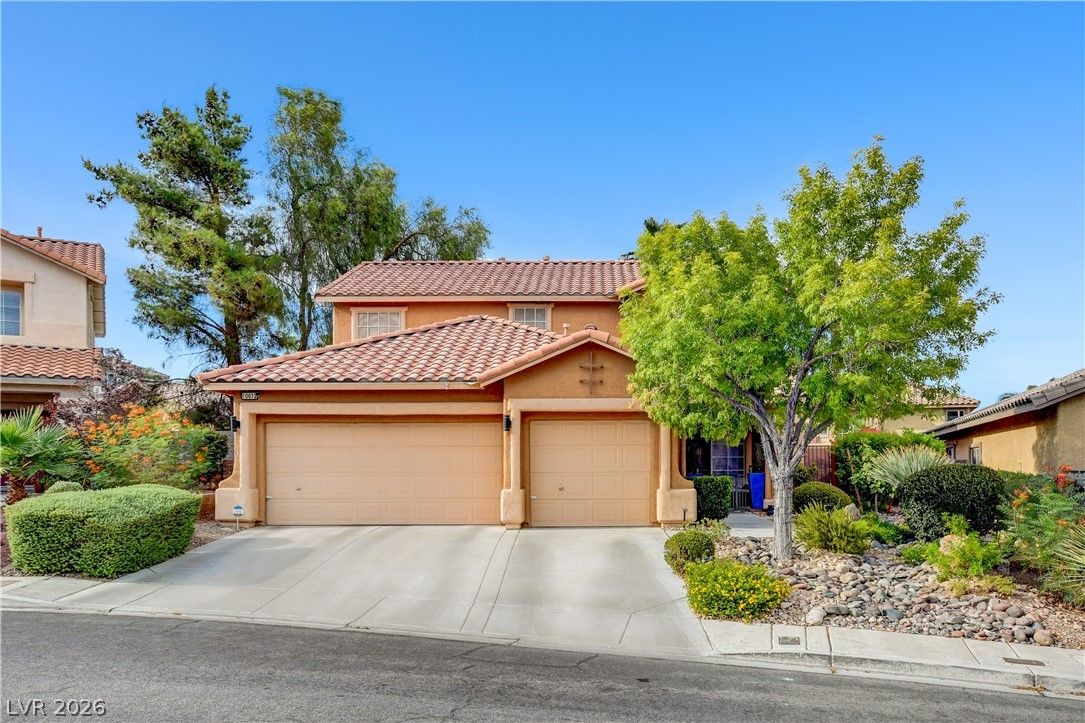
10612 Royal Willow PlaceActive
$650,0004 bd3 ba2,106 sqft$309/sqft0.35 mi53 days
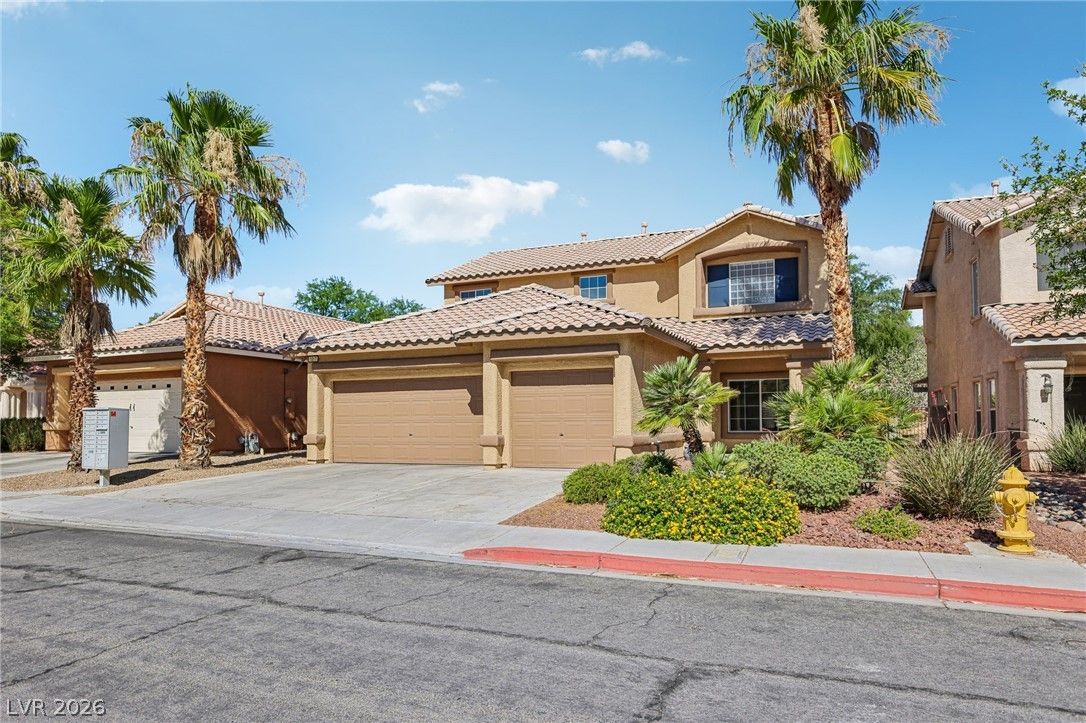
$540,0004 bd3 ba2,106 sqft$256/sqft0.39 mi20 daysSold 2026-09-04
$715,0004 bd3 ba2,391 sqft$299/sqft0.39 mi9 daysSold 2026-05-15
$525,0005 bd3 ba2,518 sqft$208/sqft0.44 mi30 daysSold 2026-07-08
$705,0005 bd3 ba2,829 sqft$249/sqft0.49 mi6 daysSold 2026-05-08
Nearest comparable sales and listings
12 comparables · median price $710,000 · range $525,000 – $1,250,000 · median $/sq ft $263 · average $/sq ft $285
| Address | Status | Price | $/Sq Ft | Bd / Ba | Sq Ft | Sold / market time | Distance |
|---|---|---|---|---|---|---|---|
| 10501 Pacific Palisades Avenue | Active | $699,000 | $238 | 4 / 3 | 2,934 | 42 days on market | 0.19 mi |
| 10425 Carmel Mountain Avenue | Sold | $785,000 | $243 | 5 / 4 | 3,229 | Sold 2026-09-23 | 0.21 mi |
| 10332 Falls Church Avenue | Active | $799,000 | $256 | 4 / 3 | 3,116 | 8 days on market | 0.29 mi |
| 10600 Olivebranch Avenue | Sold | $755,000 | $300 | 5 / 3 | 2,518 | Sold 2026-09-30 | 0.29 mi |
| 10412 FALLS CHURCH Avenue | Sold | $589,000 | $269 | 4 / 3 | 2,193 | Sold 2026-10-08 | 0.33 mi |
| 10612 Royal Willow Place | Active | $650,000 | $309 | 4 / 3 | 2,106 | 53 days on market | 0.35 mi |
| 1017 Royal Birch Lane | Sold | $540,000 | $256 | 4 / 3 | 2,106 | Sold 2026-09-04 | 0.39 mi |
| 10600 Austin Bluffs Avenue | Sold | $715,000 | $299 | 4 / 3 | 2,391 | Sold 2026-05-15 | 0.39 mi |
| 809 Royal Birch Lane | Sold | $525,000 | $208 | 5 / 3 | 2,518 | Sold 2026-07-08 | 0.44 mi |
| 637 Jade Cliffs Lane | Sold | $705,000 | $249 | 5 / 3 | 2,829 | Sold 2026-05-08 | 0.49 mi |
| 10453 Niagara Falls Lane | Sold | $750,000 | $311 | 5 / 3 | 2,411 | Sold 2026-10-13 | 0.50 mi |
| 512 Pima Canyon Court | Active | $1,250,000 | $478 | 3 / 3 | 2,613 | 0 days on market | 0.51 mi |


