
Comparable Sales Near 3725 Climbing Rose Street, Las Vegas, NV 89147
1st Realty · Comparable sales report · 1st.estate · October 20, 2026
Read the Spring Valley neighborhood guide →
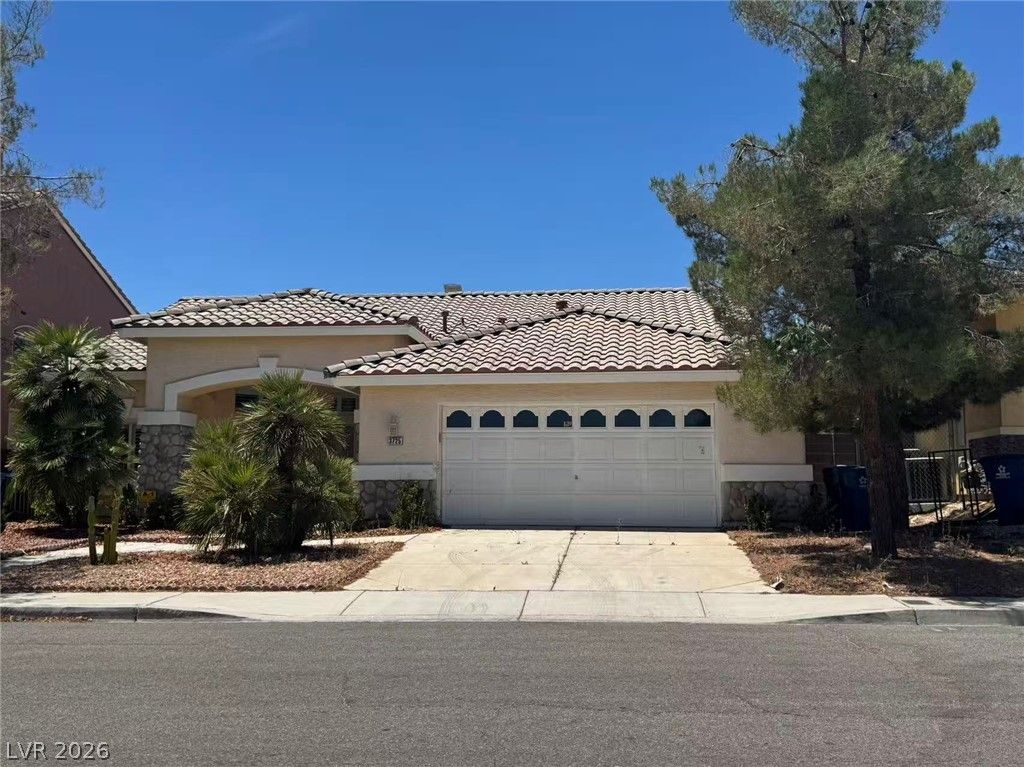
3725 Climbing Rose Street, Las Vegas, NV 89147
Status: Sold
$2,050 Sold Price
$1
$ / Sq Ft
2,392
Living Area
6,534 sqft
Lot Size
3
Beds
2
Baths
1995
Year Built
Search Parameters
Property Type
Status
Radius
Sold Within
Beds
Baths
Living Area (Sq Ft)
Lot Size (Sq Ft)
This comp search reflects your current search parameters — adjust the filters above as needed for a more accurate estimate.
Estimated Value
—
Average $/Sqft
—
Check one or more comps below to calculate an estimate.
Nearest 10 of 18 comparable sales and listings within 1 mile of this home. Use the filters above and press Search to refine.
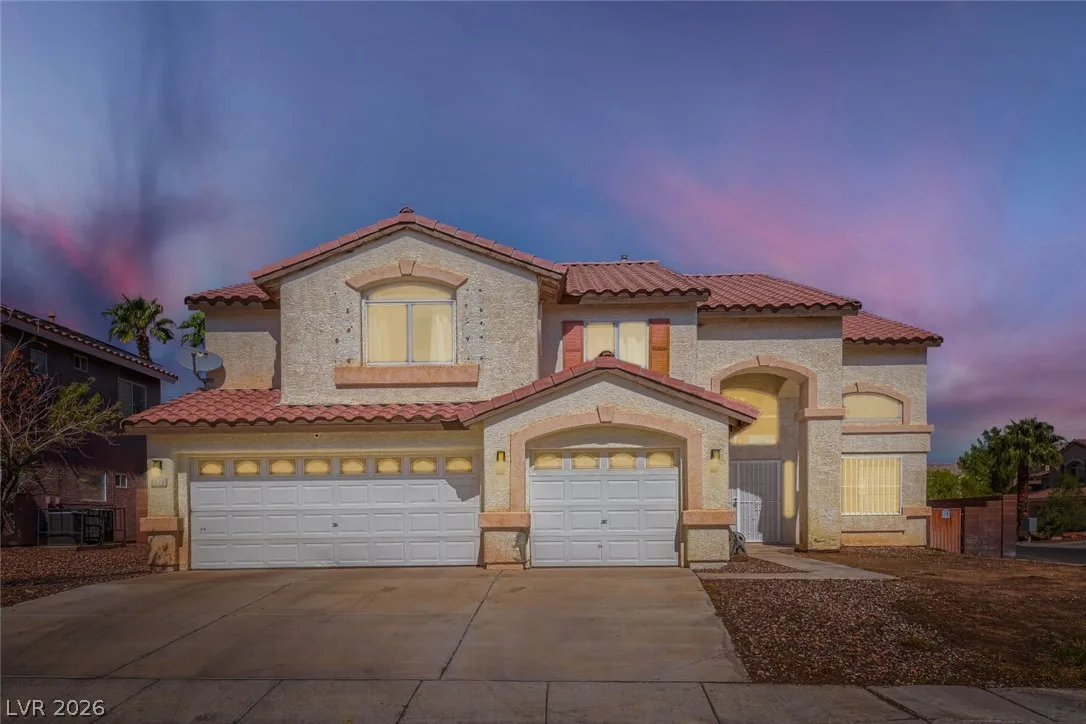
8022 Yellow Daisy AvenueActive
$699,9993 bd3 ba2,904 sqft$241/sqft0.08 mi0 days
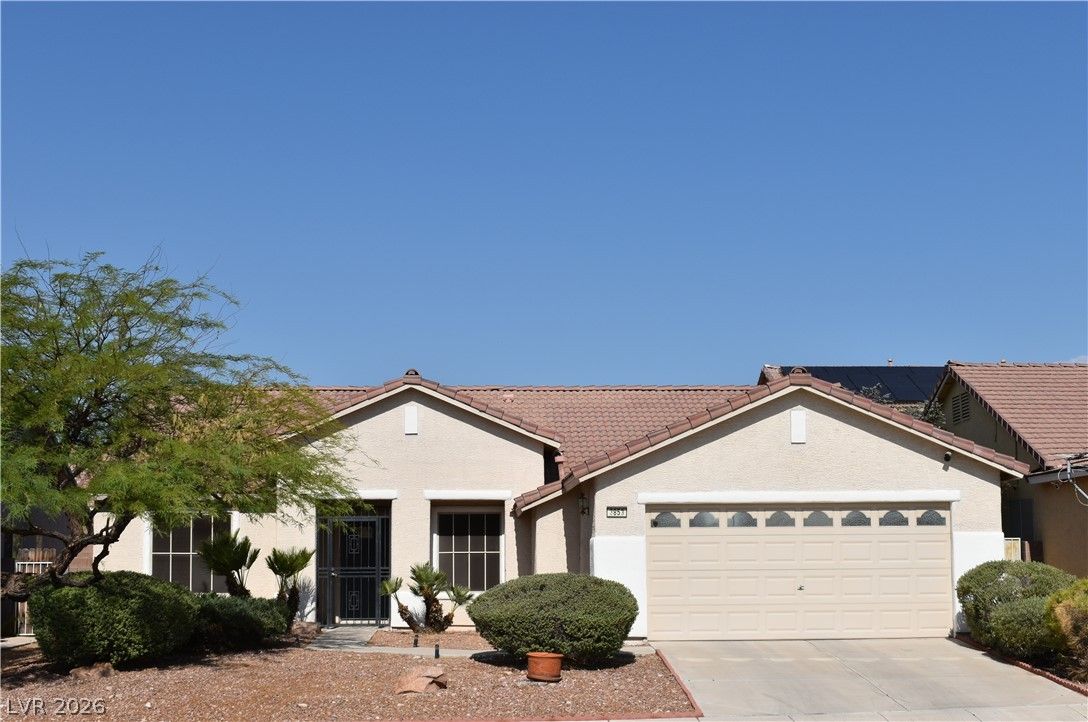
3853 Wild Pansy CourtActive
$495,0003 bd2 ba1,846 sqft$268/sqft0.18 mi2 days
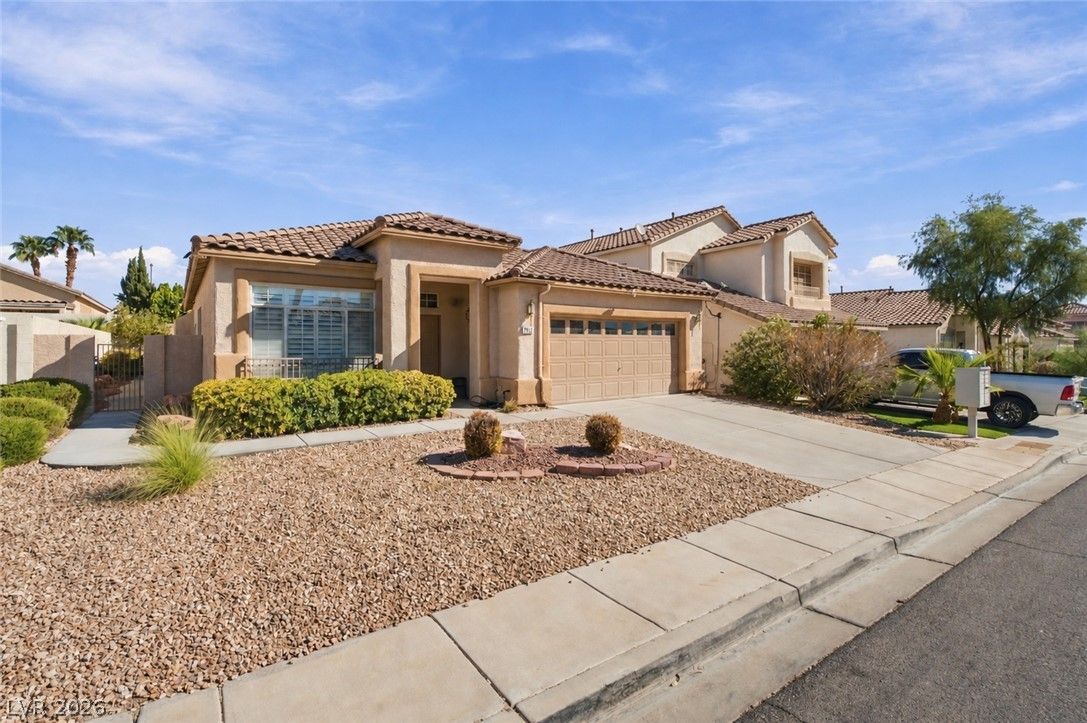
7952 Nookfield DriveUnder Contract
$460,0003 bd2 ba1,846 sqft$249/sqft0.21 mi16 days
$530,0004 bd3 ba2,540 sqft$209/sqft0.21 mi10 daysSold 2026-05-11
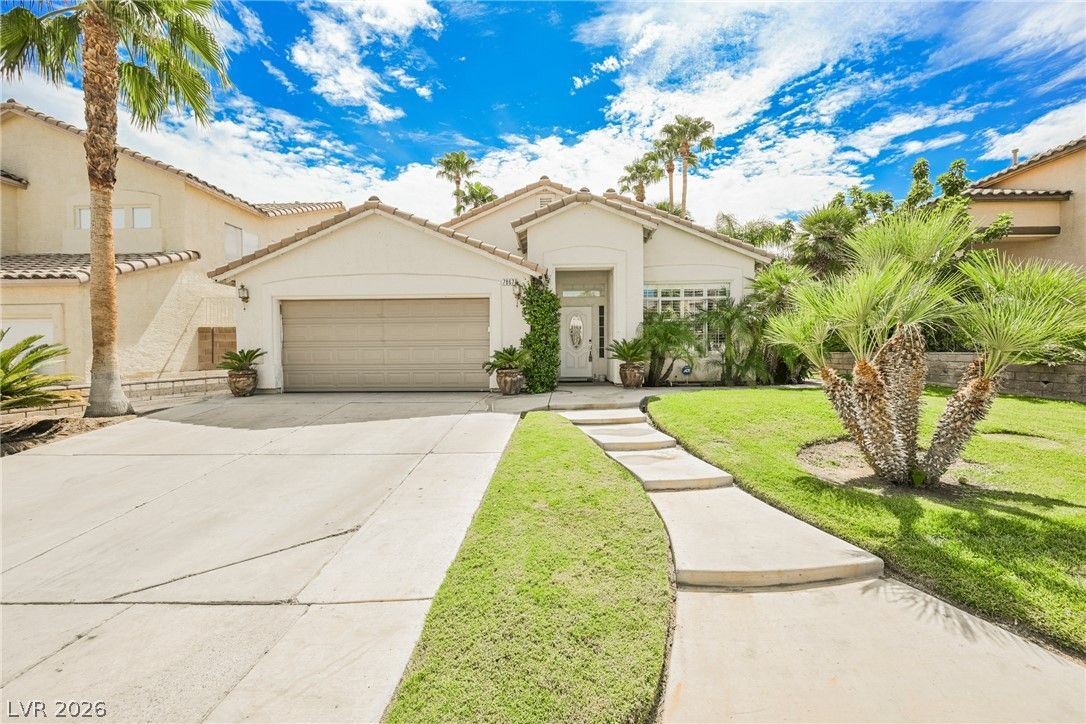
$415,0003 bd2 ba1,846 sqft$225/sqft0.27 mi24 daysSold 2026-10-19
$509,0003 bd2 ba1,846 sqft$276/sqft0.31 mi104 daysSold 2026-04-30

3872 Crest Horn Dr DriveActive
$437,5003 bd2 ba1,846 sqft$237/sqft0.33 mi119 days
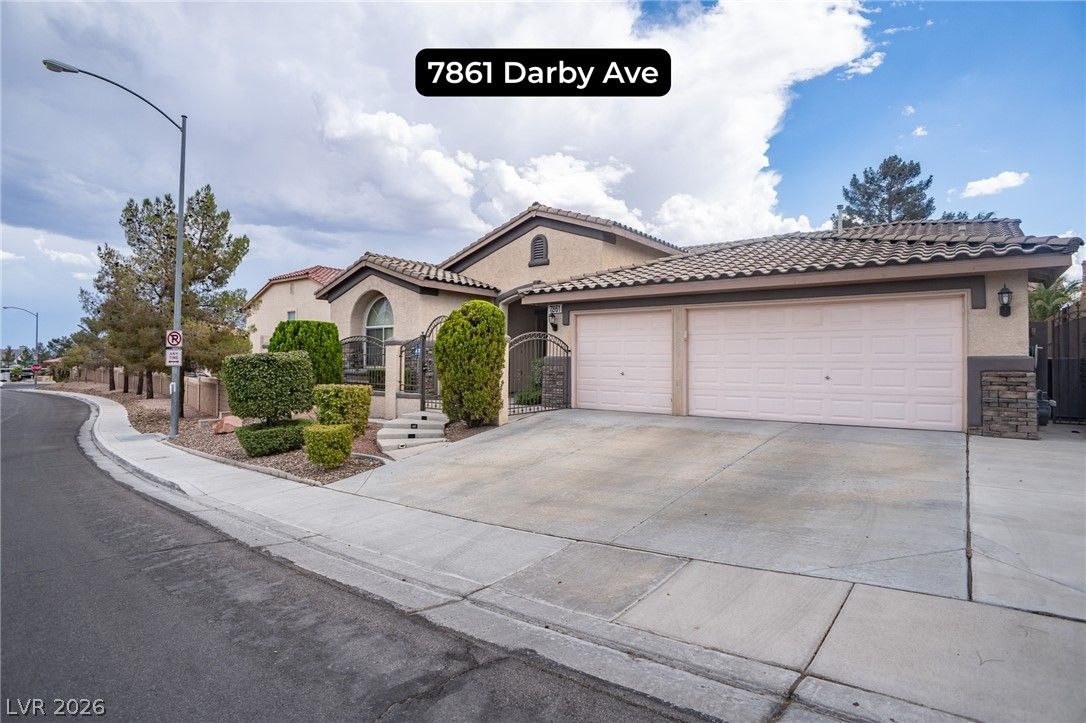
$650,0004 bd3 ba2,715 sqft$239/sqft0.68 mi10 daysSold 2026-09-17
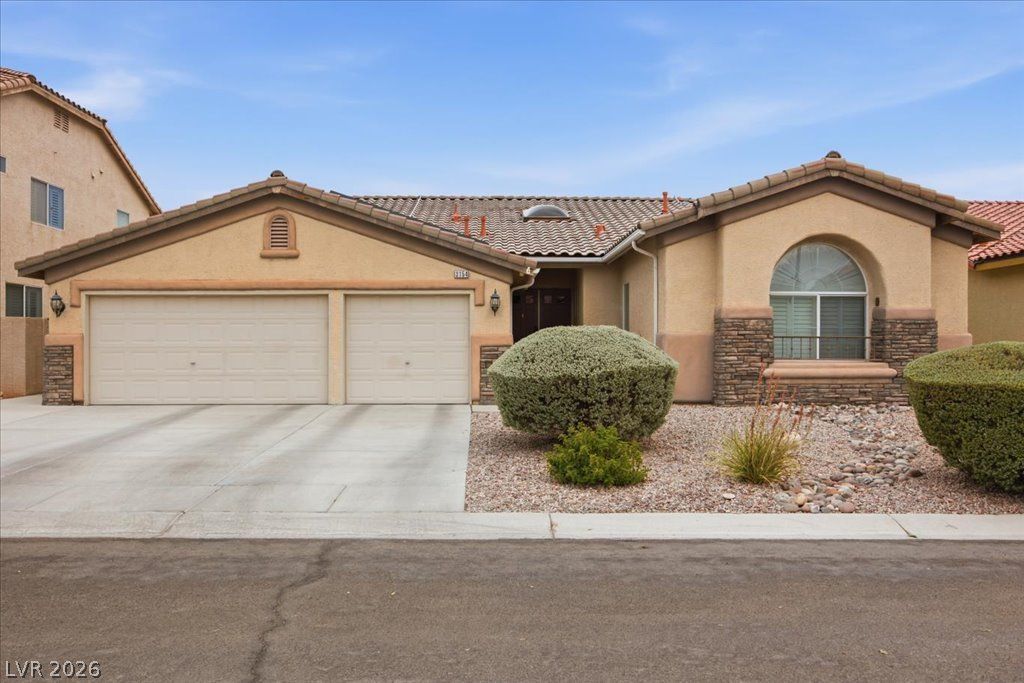
3154 Surf Spray StreetPending
$625,0003 bd3 ba2,516 sqft$248/sqft0.72 mi8 days

$590,0004 bd3 ba2,689 sqft$219/sqft0.74 mi8 daysSold 2026-10-15
Nearest comparable sales and listings
12 comparables · median price $504,500 · range $415,000 – $699,999 · median $/sq ft $243 · average $/sq ft $244
| Address | Status | Price | $/Sq Ft | Bd / Ba | Sq Ft | Sold / market time | Distance |
|---|---|---|---|---|---|---|---|
| 8022 Yellow Daisy Avenue | Active | $699,999 | $241 | 3 / 3 | 2,904 | 0 days on market | 0.08 mi |
| 3853 Wild Pansy Court | Active | $495,000 | $268 | 3 / 2 | 1,846 | 2 days on market | 0.18 mi |
| 7952 Nookfield Drive | Under Contract | $460,000 | $249 | 3 / 2 | 1,846 | 16 days on market | 0.21 mi |
| 3787 Bombastic Court | Sold | $530,000 | $209 | 4 / 3 | 2,540 | Sold 2026-05-11 | 0.21 mi |
| 7867 Sea Horn Court | Sold | $415,000 | $225 | 3 / 2 | 1,846 | Sold 2026-10-19 | 0.27 mi |
| 7842 Nookfield Drive | Sold | $509,000 | $276 | 3 / 2 | 1,846 | Sold 2026-04-30 | 0.31 mi |
| 3872 Crest Horn Dr Drive | Active | $437,500 | $237 | 3 / 2 | 1,846 | 119 days on market | 0.33 mi |
| 7861 Darby Avenue | Sold | $650,000 | $239 | 4 / 3 | 2,715 | Sold 2026-09-17 | 0.68 mi |
| 3154 Surf Spray Street | Pending | $625,000 | $248 | 3 / 3 | 2,516 | 8 days on market | 0.72 mi |
| 3139 Surf Spray Street | Sold | $590,000 | $219 | 4 / 3 | 2,689 | Sold 2026-10-15 | 0.74 mi |
| 7664 Hernando Drive | Sold | $499,999 | $268 | 4 / 3 | 1,868 | Sold 2026-04-29 | 0.78 mi |
| 4279 Hebron Drive | Active | $450,000 | $246 | 3 / 3 | 1,832 | 27 days on market | 0.80 mi |


