
Comparable Sales Near 2533 Tumble Brook Drive, Las Vegas, NV 89134
1st Realty · Comparable sales report · 1st.estate · October 21, 2026
Read the Sun City Summerlin neighborhood guide →
2533 Tumble Brook Drive, Las Vegas, NV 89134
Status: Sold
$1,975 Sold Price
$2
$ / Sq Ft
1,188
Living Area
6,970 sqft
Lot Size
2
Beds
2
Baths
1992
Year Built
Search Parameters
Property Type
Status
Radius
Sold Within
Beds
Baths
Living Area (Sq Ft)
Lot Size (Sq Ft)
This comp search reflects your current search parameters — adjust the filters above as needed for a more accurate estimate.
Estimated Value
—
Average $/Sqft
—
Check one or more comps below to calculate an estimate.
Nearest 10 of 39 comparable sales and listings within 1 mile of this home. Use the filters above and press Search to refine.
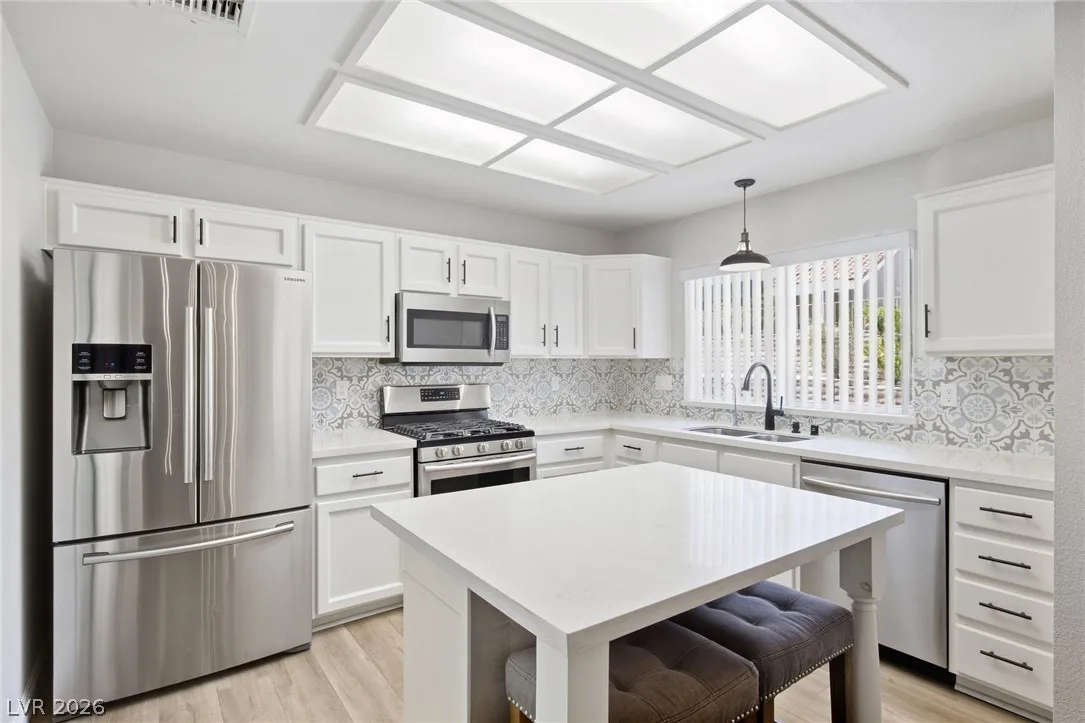
2529 Highvale DriveActive
$400,0002 bd2 ba1,188 sqft$337/sqft0.05 mi0 days
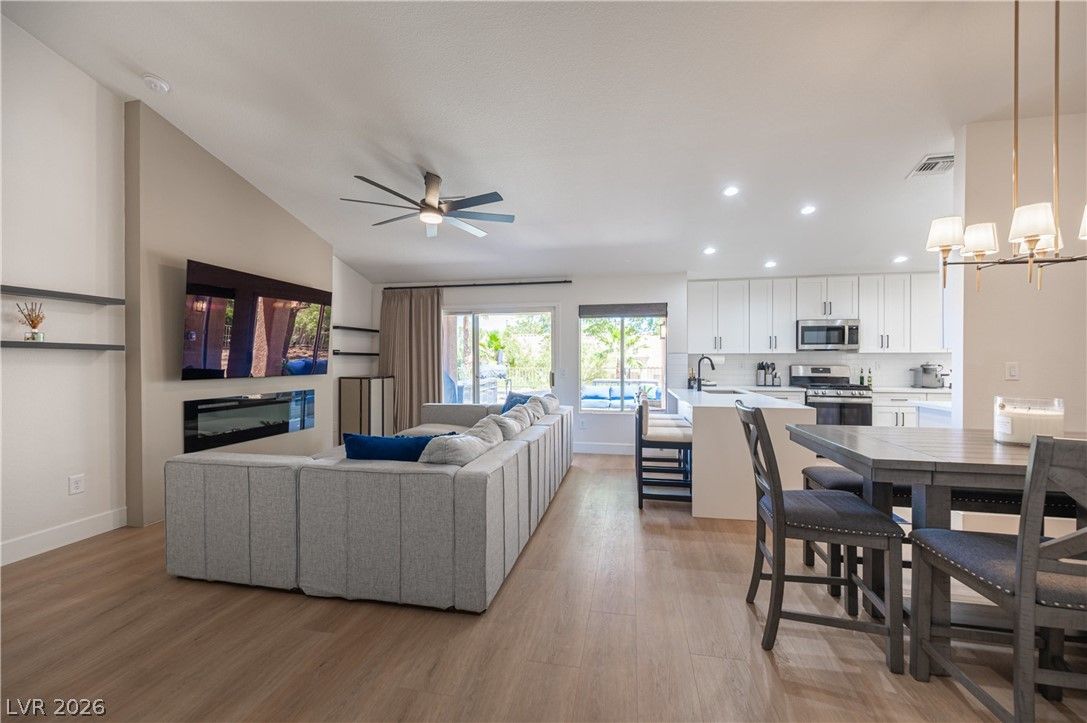
2548 Tumble Brook DriveActive
$469,0002 bd2 ba1,384 sqft$339/sqft0.05 mi209 days
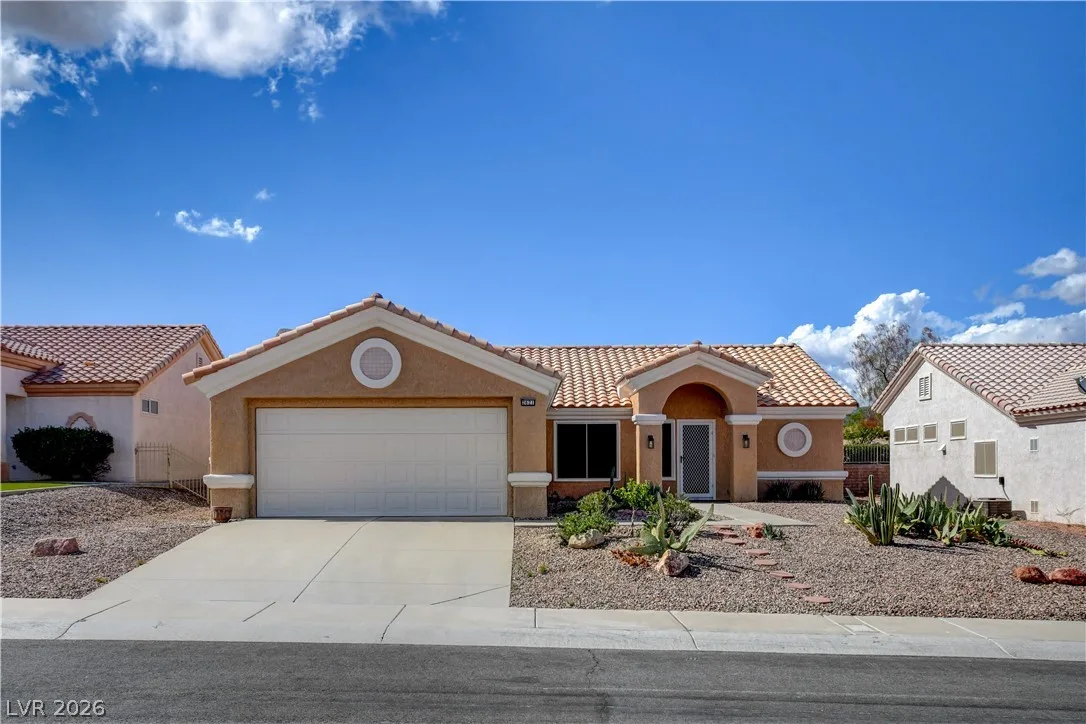
2621 Lotus Hill DriveActive
$465,0002 bd2 ba1,374 sqft$338/sqft0.13 mi21 days
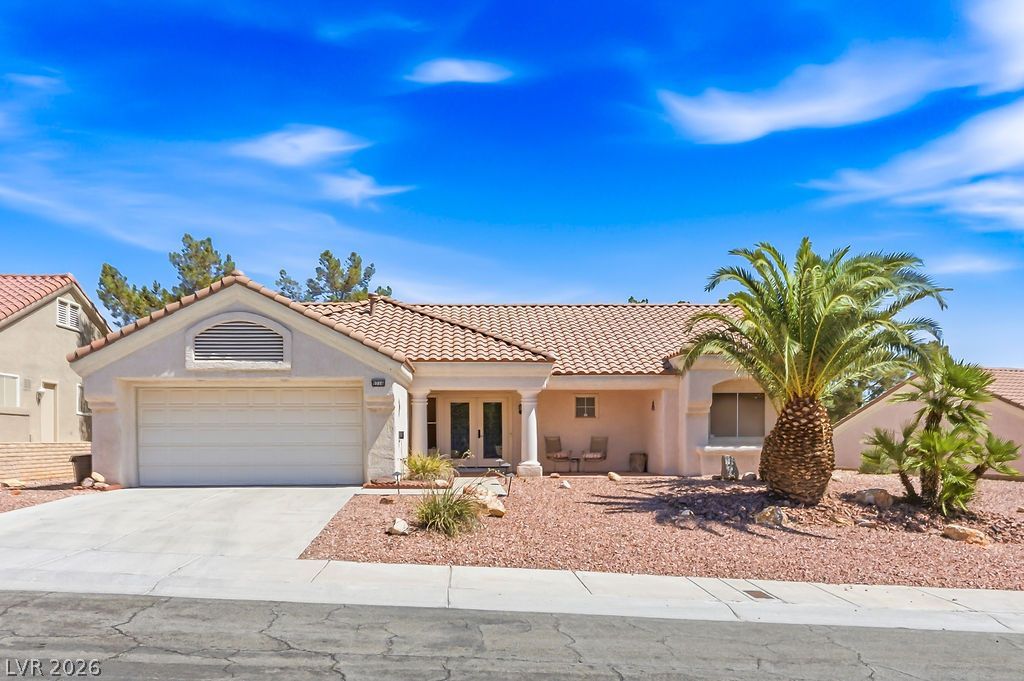
$385,0002 bd2 ba1,384 sqft$278/sqft0.17 mi10 daysSold 2026-07-30
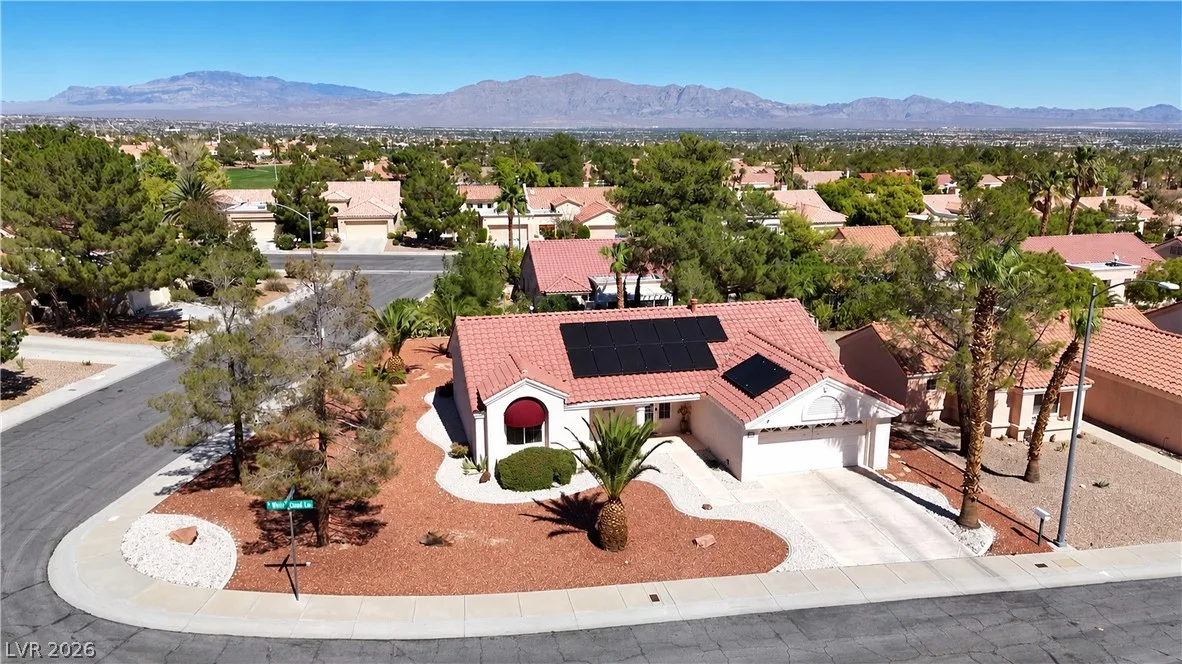
9720 White Cloud DriveActive
$369,9002 bd2 ba1,172 sqft$316/sqft0.22 mi19 days
$385,0002 bd2 ba1,384 sqft$278/sqft0.22 mi73 daysSold 2026-05-05
$472,5002 bd2 ba1,388 sqft$340/sqft0.25 mi53 daysSold 2026-07-22
$410,0002 bd2 ba1,402 sqft$292/sqft0.26 mi13 daysSold 2026-06-24
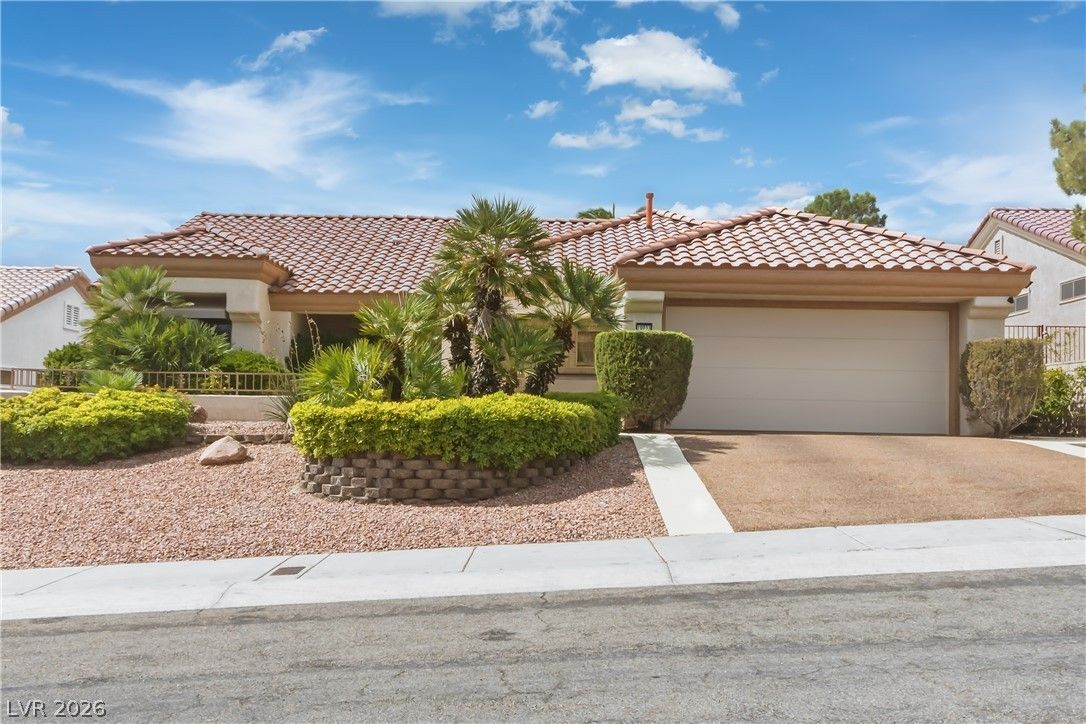
$390,0002 bd2 ba1,384 sqft$282/sqft0.30 mi25 daysSold 2026-08-14

9917 Woodhouse DriveActive
$399,9002 bd2 ba1,388 sqft$288/sqft0.33 mi123 days
Nearest comparable sales and listings
12 comparables · median price $395,700 · range $337,500 – $472,500 · median $/sq ft $291 · average $/sq ft $305
| Address | Status | Price | $/Sq Ft | Bd / Ba | Sq Ft | Sold / market time | Distance |
|---|---|---|---|---|---|---|---|
| 2529 Highvale Drive | Active | $400,000 | $337 | 2 / 2 | 1,188 | 0 days on market | 0.05 mi |
| 2548 Tumble Brook Drive | Active | $469,000 | $339 | 2 / 2 | 1,384 | 209 days on market | 0.05 mi |
| 2621 Lotus Hill Drive | Active | $465,000 | $338 | 2 / 2 | 1,374 | 21 days on market | 0.13 mi |
| 9716 Blue Bell Drive | Sold | $385,000 | $278 | 2 / 2 | 1,384 | Sold 2026-07-30 | 0.17 mi |
| 9720 White Cloud Drive | Active | $369,900 | $316 | 2 / 2 | 1,172 | 19 days on market | 0.22 mi |
| 9705 Blue Bell Drive | Sold | $385,000 | $278 | 2 / 2 | 1,384 | Sold 2026-05-05 | 0.22 mi |
| 10013 Cresent Creek Drive | Sold | $472,500 | $340 | 2 / 2 | 1,388 | Sold 2026-07-22 | 0.25 mi |
| 10009 Keysborough Drive | Sold | $410,000 | $292 | 2 / 2 | 1,402 | Sold 2026-06-24 | 0.26 mi |
| 10033 Hope Island Drive | Sold | $390,000 | $282 | 2 / 2 | 1,384 | Sold 2026-08-14 | 0.30 mi |
| 9917 Woodhouse Drive | Active | $399,900 | $288 | 2 / 2 | 1,388 | 123 days on market | 0.33 mi |
| 10033 Netherton Drive | Under Contract | $337,500 | $290 | 2 / 2 | 1,165 | 13 days on market | 0.38 mi |
| 10133 Cresent Creek Drive | Sold | $391,500 | $279 | 2 / 2 | 1,402 | Sold 2026-08-31 | 0.40 mi |


