
Comparable Sales Near 7385 Vireo Drive, Las Vegas, NV 89147
1st Realty · Comparable sales report · 1st.estate · October 20, 2026
Read the Spring Valley neighborhood guide →
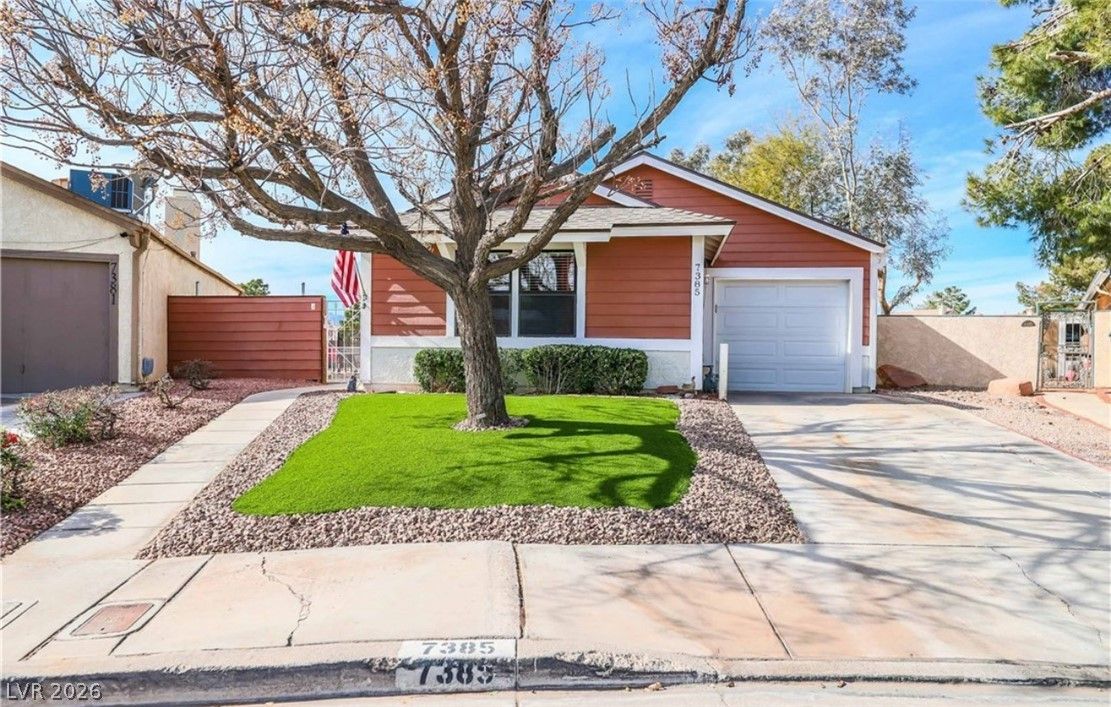
7385 Vireo Drive, Las Vegas, NV 89147
Status: Sold
$2,000 Sold Price
$2
$ / Sq Ft
1,081
Living Area
6,970 sqft
Lot Size
2
Beds
2
Baths
1983
Year Built
Search Parameters
Property Type
Status
Radius
Sold Within
Beds
Baths
Living Area (Sq Ft)
Lot Size (Sq Ft)
This comp search reflects your current search parameters — adjust the filters above as needed for a more accurate estimate.
Estimated Value
—
Average $/Sqft
—
Check one or more comps below to calculate an estimate.
Nearest 10 of 13 comparable sales and listings within 1 mile of this home. Use the filters above and press Search to refine.
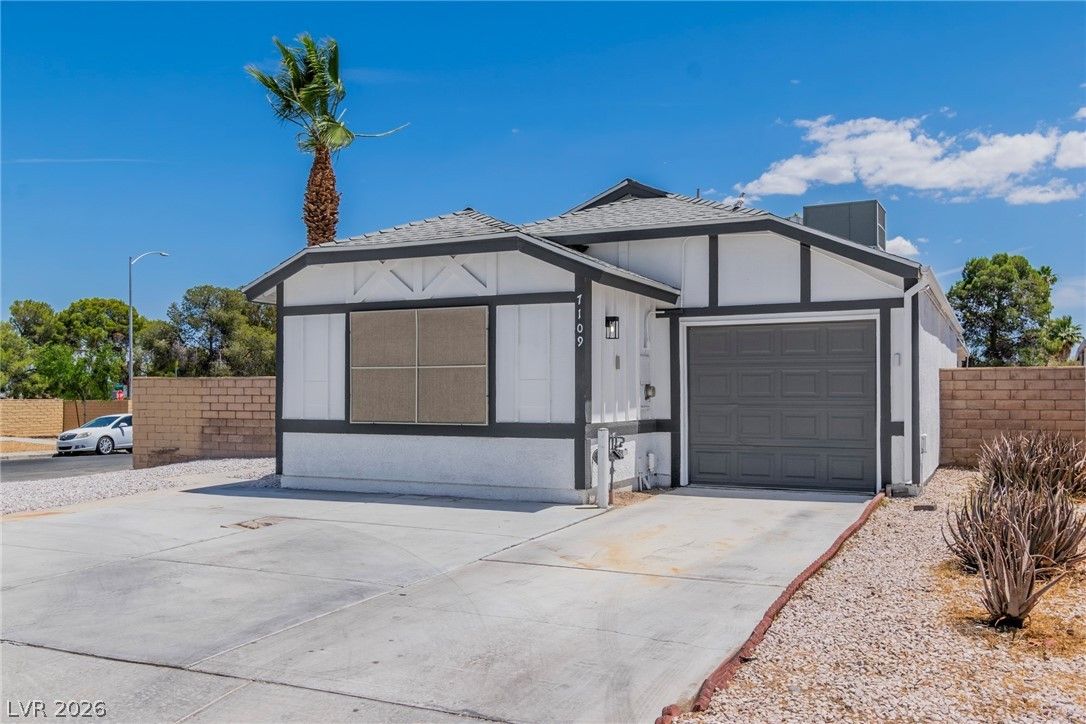
$375,0002 bd2 ba932 sqft$402/sqft0.35 mi20 daysSold 2026-07-24
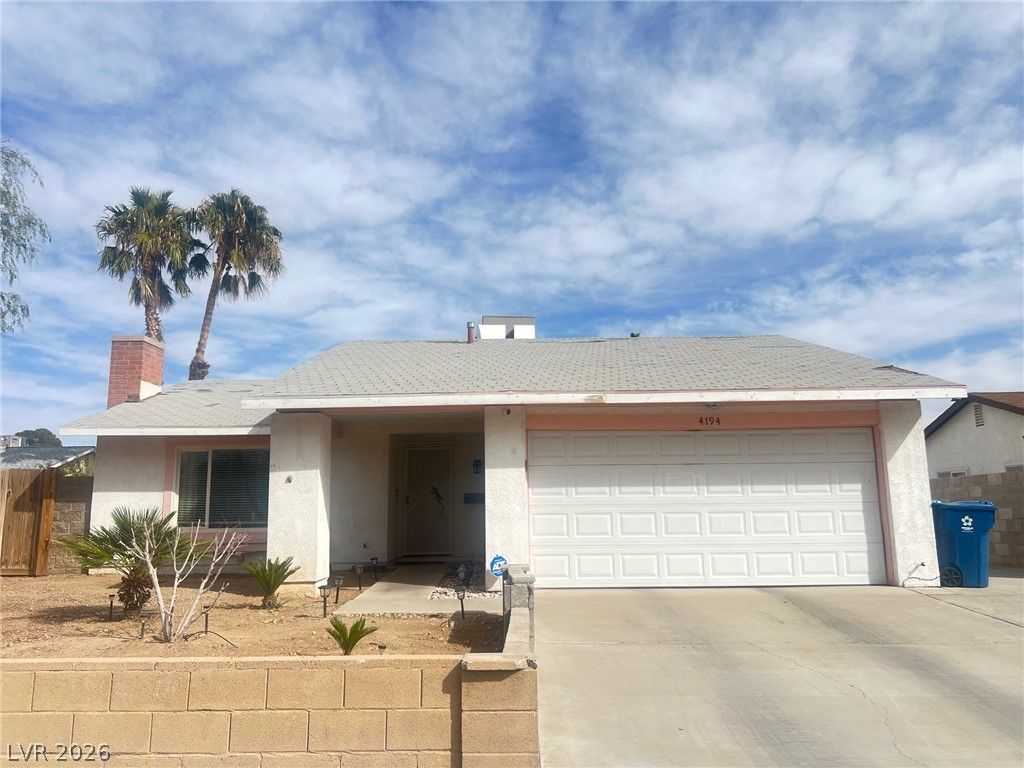
4194 Greenpoint StreetActive
$425,0003 bd2 ba1,202 sqft$354/sqft0.36 mi14 days

7112 Fenway AvenueActive
$412,5003 bd2 ba1,202 sqft$343/sqft0.43 mi25 days
4347 Apex DriveSold
$415,0003 bd2 ba1,300 sqft$319/sqft0.43 mi154 daysSold 2026-05-15
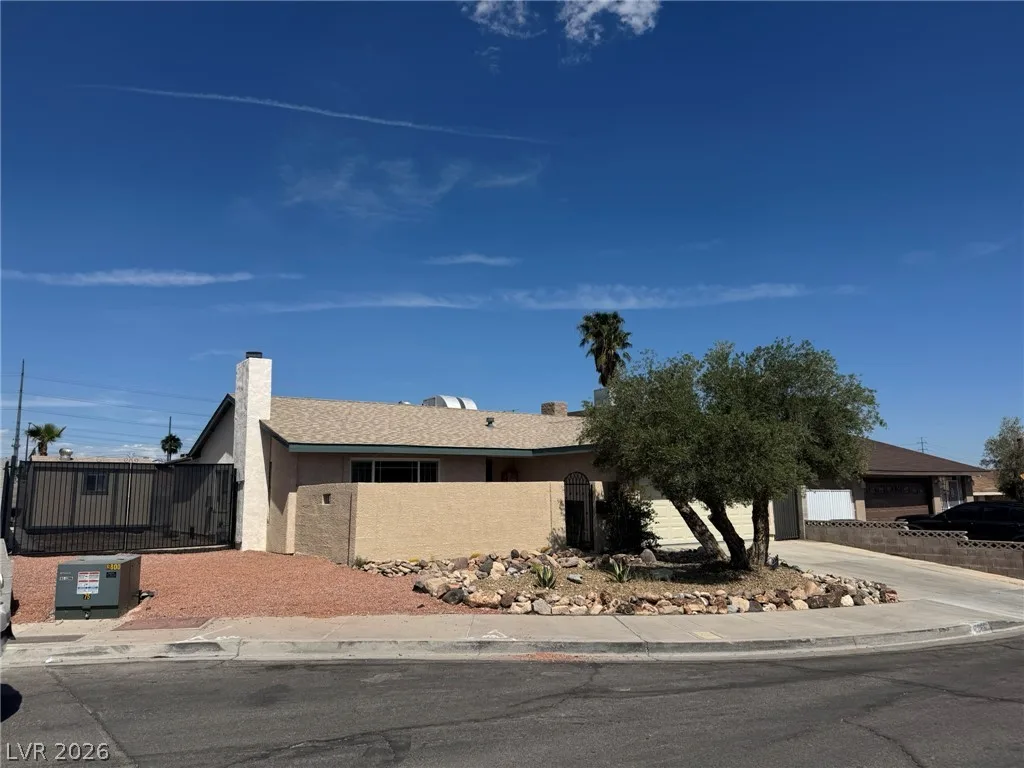
7066 Pinebrook CourtActive
$429,0003 bd2 ba1,202 sqft$357/sqft0.52 mi3 days
$391,0003 bd2 ba1,202 sqft$325/sqft0.57 mi38 daysSold 2026-05-13
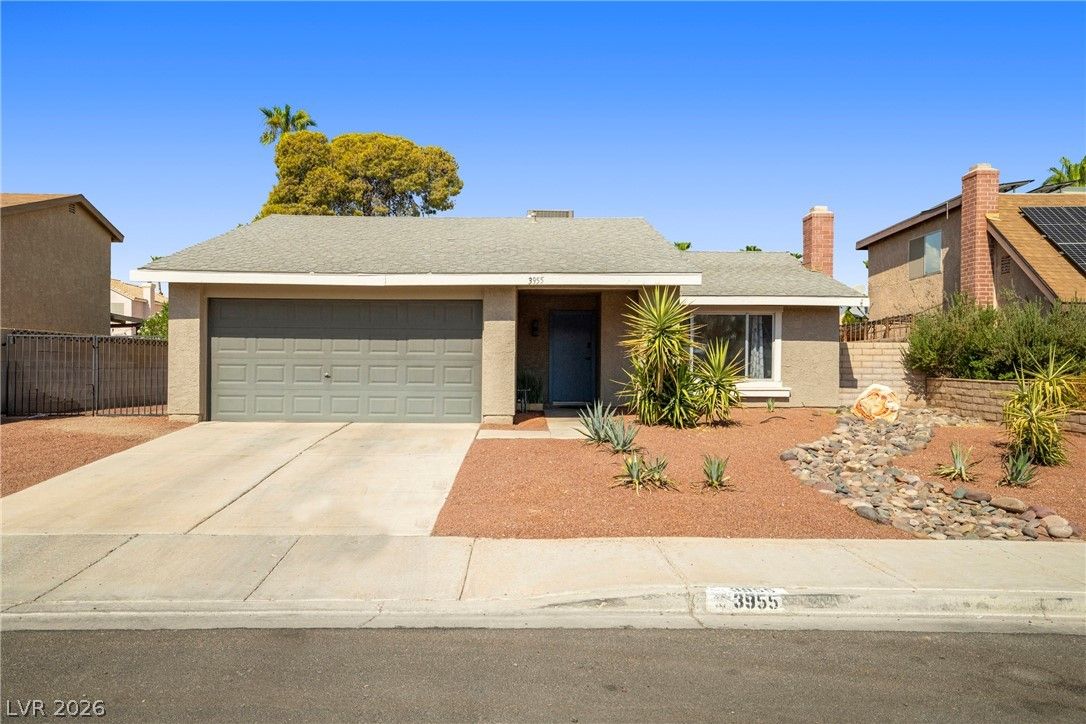
$415,0003 bd2 ba1,202 sqft$345/sqft0.65 mi5 daysSold 2026-09-24
$380,0003 bd2 ba1,202 sqft$316/sqft0.70 mi11 daysSold 2026-07-14
$382,0003 bd2 ba1,159 sqft$330/sqft0.76 mi6 daysSold 2026-06-08
$430,0003 bd2 ba1,202 sqft$358/sqft0.80 mi13 daysSold 2026-07-02
Nearest comparable sales and listings
12 comparables · median price $413,750 · range $375,000 – $430,000 · median $/sq ft $341 · average $/sq ft $343
| Address | Status | Price | $/Sq Ft | Bd / Ba | Sq Ft | Sold / market time | Distance |
|---|---|---|---|---|---|---|---|
| 7109 Topeka Drive | Sold | $375,000 | $402 | 2 / 2 | 932 | Sold 2026-07-24 | 0.35 mi |
| 4194 Greenpoint Street | Active | $425,000 | $354 | 3 / 2 | 1,202 | 14 days on market | 0.36 mi |
| 7112 Fenway Avenue | Active | $412,500 | $343 | 3 / 2 | 1,202 | 25 days on market | 0.43 mi |
| 4347 Apex Drive | Sold | $415,000 | $319 | 3 / 2 | 1,300 | Sold 2026-05-15 | 0.43 mi |
| 7066 Pinebrook Court | Active | $429,000 | $357 | 3 / 2 | 1,202 | 3 days on market | 0.52 mi |
| 7057 Clearwater Avenue | Sold | $391,000 | $325 | 3 / 2 | 1,202 | Sold 2026-05-13 | 0.57 mi |
| 3955 Belhaven Street | Sold | $415,000 | $345 | 3 / 2 | 1,202 | Sold 2026-09-24 | 0.65 mi |
| 4136 Aspen Street | Sold | $380,000 | $316 | 3 / 2 | 1,202 | Sold 2026-07-14 | 0.70 mi |
| 7885 Geyser Hill Lane | Sold | $382,000 | $330 | 3 / 2 | 1,159 | Sold 2026-06-08 | 0.76 mi |
| 3838 Silent Hill Drive | Sold | $430,000 | $358 | 3 / 2 | 1,202 | Sold 2026-07-02 | 0.80 mi |
| 6841 Calella Drive | Sold | $385,000 | $339 | 2 / 2 | 1,135 | Sold 2026-05-22 | 0.92 mi |
| 7128 Montcliff Avenue | Sold | $416,000 | $325 | 3 / 2 | 1,280 | Sold 2026-08-25 | 0.95 mi |


