
Comparable Sales Near 11208 Dell Cliffs Court, Las Vegas, NV 89144
1st Realty · Comparable sales report · 1st.estate · October 20, 2026
Browse our Las Vegas area guides →
11208 Dell Cliffs Court, Las Vegas, NV 89144
Status: Sold
$790,000 Sold Price
$328
$ / Sq Ft
2,410
Living Area
6,970 sqft
Lot Size
4
Beds
2
Baths
2000
Year Built
Search Parameters
Property Type
Status
Radius
Sold Within
Beds
Baths
Living Area (Sq Ft)
Lot Size (Sq Ft)
This comp search reflects your current search parameters — adjust the filters above as needed for a more accurate estimate.
Estimated Value
—
Average $/Sqft
—
Check one or more comps below to calculate an estimate.
Nearest 10 of 44 comparable sales and listings within 1 mile of this home. Use the filters above and press Search to refine.
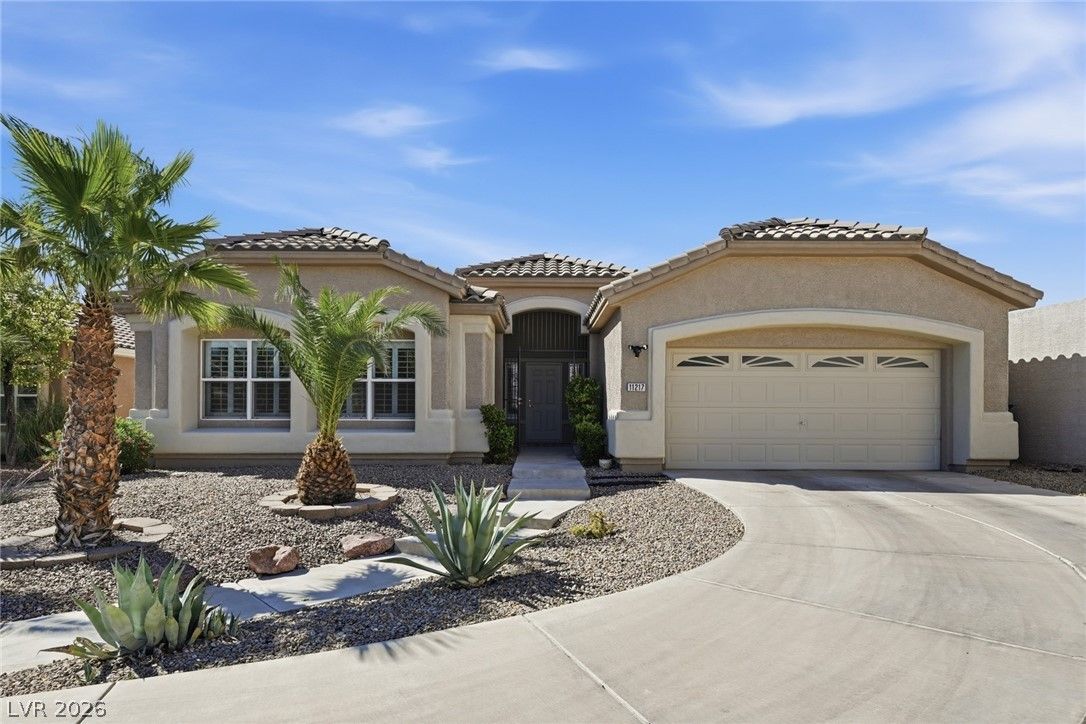
$640,0003 bd3 ba2,304 sqft$278/sqft0.17 mi77 daysSold 2026-09-01
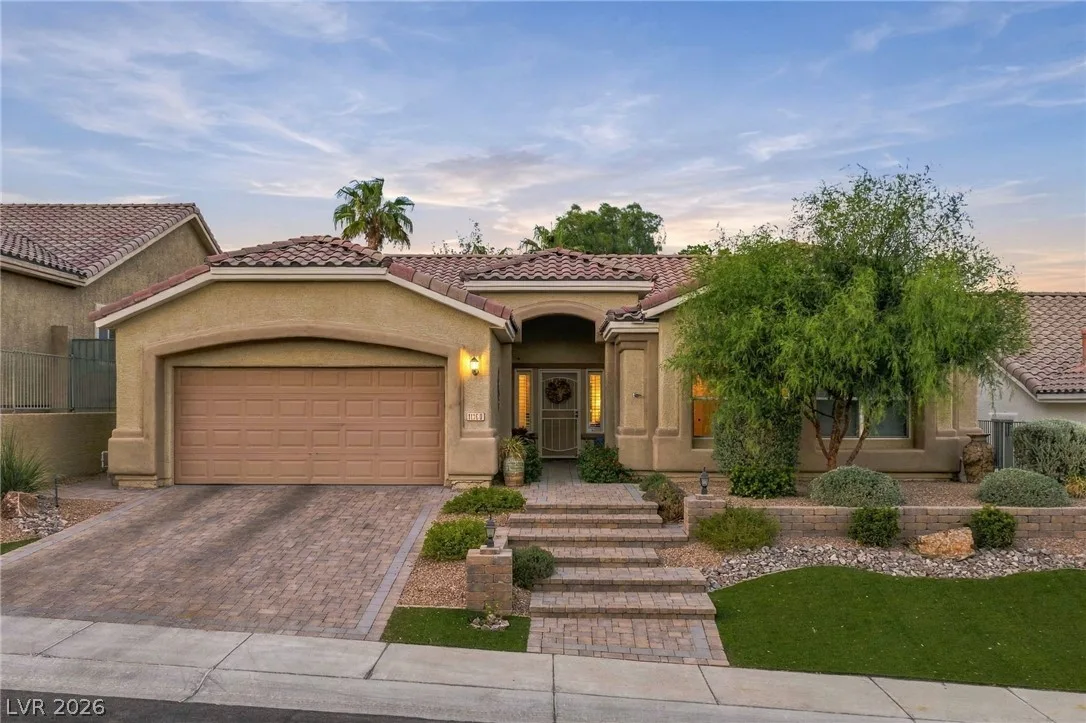
11160 Shadow Nook CourtActive
$760,0005 bd3 ba2,441 sqft$311/sqft0.19 mi16 days
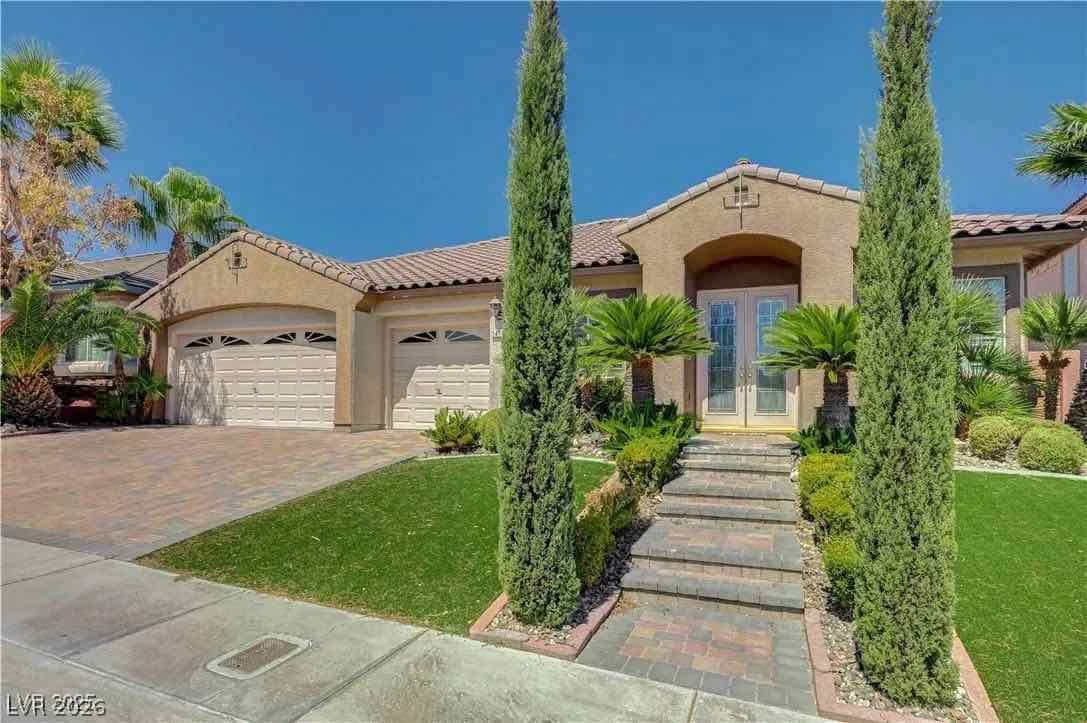
$773,0003 bd3 ba2,615 sqft$296/sqft0.25 mi2 daysSold 2026-10-02
1612 Cider CourtSold
$630,0003 bd3 ba2,067 sqft$305/sqft0.33 mi16 daysSold 2026-06-02
$686,8004 bd2 ba2,215 sqft$310/sqft0.38 mi51 daysSold 2026-07-08
$1,010,0003 bd3 ba2,016 sqft$501/sqft0.50 mi43 daysSold 2026-07-08
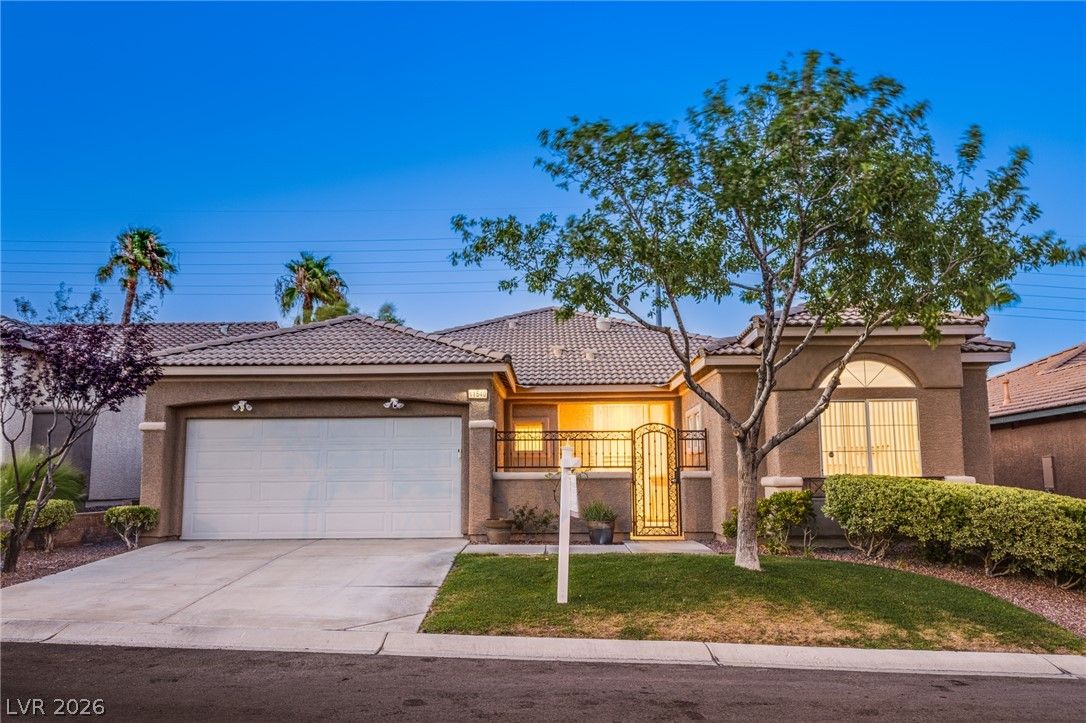
$725,0004 bd3 ba2,500 sqft$290/sqft0.52 mi38 days
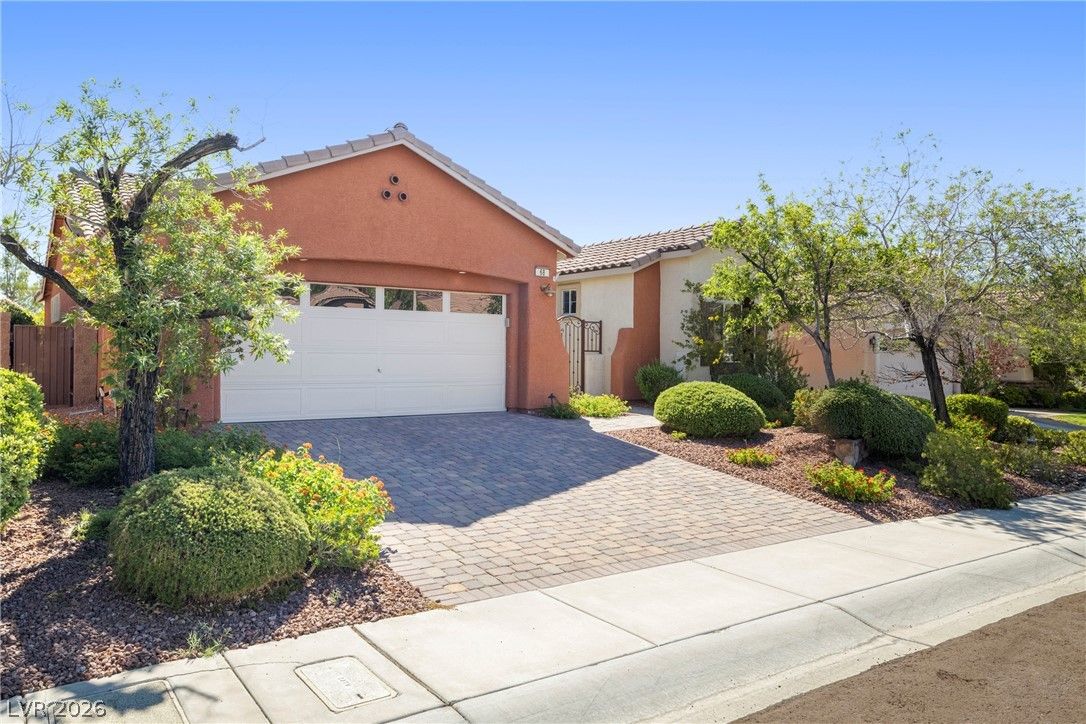
68 Alerion StreetActive
$749,9003 bd2 ba2,176 sqft$345/sqft0.56 mi0 days
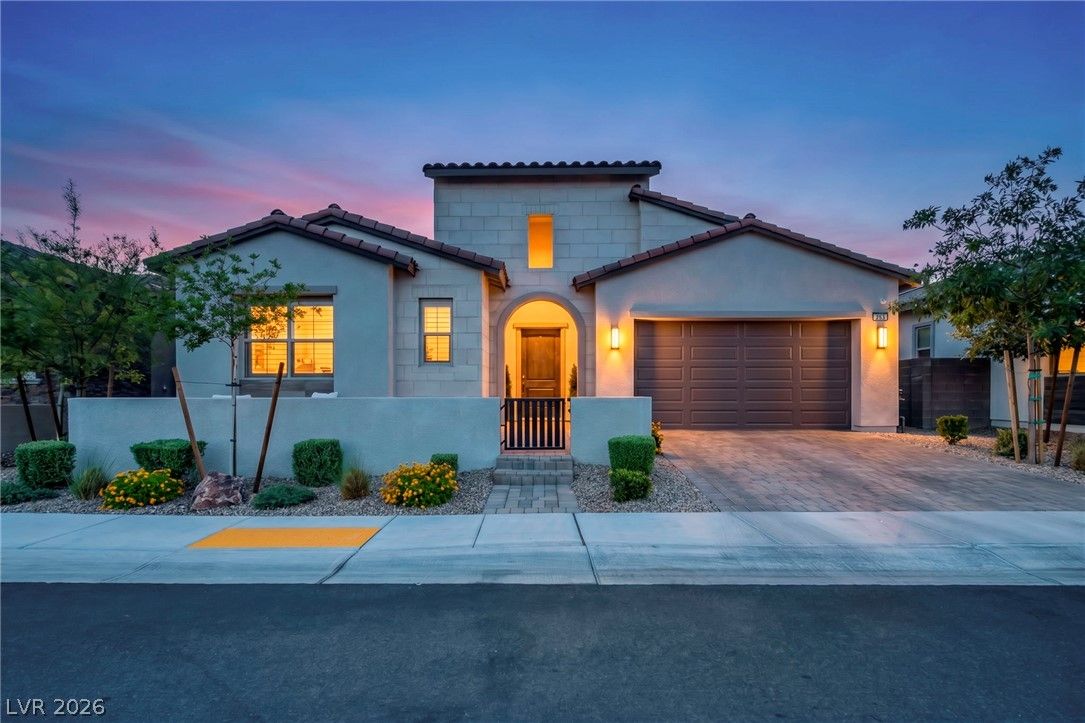
$998,0003 bd3 ba2,016 sqft$495/sqft0.59 mi73 daysSold 2026-09-28
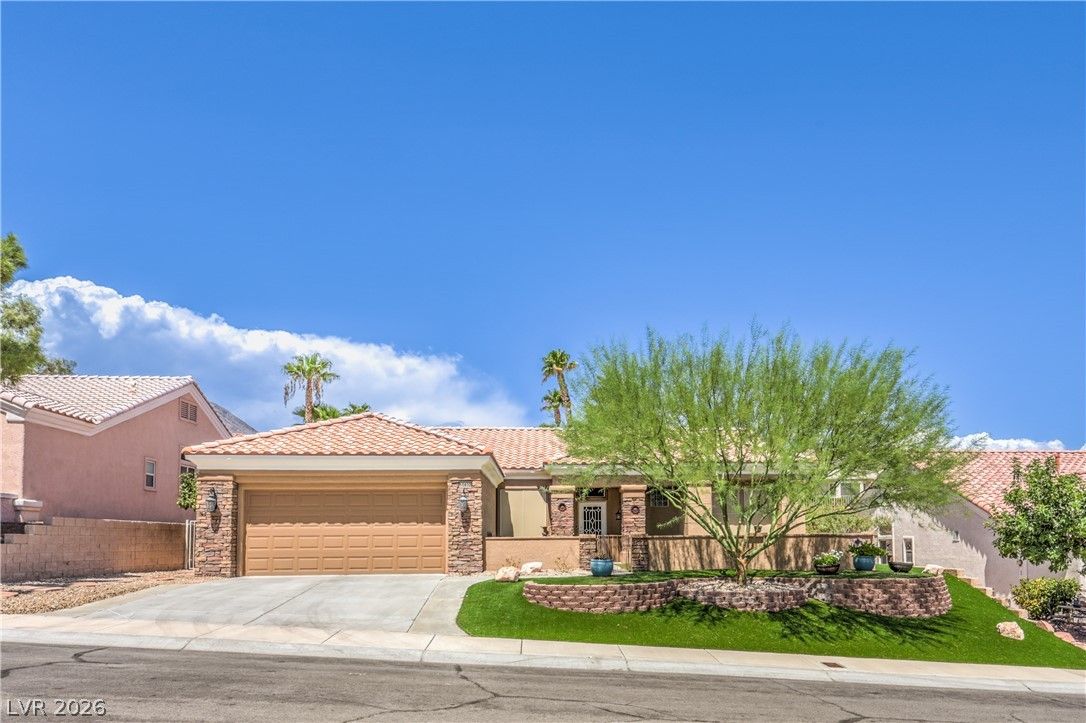
10832 Clarion LaneActive
$580,0003 bd2 ba2,118 sqft$274/sqft0.66 mi10 days
Nearest comparable sales and listings
12 comparables · median price $737,450 · range $580,000 – $1,020,000 · median $/sq ft $311 · average $/sq ft $340
| Address | Status | Price | $/Sq Ft | Bd / Ba | Sq Ft | Sold / market time | Distance |
|---|---|---|---|---|---|---|---|
| 11217 Pergola Point Court | Sold | $640,000 | $278 | 3 / 3 | 2,304 | Sold 2026-09-01 | 0.17 mi |
| 11160 Shadow Nook Court | Active | $760,000 | $311 | 5 / 3 | 2,441 | 16 days on market | 0.19 mi |
| 1413 Pine Leaf Drive | Sold | $773,000 | $296 | 3 / 3 | 2,615 | Sold 2026-10-02 | 0.25 mi |
| 1612 Cider Court | Sold | $630,000 | $305 | 3 / 3 | 2,067 | Sold 2026-06-02 | 0.33 mi |
| 801 White Falcon Street | Sold | $686,800 | $310 | 4 / 2 | 2,215 | Sold 2026-07-08 | 0.38 mi |
| 407 Gandara Street | Sold | $1,010,000 | $501 | 3 / 3 | 2,016 | Sold 2026-07-08 | 0.50 mi |
| 11540 Cannon Falls Avenue | Active | $725,000 | $290 | 4 / 3 | 2,500 | 38 days on market | 0.52 mi |
| 68 Alerion Street | Active | $749,900 | $345 | 3 / 2 | 2,176 | 0 days on market | 0.56 mi |
| 253 Robledo Street | Sold | $998,000 | $495 | 3 / 3 | 2,016 | Sold 2026-09-28 | 0.59 mi |
| 10832 Clarion Lane | Active | $580,000 | $274 | 3 / 2 | 2,118 | 10 days on market | 0.66 mi |
| 10824 Windrose Point Avenue | Sold | $619,000 | $312 | 3 / 2 | 1,981 | Sold 2026-06-15 | 0.67 mi |
| 204 Popolo Drive | Under Contract | $1,020,000 | $360 | 4 / 3 | 2,835 | 76 days on market | 0.68 mi |


