
Comparable Sales Near 711 Sugarcane Court, Henderson, NV 89002
1st Realty · Comparable sales report · 1st.estate · October 20, 2026
Read the Henderson area guide →
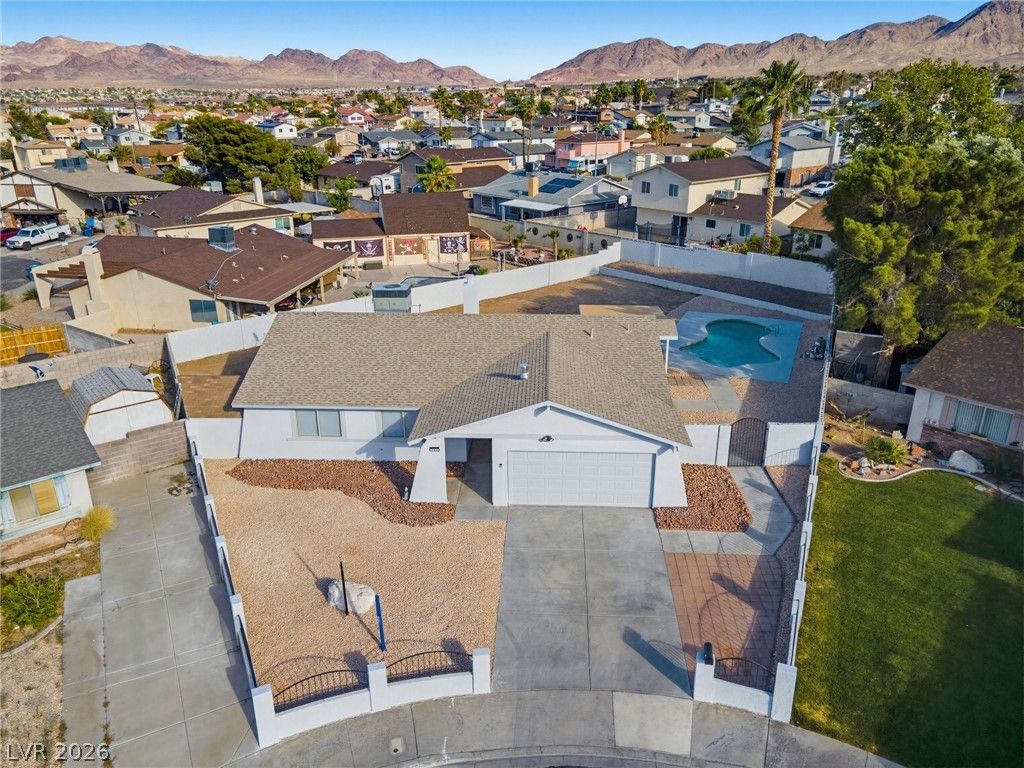
711 Sugarcane Court, Henderson, NV 89002
Status: Sold
$460,000 Sold Price
$325
$ / Sq Ft
1,416
Living Area
10,454 sqft
Lot Size
3
Beds
2
Baths
1981
Year Built
Search Parameters
Property Type
Status
Radius
Sold Within
Beds
Baths
Living Area (Sq Ft)
Lot Size (Sq Ft)
This comp search reflects your current search parameters — adjust the filters above as needed for a more accurate estimate.
Estimated Value
—
Average $/Sqft
—
Check one or more comps below to calculate an estimate.
Nearest 10 of 11 comparable sales and listings within 1 mile of this home. Use the filters above and press Search to refine.
$399,0003 bd2 ba1,615 sqft$247/sqft0.10 mi10 daysSold 2026-05-08
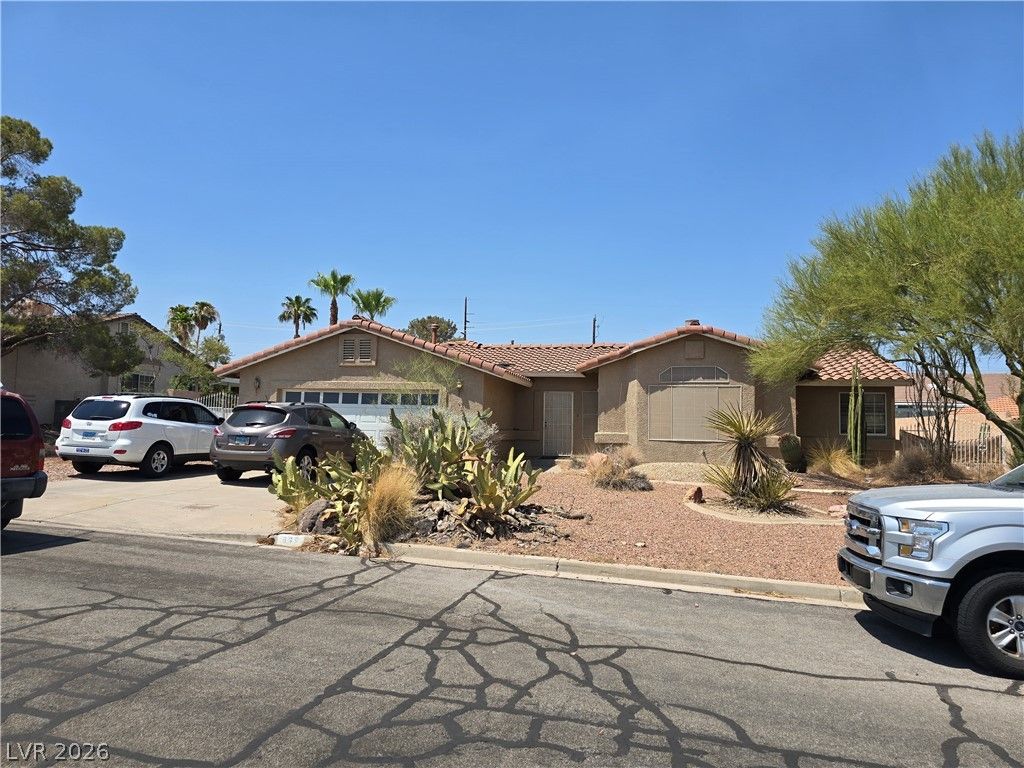
569 Truffles StreetPending
$389,9994 bd2 ba1,754 sqft$222/sqft0.54 mi29 days
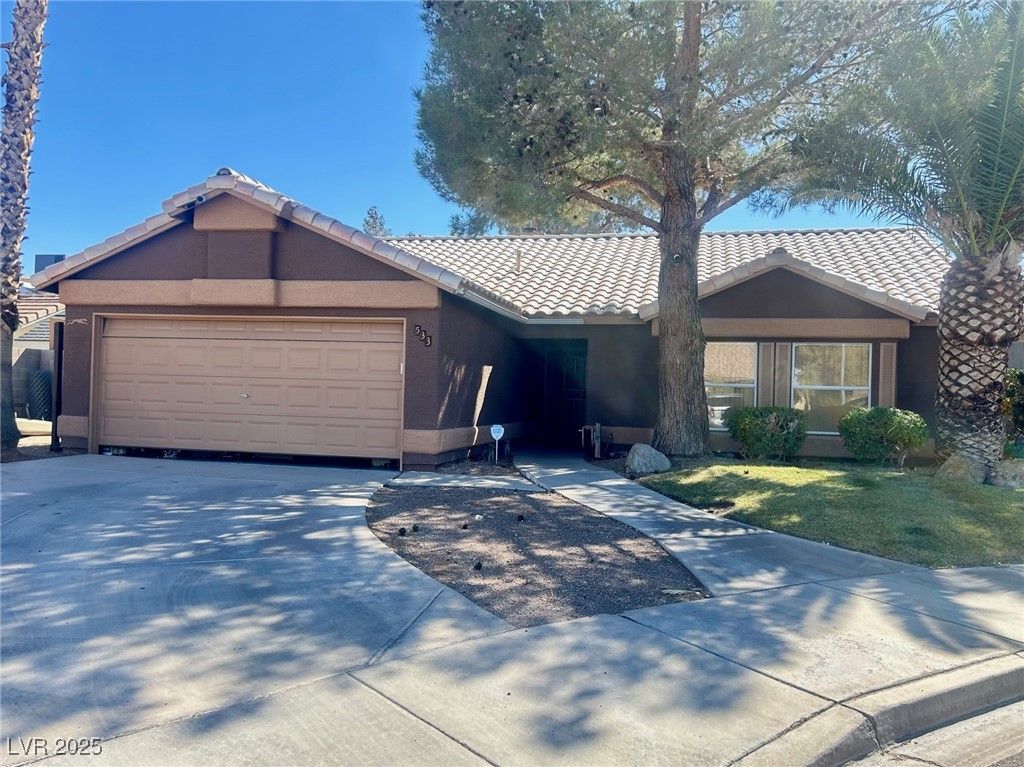
533 Calypso DriveActive
$445,9504 bd2 ba1,292 sqft$345/sqft0.59 mi258 days

434 Scenic DrivePending
$399,0003 bd2 ba1,430 sqft$279/sqft0.65 mi35 days
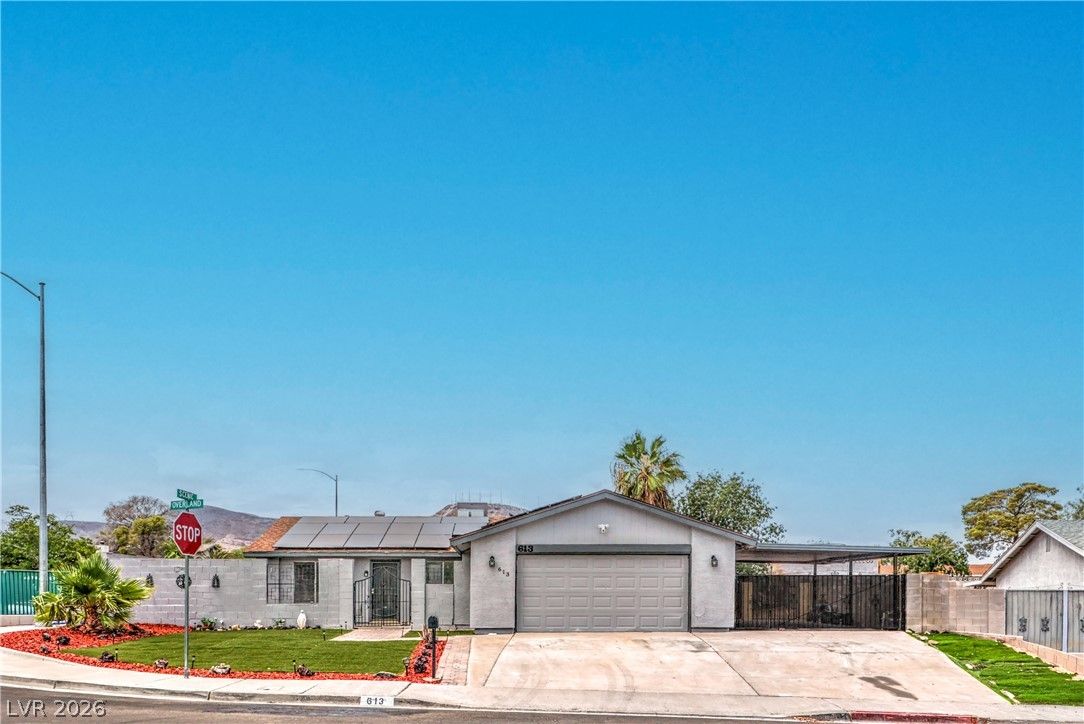
613 Overland DrivePending
$395,0004 bd2 ba1,528 sqft$259/sqft0.65 mi82 days
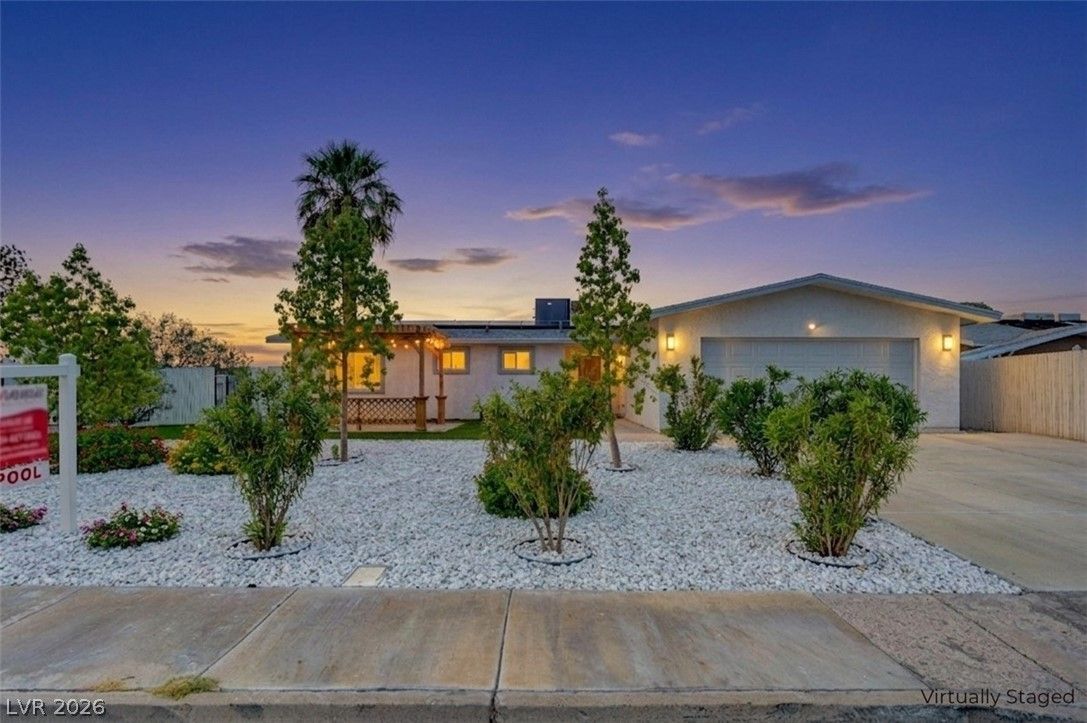
431 Scenic DriveSold
$490,0004 bd2 ba1,611 sqft$304/sqft0.68 mi6 daysSold 2026-09-18
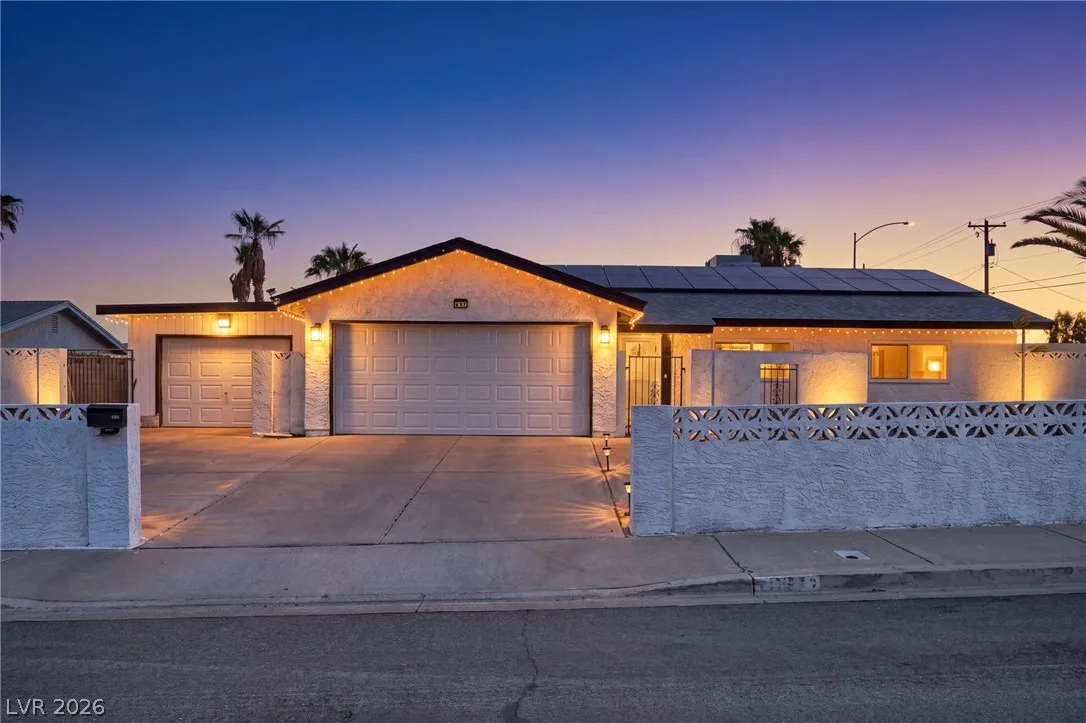
637 Apollo AvenueActive
$515,0003 bd2 ba1,650 sqft$312/sqft0.80 mi0 days
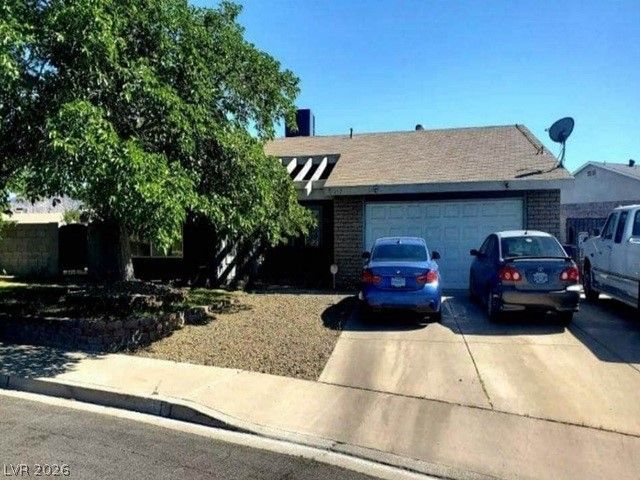
$270,0004 bd2 ba1,497 sqft$180/sqft0.94 mi52 daysSold 2026-08-27
$600,0003 bd2 ba1,749 sqft$343/sqft0.96 mi0 daysSold 2026-05-29
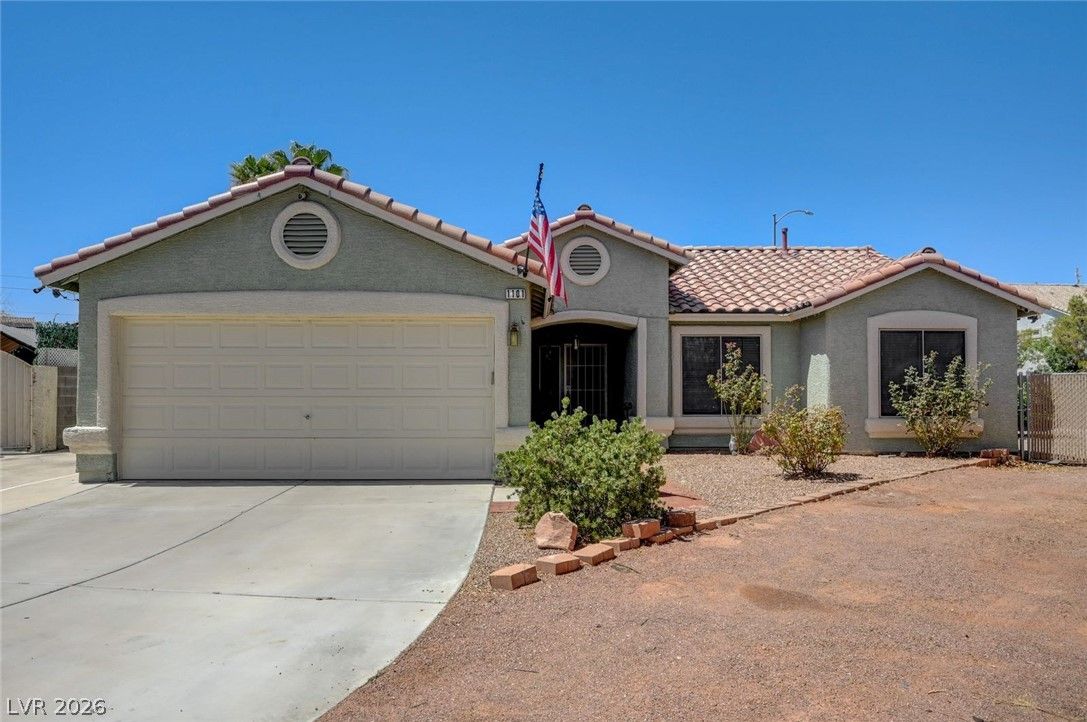
1101 Hutch CourtSold
$455,0003 bd2 ba1,250 sqft$364/sqft0.96 mi2 daysSold 2026-08-07
Nearest comparable sales and listings
11 comparables · median price $439,500 · range $270,000 – $600,000 · median $/sq ft $279 · average $/sq ft $284
| Address | Status | Price | $/Sq Ft | Bd / Ba | Sq Ft | Sold / market time | Distance |
|---|---|---|---|---|---|---|---|
| 706 Morrocco Drive | Sold | $399,000 | $247 | 3 / 2 | 1,615 | Sold 2026-05-08 | 0.10 mi |
| 569 Truffles Street | Pending | $389,999 | $222 | 4 / 2 | 1,754 | 29 days on market | 0.54 mi |
| 533 Calypso Drive | Active | $445,950 | $345 | 4 / 2 | 1,292 | 258 days on market | 0.59 mi |
| 434 Scenic Drive | Pending | $399,000 | $279 | 3 / 2 | 1,430 | 35 days on market | 0.65 mi |
| 613 Overland Drive | Pending | $395,000 | $259 | 4 / 2 | 1,528 | 82 days on market | 0.65 mi |
| 431 Scenic Drive | Sold | $490,000 | $304 | 4 / 2 | 1,611 | Sold 2026-09-18 | 0.68 mi |
| 637 Apollo Avenue | Active | $515,000 | $312 | 3 / 2 | 1,650 | 0 days on market | 0.80 mi |
| 632 Severn Street | Sold | $270,000 | $180 | 4 / 2 | 1,497 | Sold 2026-08-27 | 0.94 mi |
| 932 San Bruno Avenue | Sold | $600,000 | $343 | 3 / 2 | 1,749 | Sold 2026-05-29 | 0.96 mi |
| 1101 Hutch Court | Sold | $455,000 | $364 | 3 / 2 | 1,250 | Sold 2026-08-07 | 0.96 mi |
| 970 Hunters Run Drive | Active | $439,500 | $263 | 3 / 2 | 1,668 | 4 days on market | 1.00 mi |


