
Comparable Sales Near 228 Windsong Drive, Henderson, NV 89074
1st Realty · Comparable sales report · 1st.estate · October 20, 2026
Read the Henderson area guide →
228 Windsong Drive, Henderson, NV 89074
Status: Sold
$699,000 Sold Price
$209
$ / Sq Ft
3,352
Living Area
8,712 sqft
Lot Size
5
Beds
4
Baths
1990
Year Built
Search Parameters
Property Type
Status
Radius
Sold Within
Beds
Baths
Living Area (Sq Ft)
Lot Size (Sq Ft)
This comp search reflects your current search parameters — adjust the filters above as needed for a more accurate estimate.
Estimated Value
—
Average $/Sqft
—
Check one or more comps below to calculate an estimate.
Nearest 10 of 28 comparable sales and listings within 1 mile of this home. Use the filters above and press Search to refine.
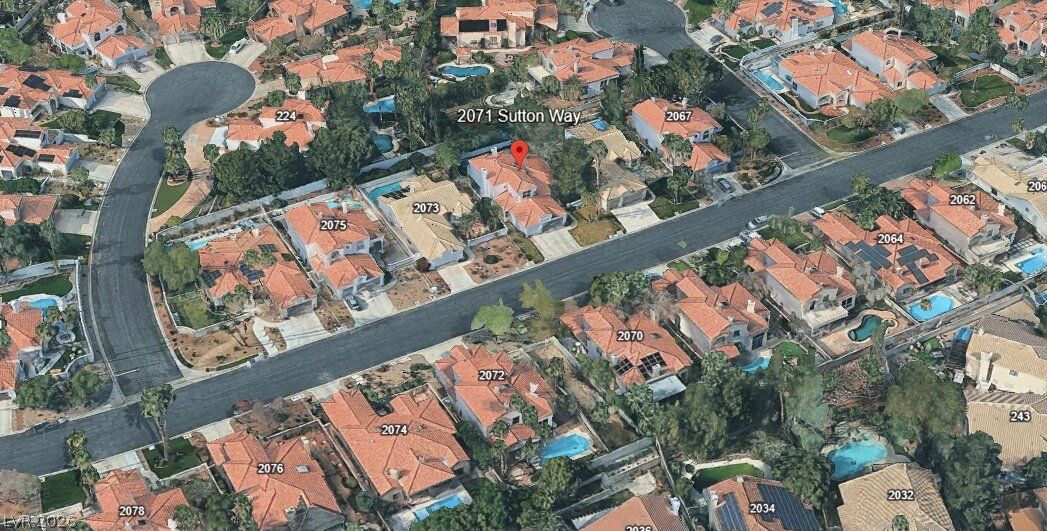
2071 Sutton WayActive
$750,0004 bd4 ba2,896 sqft$259/sqft0.09 mi61 days
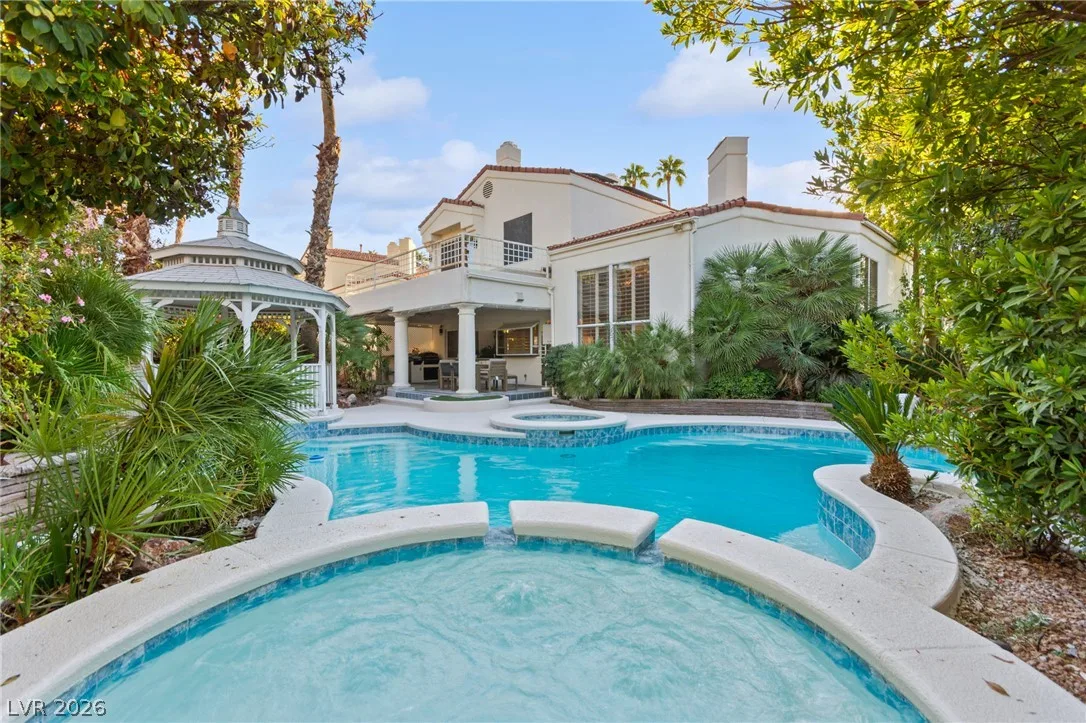
246 Windsong DriveActive
$989,9004 bd4 ba3,352 sqft$295/sqft0.12 mi0 days
$740,0004 bd3 ba2,920 sqft$253/sqft0.18 mi35 daysSold 2026-04-29
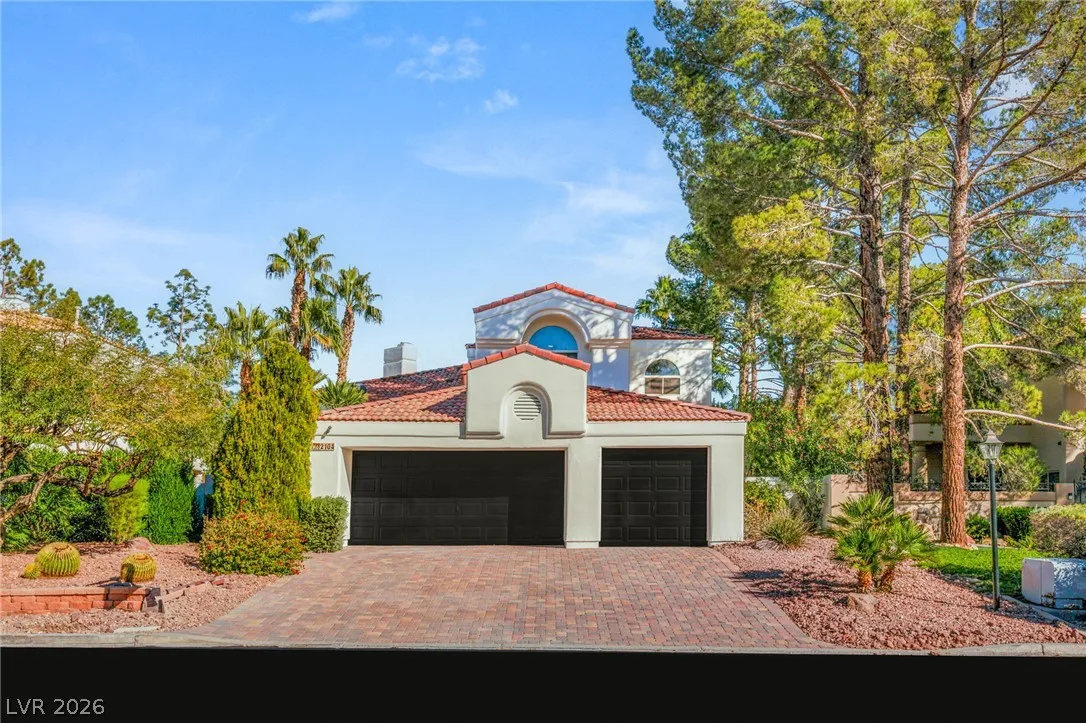
2104 Inverness DriveActive
$99,9994 bd4 ba3,096 sqft$32/sqft0.19 mi0 days
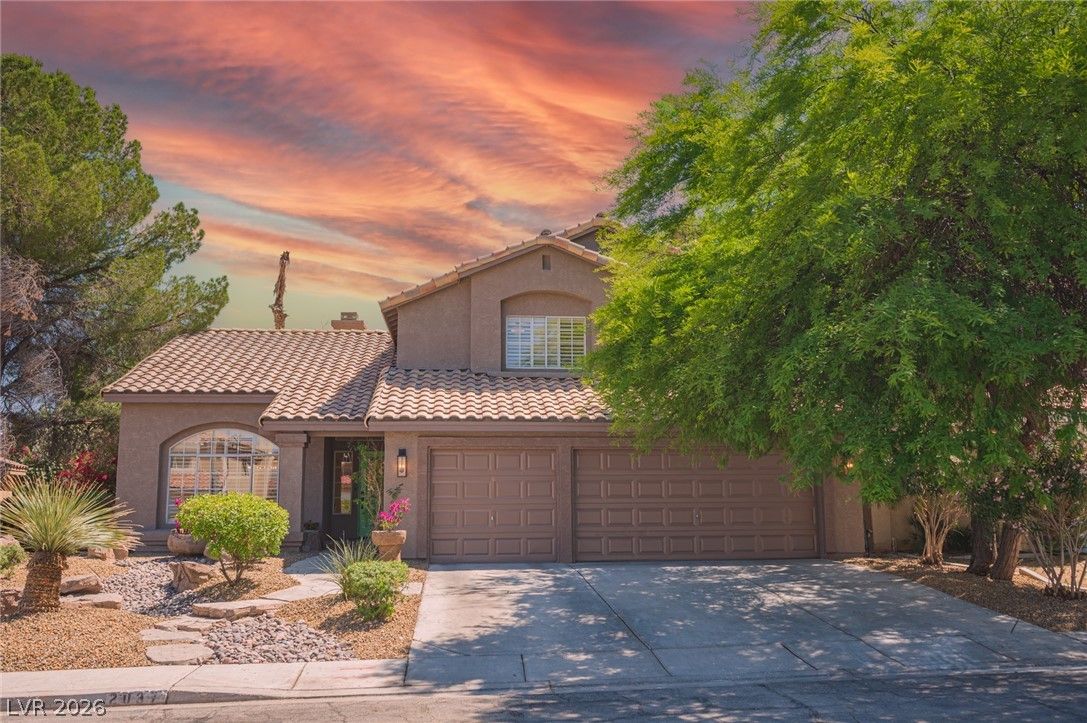
$675,0004 bd3 ba2,576 sqft$262/sqft0.22 mi35 daysSold 2026-08-13
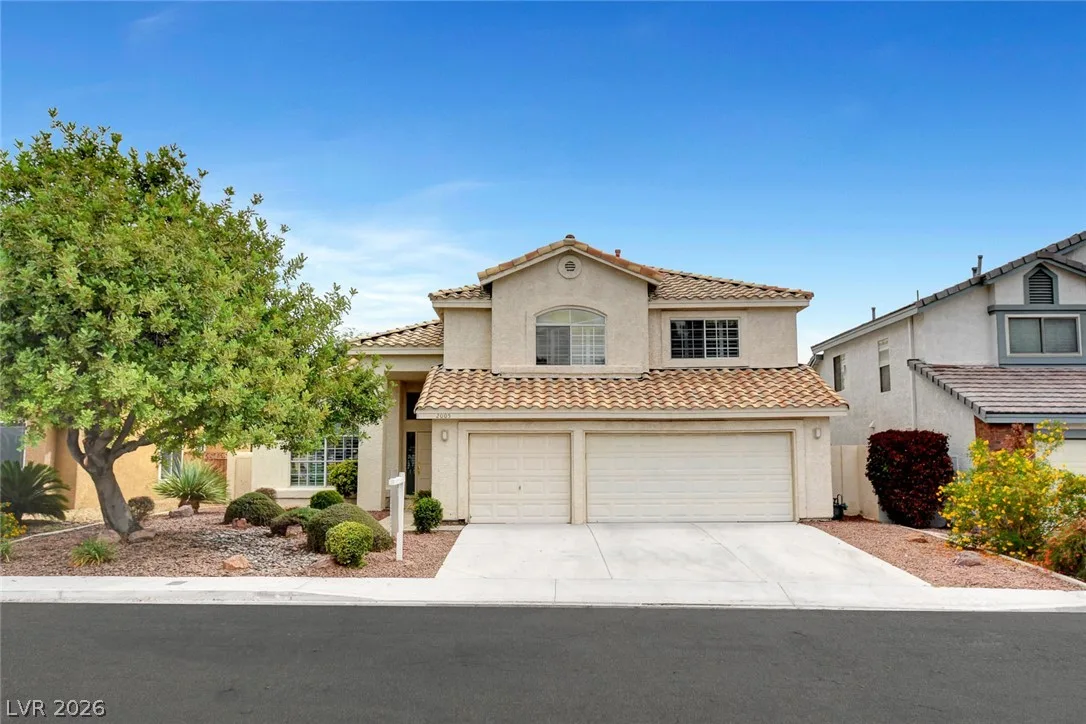
$720,0005 bd3 ba2,976 sqft$242/sqft0.32 mi1 days
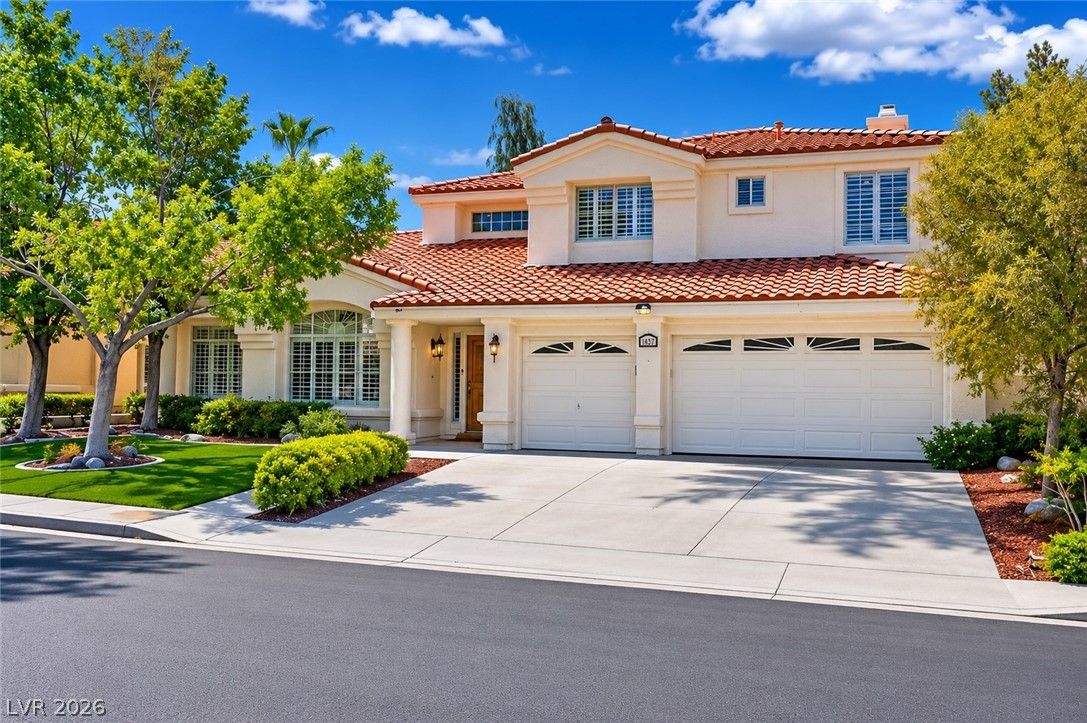
197 Webster WayActive
$799,9955 bd4 ba3,474 sqft$230/sqft0.53 mi67 days
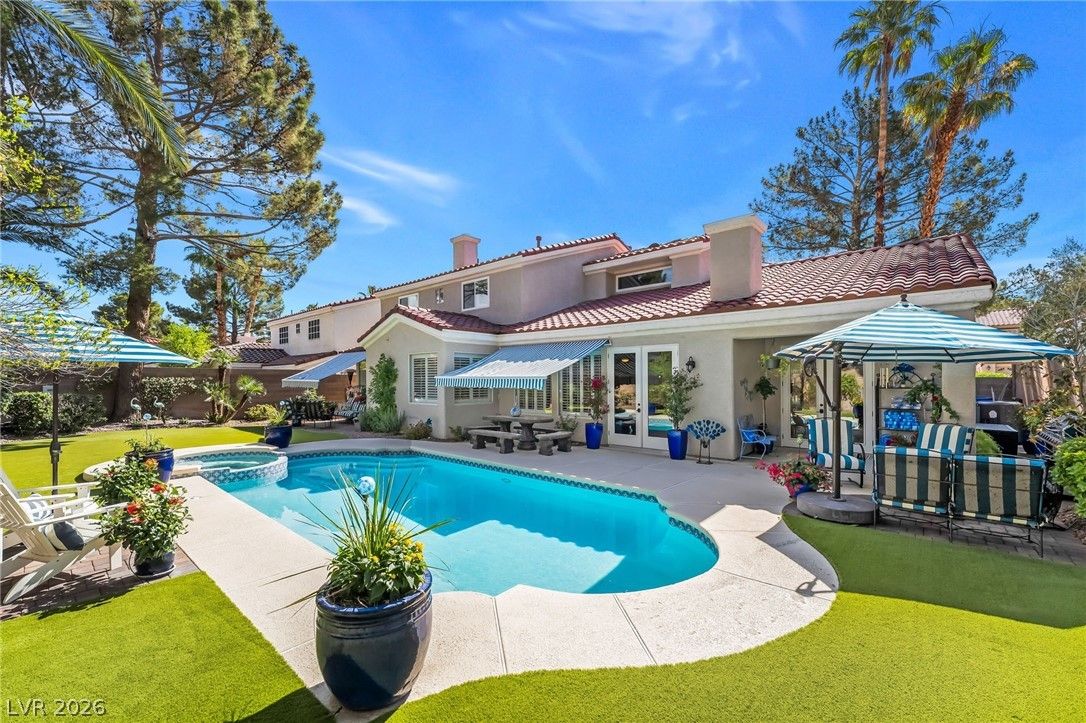
$985,0004 bd4 ba3,474 sqft$284/sqft0.58 mi59 daysSold 2026-08-31
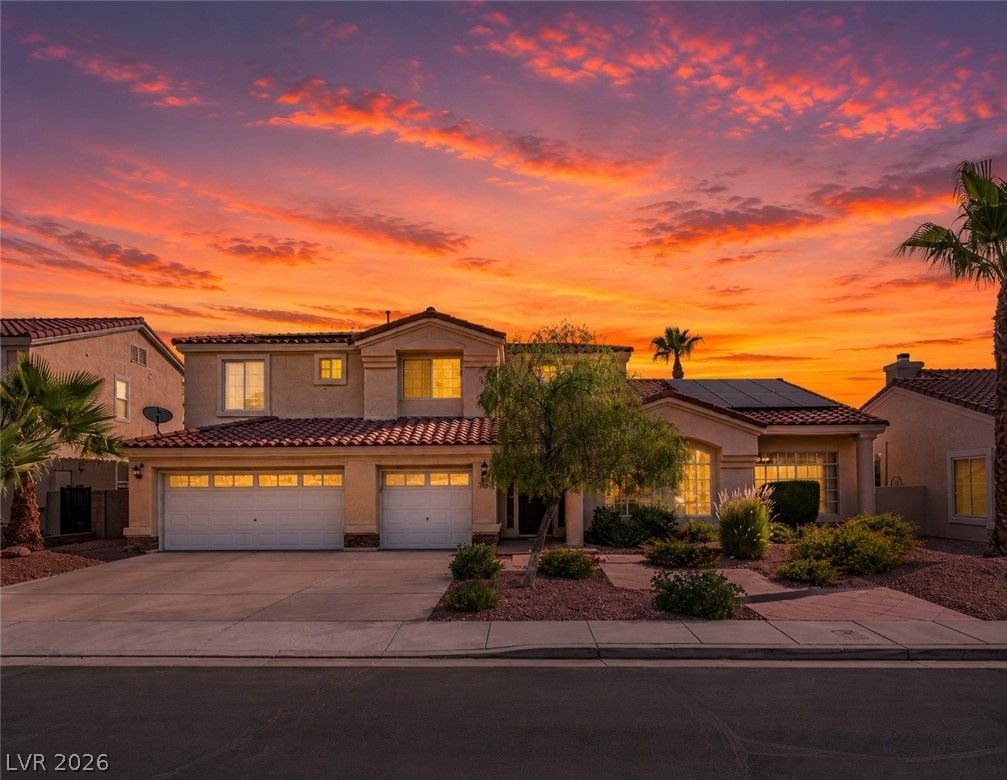
$753,0004 bd4 ba3,474 sqft$217/sqft0.60 mi45 daysSold 2026-10-15
$925,0004 bd4 ba3,474 sqft$266/sqft0.66 mi13 daysSold 2026-06-01
Nearest comparable sales and listings
12 comparables · median price $764,000 · range $99,999 – $989,900 · median $/sq ft $259 · average $/sq ft $239
| Address | Status | Price | $/Sq Ft | Bd / Ba | Sq Ft | Sold / market time | Distance |
|---|---|---|---|---|---|---|---|
| 2071 Sutton Way | Active | $750,000 | $259 | 4 / 4 | 2,896 | 61 days on market | 0.09 mi |
| 246 Windsong Drive | Active | $989,900 | $295 | 4 / 4 | 3,352 | 0 days on market | 0.12 mi |
| 2108 Inverness Drive | Sold | $740,000 | $253 | 4 / 3 | 2,920 | Sold 2026-04-29 | 0.18 mi |
| 2104 Inverness Drive | Active | $99,999 | $32 | 4 / 4 | 3,096 | 0 days on market | 0.19 mi |
| 2037 Pinion Springs Drive | Sold | $675,000 | $262 | 4 / 3 | 2,576 | Sold 2026-08-13 | 0.22 mi |
| 2005 Pinion Springs Drive | Active | $720,000 | $242 | 5 / 3 | 2,976 | 1 days on market | 0.32 mi |
| 197 Webster Way | Active | $799,995 | $230 | 5 / 4 | 3,474 | 67 days on market | 0.53 mi |
| 189 Camrose Street | Sold | $985,000 | $284 | 4 / 4 | 3,474 | Sold 2026-08-31 | 0.58 mi |
| 2010 Catalina Marie Avenue | Sold | $753,000 | $217 | 4 / 4 | 3,474 | Sold 2026-10-15 | 0.60 mi |
| 188 Bethany Street | Sold | $925,000 | $266 | 4 / 4 | 3,474 | Sold 2026-06-01 | 0.66 mi |
| 214 Ultra Drive | Sold | $775,000 | $260 | 4 / 3 | 2,985 | Sold 2026-09-04 | 0.67 mi |
| 2017 Grafton Avenue | Active | $919,000 | $265 | 5 / 4 | 3,474 | 42 days on market | 0.68 mi |


