
Comparable Sales Near 7131 Hedgemaple Court, Las Vegas, NV 89148
1st Realty · Comparable sales report · 1st.estate · October 20, 2026
Read the Rhodes Ranch neighborhood guide →
7131 Hedgemaple Court, Las Vegas, NV 89148
Status: Sold
$365,000 Sold Price
$218
$ / Sq Ft
1,677
Living Area
3,485 sqft
Lot Size
2
Beds
3
Baths
2002
Year Built
Search Parameters
Property Type
Status
Radius
Sold Within
Beds
Baths
Living Area (Sq Ft)
Lot Size (Sq Ft)
This comp search reflects your current search parameters — adjust the filters above as needed for a more accurate estimate.
Estimated Value
—
Average $/Sqft
—
Check one or more comps below to calculate an estimate.
Nearest 10 of 52 comparable sales and listings within 1 mile of this home. Use the filters above and press Search to refine.
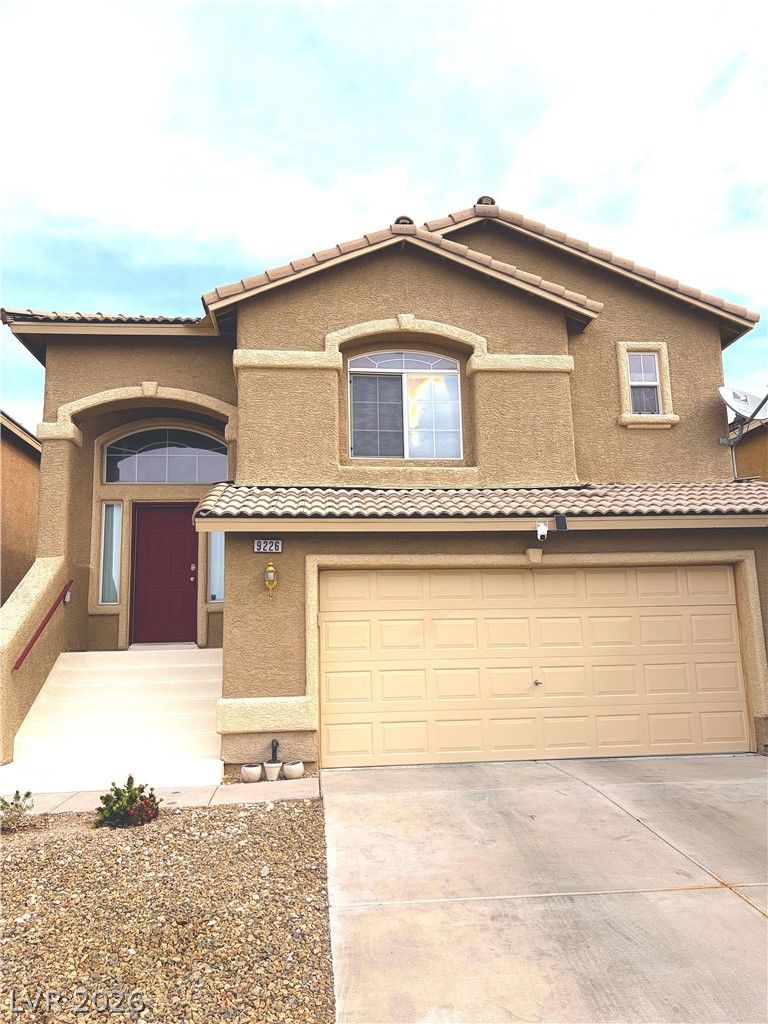
9226 Red Currant AvenueActive
$425,0003 bd3 ba1,677 sqft$253/sqft0.10 mi188 days
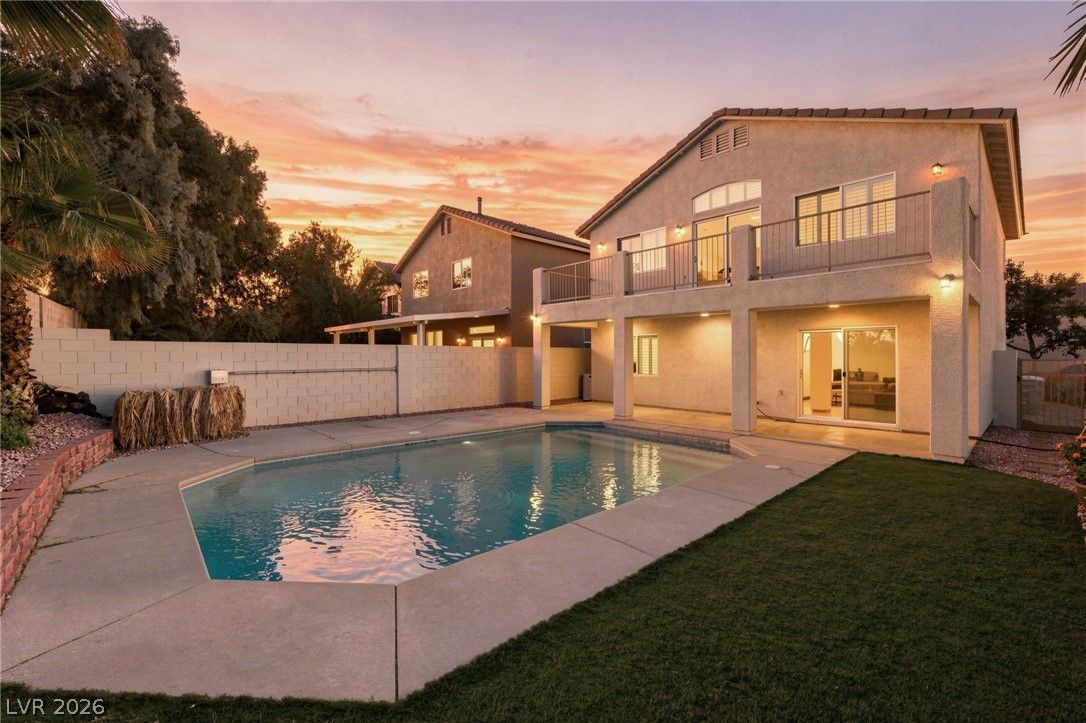
$445,0002 bd3 ba1,677 sqft$265/sqft0.11 mi5 daysSold 2026-10-14
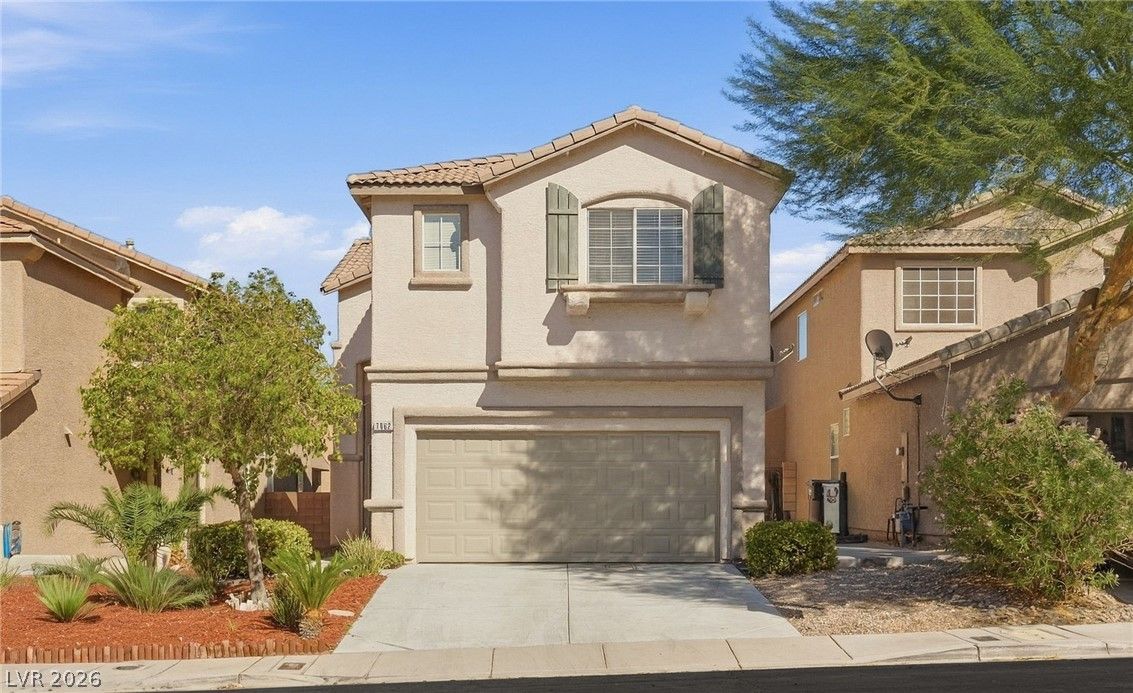
$399,5003 bd3 ba1,568 sqft$255/sqft0.12 mi15 daysSold 2026-10-13
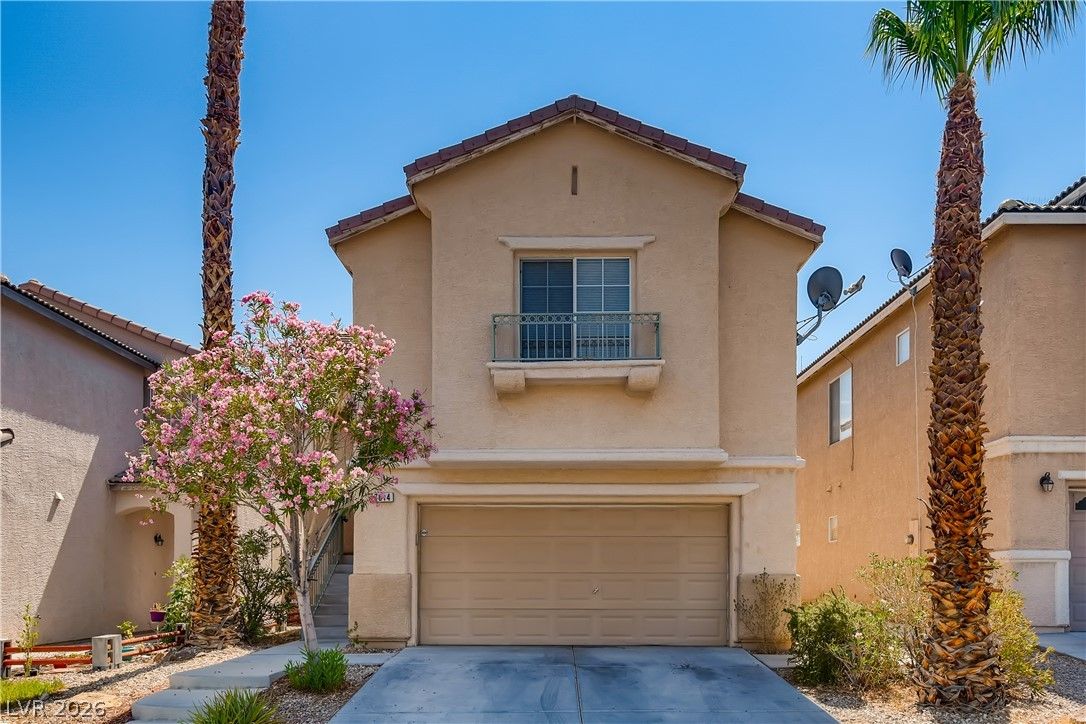
$425,0003 bd3 ba1,770 sqft$240/sqft0.16 mi41 daysSold 2026-10-13
$376,0003 bd3 ba1,398 sqft$269/sqft0.17 mi139 daysSold 2026-06-30
$375,0003 bd3 ba1,358 sqft$276/sqft0.17 mi6 daysSold 2026-06-30
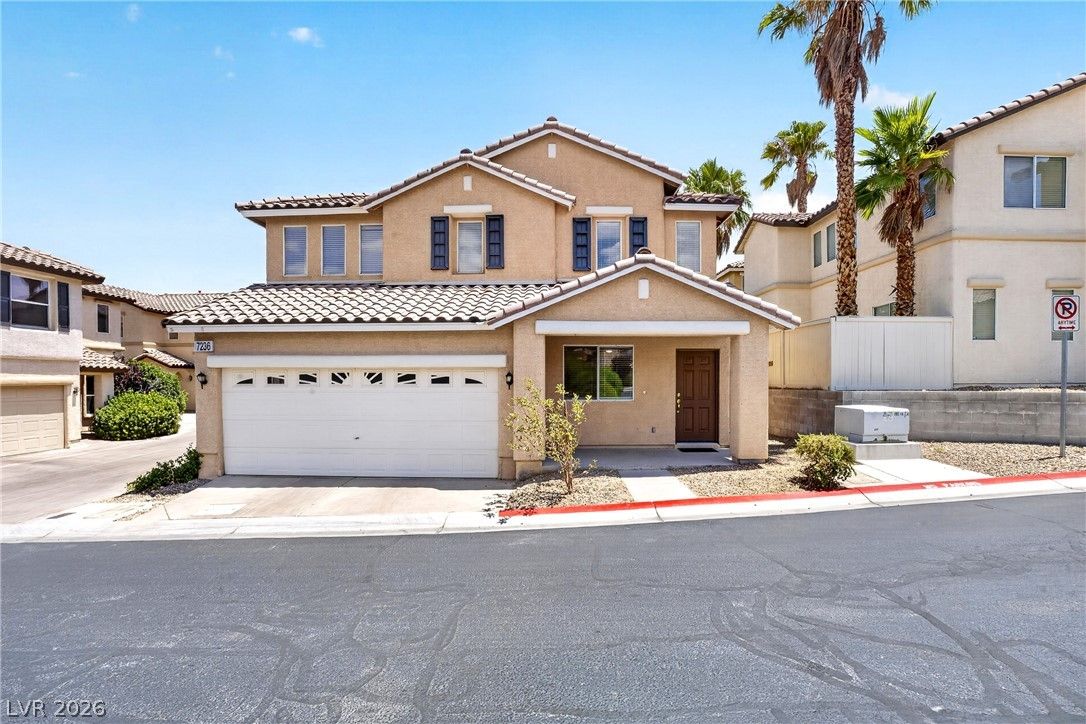
7236 Plushstone StreetActive
$369,0003 bd3 ba1,476 sqft$250/sqft0.19 mi71 days
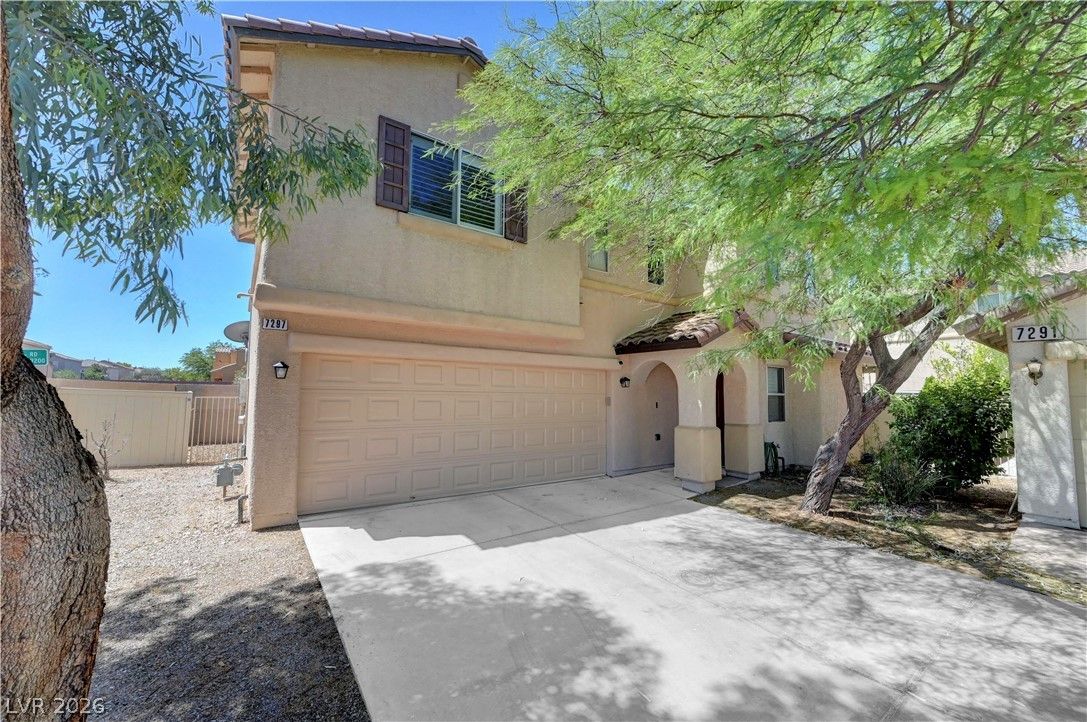
$360,0003 bd3 ba1,398 sqft$258/sqft0.22 mi41 daysSold 2026-08-20
$375,0003 bd3 ba1,421 sqft$264/sqft0.29 mi27 daysSold 2026-07-21
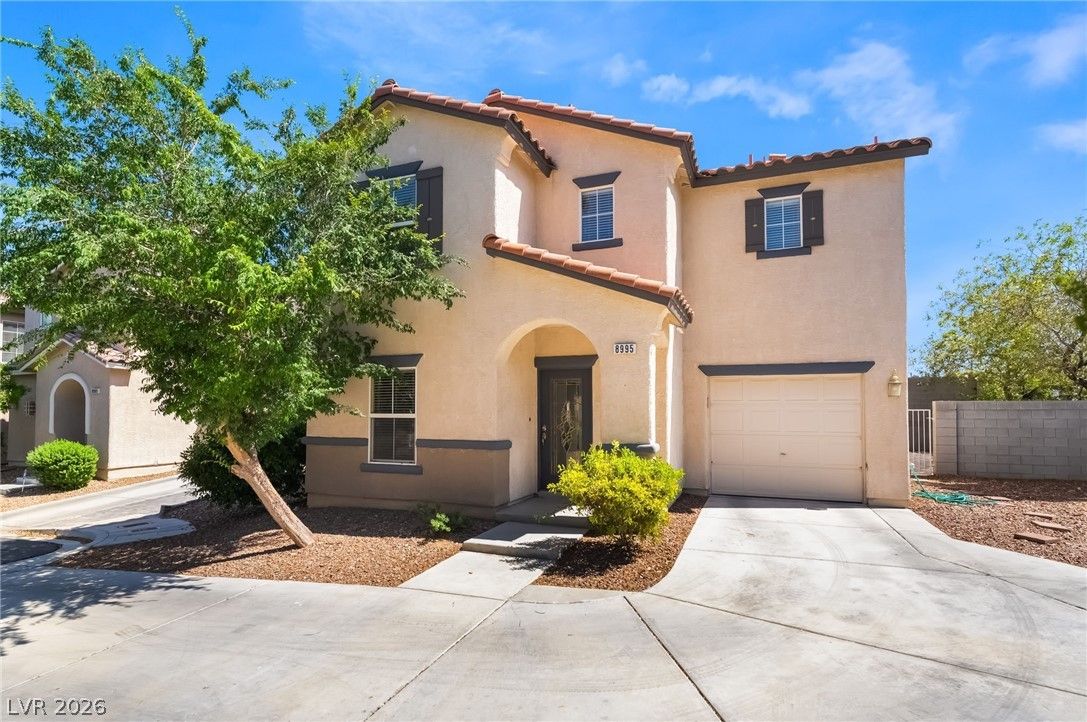
$396,7773 bd3 ba1,732 sqft$229/sqft0.29 mi59 daysSold 2026-08-31
Nearest comparable sales and listings
12 comparables · median price $386,389 · range $352,000 – $445,000 · median $/sq ft $256 · average $/sq ft $260
| Address | Status | Price | $/Sq Ft | Bd / Ba | Sq Ft | Sold / market time | Distance |
|---|---|---|---|---|---|---|---|
| 9226 Red Currant Avenue | Active | $425,000 | $253 | 3 / 3 | 1,677 | 188 days on market | 0.10 mi |
| 9119 Adamshurst Avenue | Sold | $445,000 | $265 | 2 / 3 | 1,677 | Sold 2026-10-14 | 0.11 mi |
| 7062 Salt Marsh Court | Sold | $399,500 | $255 | 3 / 3 | 1,568 | Sold 2026-10-13 | 0.12 mi |
| 7014 Pacific Coast Street | Sold | $425,000 | $240 | 3 / 3 | 1,770 | Sold 2026-10-13 | 0.16 mi |
| 7264 Morrison Street | Sold | $376,000 | $269 | 3 / 3 | 1,398 | Sold 2026-06-30 | 0.17 mi |
| 9285 Hainsworth Avenue | Sold | $375,000 | $276 | 3 / 3 | 1,358 | Sold 2026-06-30 | 0.17 mi |
| 7236 Plushstone Street | Active | $369,000 | $250 | 3 / 3 | 1,476 | 71 days on market | 0.19 mi |
| 7297 Powers Street | Sold | $360,000 | $258 | 3 / 3 | 1,398 | Sold 2026-08-20 | 0.22 mi |
| 9289 Nerone Avenue | Sold | $375,000 | $264 | 3 / 3 | 1,421 | Sold 2026-07-21 | 0.29 mi |
| 8995 Leaping Pad Court | Sold | $396,777 | $229 | 3 / 3 | 1,732 | Sold 2026-08-31 | 0.29 mi |
| 8977 Flying Frog | Sold | $352,000 | $228 | 3 / 3 | 1,546 | Sold 2026-06-23 | 0.29 mi |
| 8970 Flying Frog Avenue | Active | $419,900 | $331 | 3 / 3 | 1,270 | 0 days on market | 0.30 mi |


