
Comparable Sales Near 726 Canary Wharf Drive, Las Vegas, NV 89178
1st Realty · Comparable sales report · 1st.estate · October 20, 2026
Read the Rhodes Ranch neighborhood guide →
726 Canary Wharf Drive, Las Vegas, NV 89178
Status: Sold
$637,500 Sold Price
$180
$ / Sq Ft
3,536
Living Area
6,098 sqft
Lot Size
5
Beds
3
Baths
2006
Year Built
Search Parameters
Property Type
Status
Radius
Sold Within
Beds
Baths
Living Area (Sq Ft)
Lot Size (Sq Ft)
This comp search reflects your current search parameters — adjust the filters above as needed for a more accurate estimate.
Estimated Value
—
Average $/Sqft
—
Check one or more comps below to calculate an estimate.
Nearest 10 of 12 comparable sales and listings within 1 mile of this home. Use the filters above and press Search to refine.
$530,0004 bd3 ba2,936 sqft$181/sqft0.39 mi134 daysSold 2026-05-20
$650,0005 bd4 ba2,946 sqft$221/sqft0.42 mi18 daysSold 2026-04-27
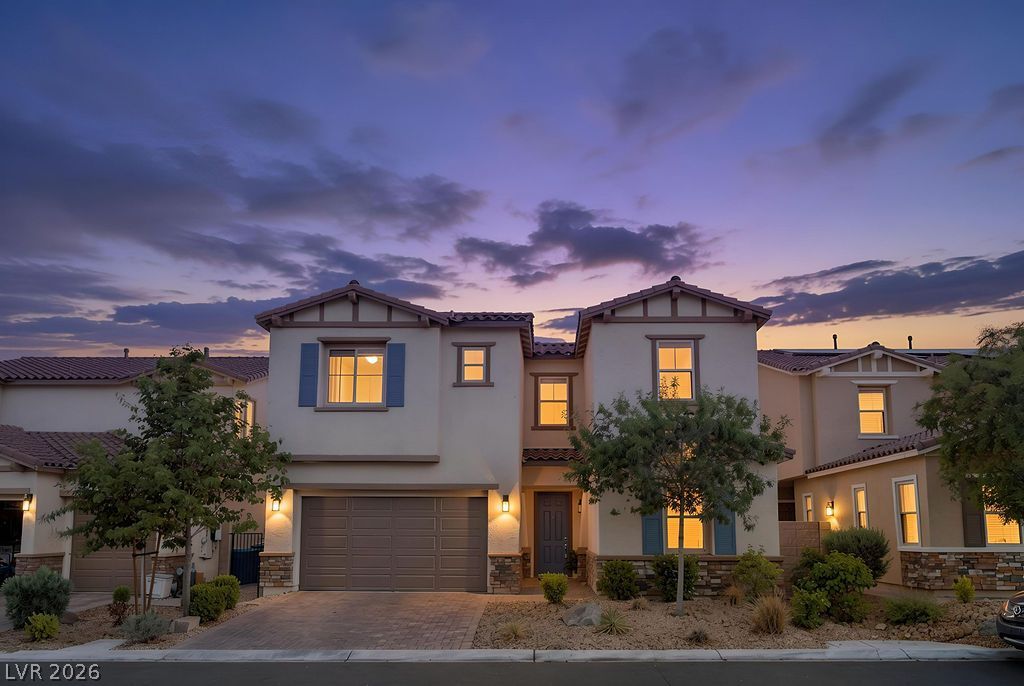
$707,0004 bd4 ba3,186 sqft$222/sqft0.48 mi13 daysSold 2026-09-28
$850,0004 bd3 ba3,322 sqft$256/sqft0.52 mi55 daysSold 2026-05-01
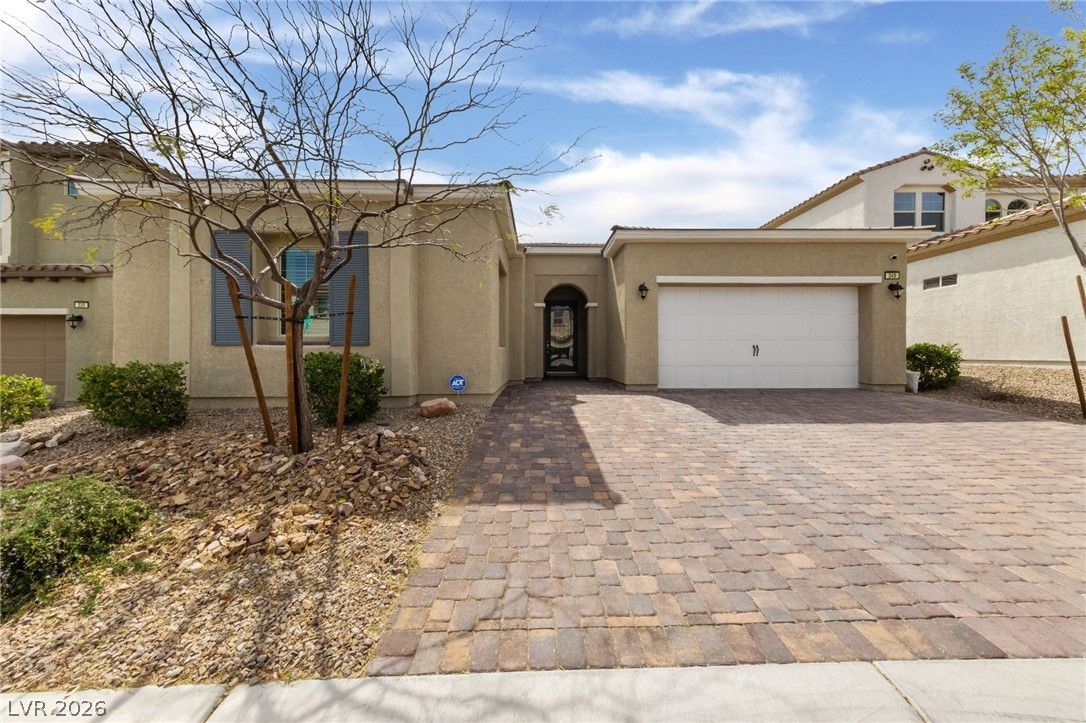
349 Bronze Creek CourtActive
$849,8884 bd3 ba2,725 sqft$312/sqft0.53 mi111 days
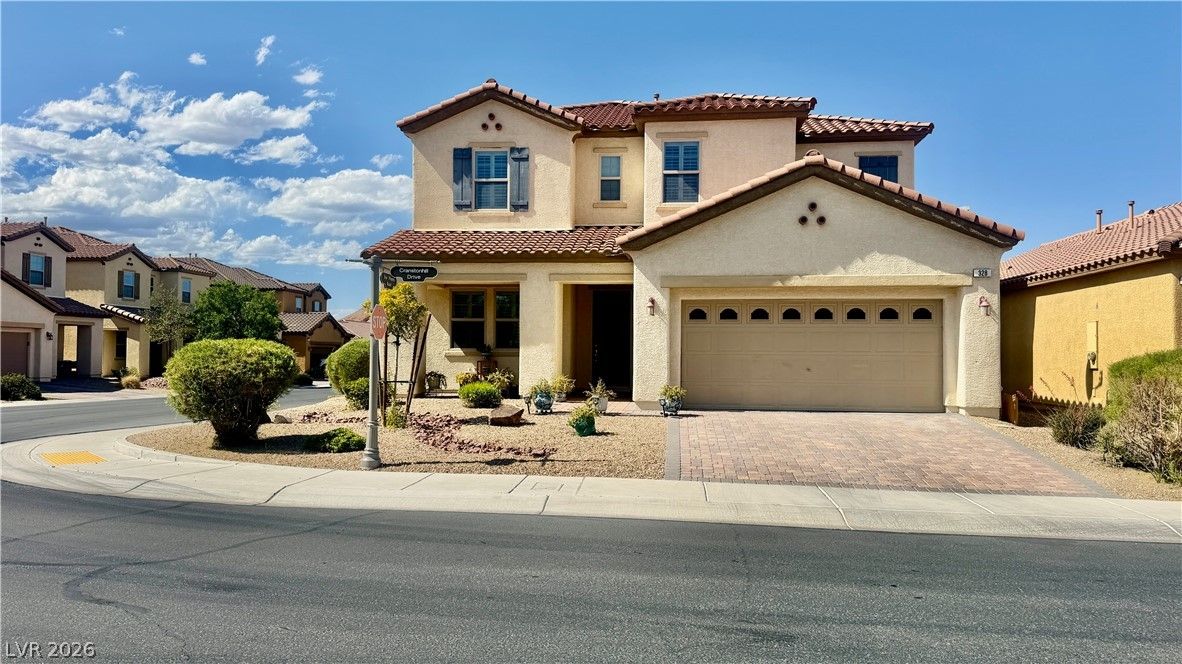
328 Cranstonhill DriveActive
$610,0005 bd3 ba3,015 sqft$202/sqft0.53 mi0 days
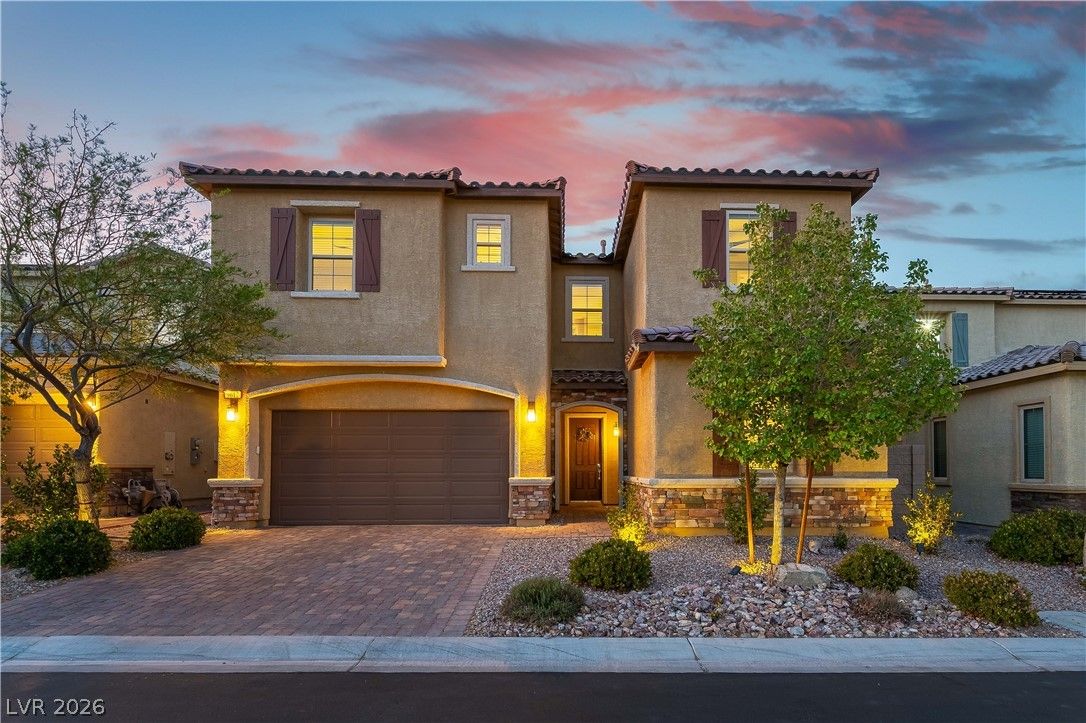
9612 Starfish Reef WayActive
$750,0004 bd4 ba3,186 sqft$235/sqft0.55 mi165 days
$632,0005 bd3 ba3,085 sqft$205/sqft0.67 mi115 daysSold 2026-05-04
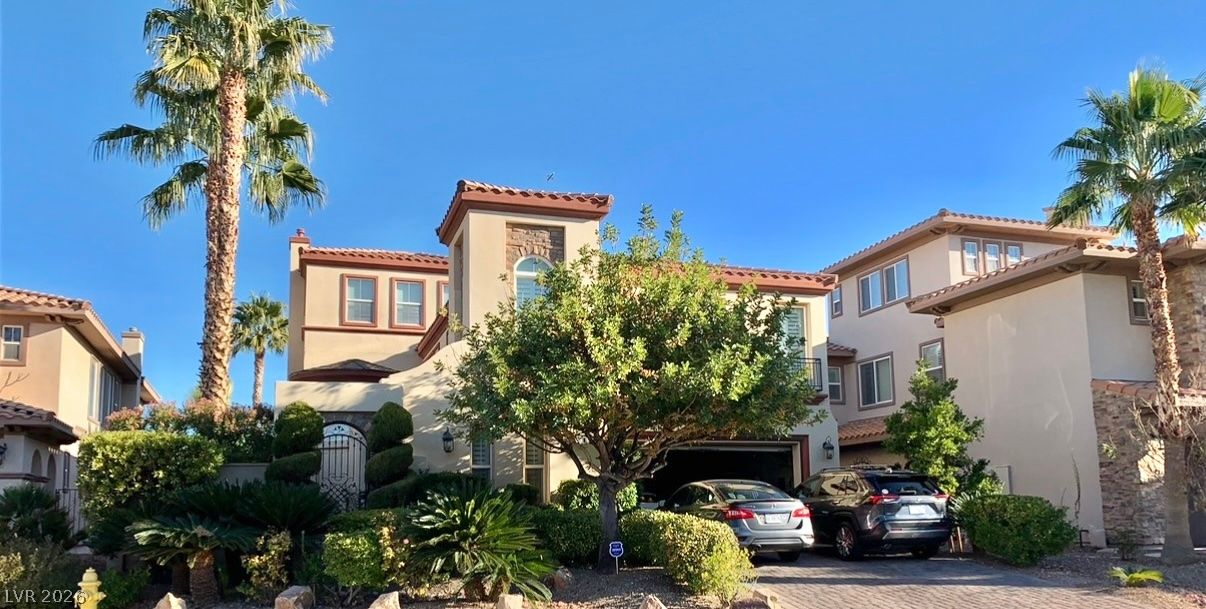
218 Crooked Putter DriveActive
$1,199,9994 bd4 ba3,962 sqft$303/sqft0.70 mi49 days
604 Over Par CourtActive
$750,0004 bd3 ba2,891 sqft$259/sqft0.73 mi9 days
Nearest comparable sales and listings
12 comparables · median price $688,500 · range $530,000 – $1,199,999 · median $/sq ft $229 · average $/sq ft $236
| Address | Status | Price | $/Sq Ft | Bd / Ba | Sq Ft | Sold / market time | Distance |
|---|---|---|---|---|---|---|---|
| 971 Huntington Cove Parkway | Sold | $530,000 | $181 | 4 / 3 | 2,936 | Sold 2026-05-20 | 0.39 mi |
| 9956 West Cougar Avenue | Sold | $650,000 | $221 | 5 / 4 | 2,946 | Sold 2026-04-27 | 0.42 mi |
| 9641 Aqua Harbor Way | Sold | $707,000 | $222 | 4 / 4 | 3,186 | Sold 2026-09-28 | 0.48 mi |
| 9606 Aqua Harbor Way | Sold | $850,000 | $256 | 4 / 3 | 3,322 | Sold 2026-05-01 | 0.52 mi |
| 349 Bronze Creek Court | Active | $849,888 | $312 | 4 / 3 | 2,725 | 111 days on market | 0.53 mi |
| 328 Cranstonhill Drive | Active | $610,000 | $202 | 5 / 3 | 3,015 | 0 days on market | 0.53 mi |
| 9612 Starfish Reef Way | Active | $750,000 | $235 | 4 / 4 | 3,186 | 165 days on market | 0.55 mi |
| 8655 Rori Springs Street | Sold | $632,000 | $205 | 5 / 3 | 3,085 | Sold 2026-05-04 | 0.67 mi |
| 218 Crooked Putter Drive | Active | $1,199,999 | $303 | 4 / 4 | 3,962 | 49 days on market | 0.70 mi |
| 604 Over Par Court | Active | $750,000 | $259 | 4 / 3 | 2,891 | 9 days on market | 0.73 mi |
| 174 White Mule Avenue | Sold | $590,000 | $196 | 4 / 3 | 3,015 | Sold 2026-09-08 | 0.75 mi |
| 454 First On Drive | Sold | $670,000 | $241 | 4 / 4 | 2,781 | Sold 2026-06-12 | 1.00 mi |


