
Comparable Sales Near 741 Wildwood Beach Avenue, Henderson, NV 89052
1st Realty · Comparable sales report · 1st.estate · October 20, 2026
Read the Henderson area guide →
741 Wildwood Beach Avenue, Henderson, NV 89052
Status: Sold
$705,000 Sold Price
$263
$ / Sq Ft
2,679
Living Area
8,276 sqft
Lot Size
4
Beds
3
Baths
2002
Year Built
Search Parameters
Property Type
Status
Radius
Sold Within
Beds
Baths
Living Area (Sq Ft)
Lot Size (Sq Ft)
This comp search reflects your current search parameters — adjust the filters above as needed for a more accurate estimate.
Estimated Value
—
Average $/Sqft
—
Check one or more comps below to calculate an estimate.
Nearest 10 of 36 comparable sales and listings within 1 mile of this home. Use the filters above and press Search to refine.
$765,0005 bd3 ba2,927 sqft$261/sqft0.10 mi47 daysSold 2026-07-15

904 Sir Winston StreetActive
$789,9003 bd3 ba2,578 sqft$306/sqft0.23 mi91 days
$680,0005 bd3 ba2,723 sqft$250/sqft0.31 mi10 daysSold 2026-04-23
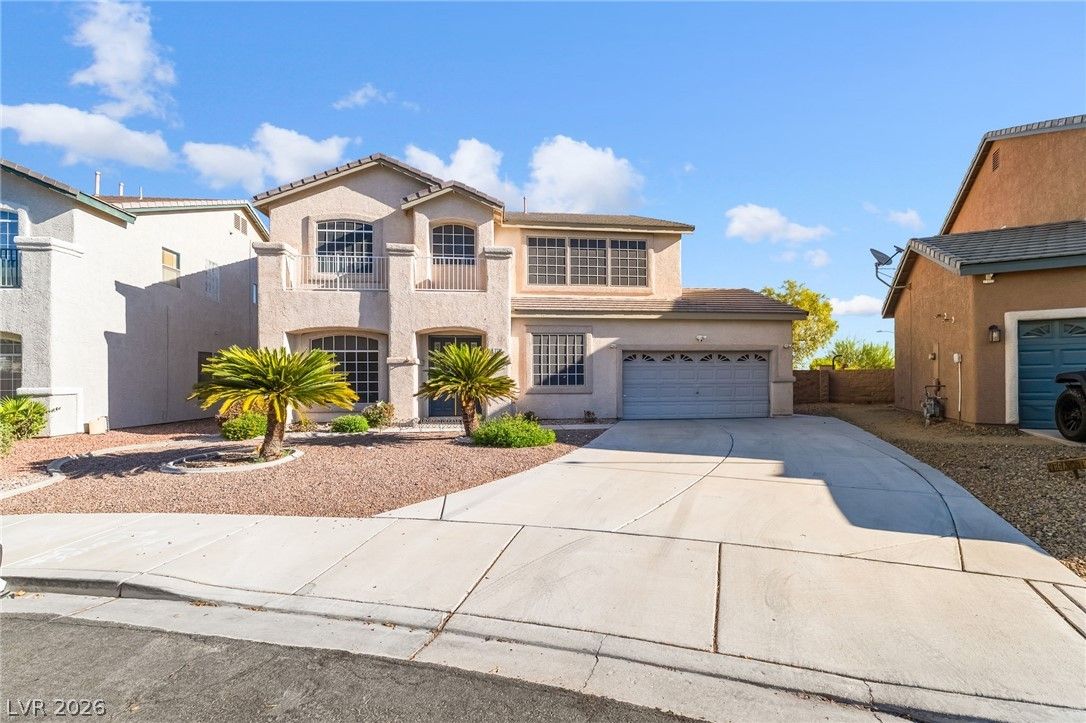
2722 Bass Lake StreetActive
$650,0005 bd3 ba3,017 sqft$215/sqft0.44 mi37 days
$716,0004 bd3 ba2,754 sqft$260/sqft0.45 mi45 daysSold 2026-06-22
$625,0004 bd3 ba2,251 sqft$278/sqft0.49 mi3 daysSold 2026-05-27
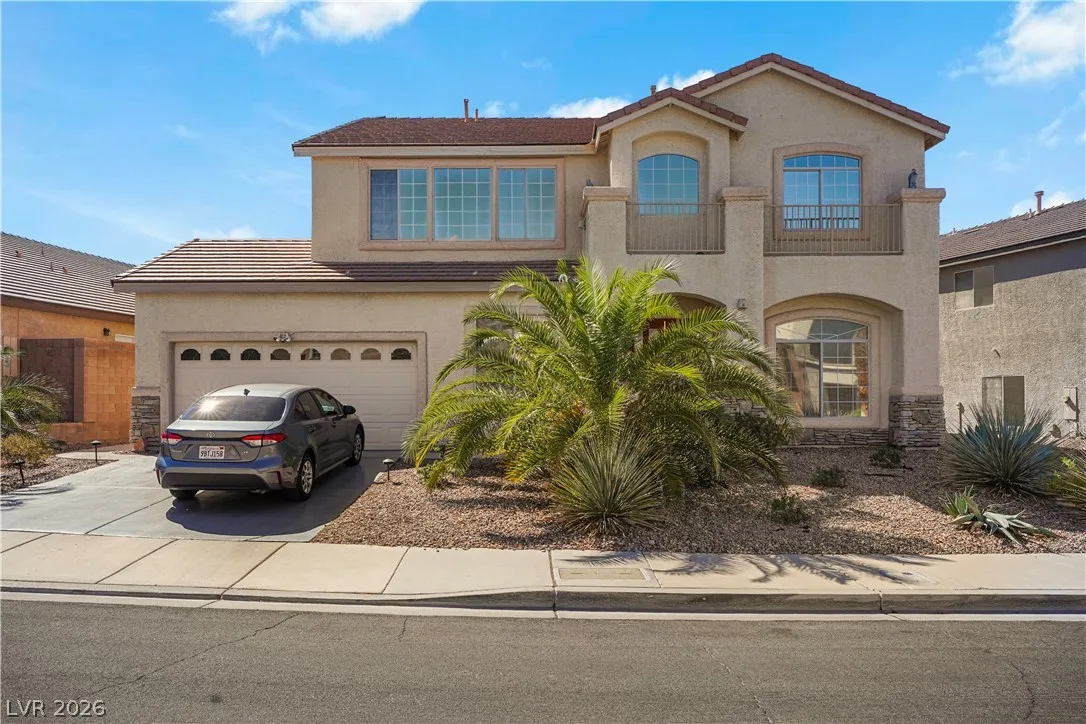
815 Roaring Falls AvenueActive
$598,9995 bd3 ba3,243 sqft$185/sqft0.57 mi14 days
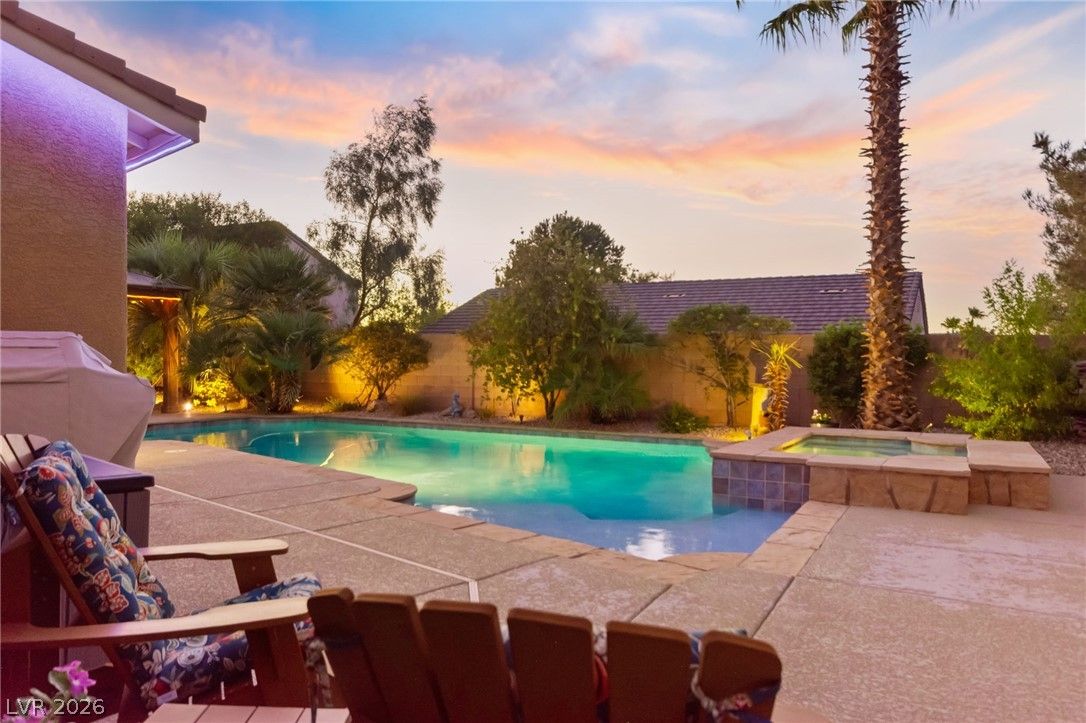
$651,0004 bd3 ba2,346 sqft$277/sqft0.58 mi12 daysSold 2026-09-11
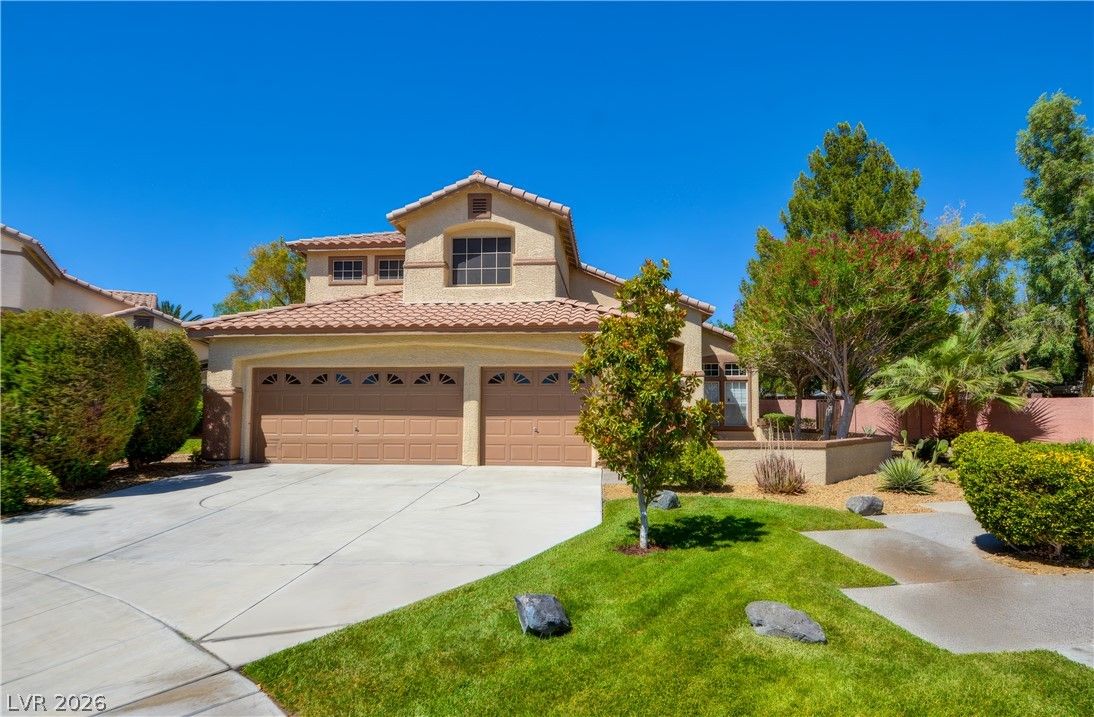
994 Upper Meadows PlaceActive
$624,9994 bd3 ba2,708 sqft$231/sqft0.60 mi65 days
$585,0004 bd3 ba2,346 sqft$249/sqft0.63 mi24 daysSold 2026-06-03
Nearest comparable sales and listings
12 comparables · median price $650,500 · range $585,000 – $873,000 · median $/sq ft $261 · average $/sq ft $257
| Address | Status | Price | $/Sq Ft | Bd / Ba | Sq Ft | Sold / market time | Distance |
|---|---|---|---|---|---|---|---|
| 747 Asbury Park Street | Sold | $765,000 | $261 | 5 / 3 | 2,927 | Sold 2026-07-15 | 0.10 mi |
| 904 Sir Winston Street | Active | $789,900 | $306 | 3 / 3 | 2,578 | 91 days on market | 0.23 mi |
| 2669 Copilico Terrace | Sold | $680,000 | $250 | 5 / 3 | 2,723 | Sold 2026-04-23 | 0.31 mi |
| 2722 Bass Lake Street | Active | $650,000 | $215 | 5 / 3 | 3,017 | 37 days on market | 0.44 mi |
| 2668 Bad Rock Circle | Sold | $716,000 | $260 | 4 / 3 | 2,754 | Sold 2026-06-22 | 0.45 mi |
| 853 Rainbolt Lane | Sold | $625,000 | $278 | 4 / 3 | 2,251 | Sold 2026-05-27 | 0.49 mi |
| 815 Roaring Falls Avenue | Active | $598,999 | $185 | 5 / 3 | 3,243 | 14 days on market | 0.57 mi |
| 2700 Peekskill Avenue | Sold | $651,000 | $277 | 4 / 3 | 2,346 | Sold 2026-09-11 | 0.58 mi |
| 994 Upper Meadows Place | Active | $624,999 | $231 | 4 / 3 | 2,708 | 65 days on market | 0.60 mi |
| 2729 La Porte Court | Sold | $585,000 | $249 | 4 / 3 | 2,346 | Sold 2026-06-03 | 0.63 mi |
| 2746 Canarsy Court | Active | $595,000 | $283 | 4 / 2 | 2,101 | 77 days on market | 0.66 mi |
| 2739 Marysville Avenue | Sold | $873,000 | $290 | 5 / 3 | 3,014 | Sold 2026-05-14 | 0.66 mi |


