
Comparable Sales Near 2340 Tribeca Street, Las Vegas, NV 89135
1st Realty · Comparable sales report · 1st.estate · October 20, 2026
Read the Summerlin neighborhood guide →
2340 Tribeca Street, Las Vegas, NV 89135
Status: Sold
$587,000 Sold Price
$301
$ / Sq Ft
1,951
Living Area
6,534 sqft
Lot Size
3
Beds
3
Baths
2004
Year Built
Search Parameters
Property Type
Status
Radius
Sold Within
Beds
Baths
Living Area (Sq Ft)
Lot Size (Sq Ft)
This comp search reflects your current search parameters — adjust the filters above as needed for a more accurate estimate.
Estimated Value
—
Average $/Sqft
—
Check one or more comps below to calculate an estimate.
Nearest 10 of 40 comparable sales and listings within 1 mile of this home. Use the filters above and press Search to refine.
$530,0004 bd3 ba1,650 sqft$321/sqft0.24 mi15 daysSold 2026-08-04
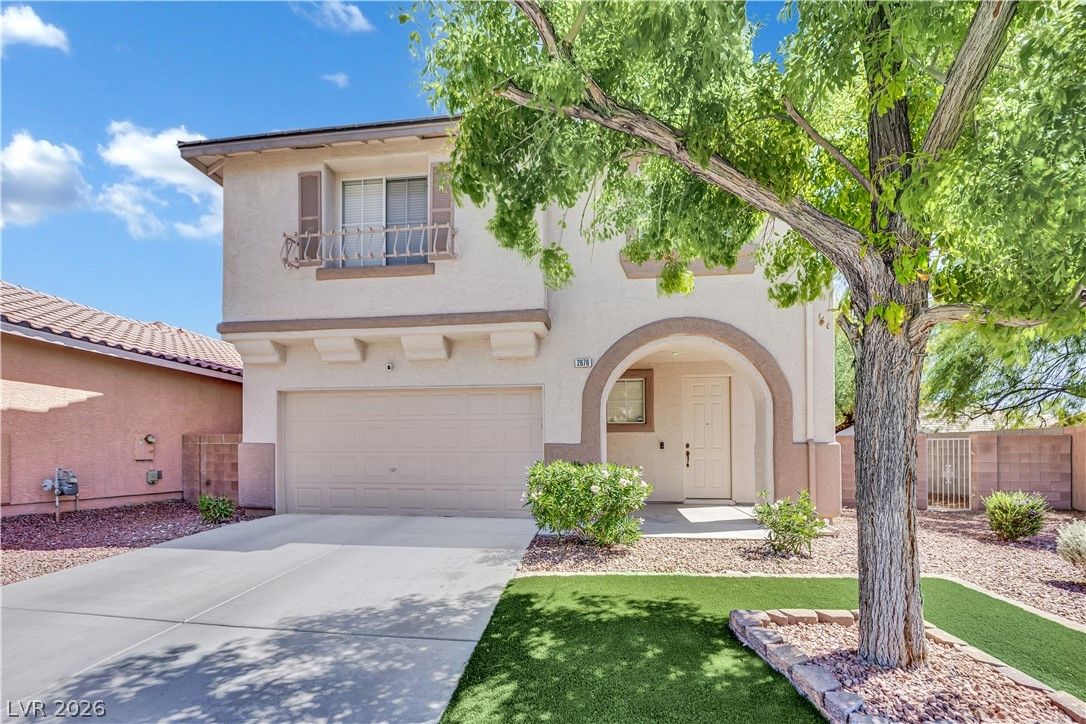
2676 Pine Run RoadActive
$505,0003 bd3 ba1,527 sqft$331/sqft0.32 mi11 days

$499,9503 bd3 ba1,707 sqft$293/sqft0.34 mi172 days
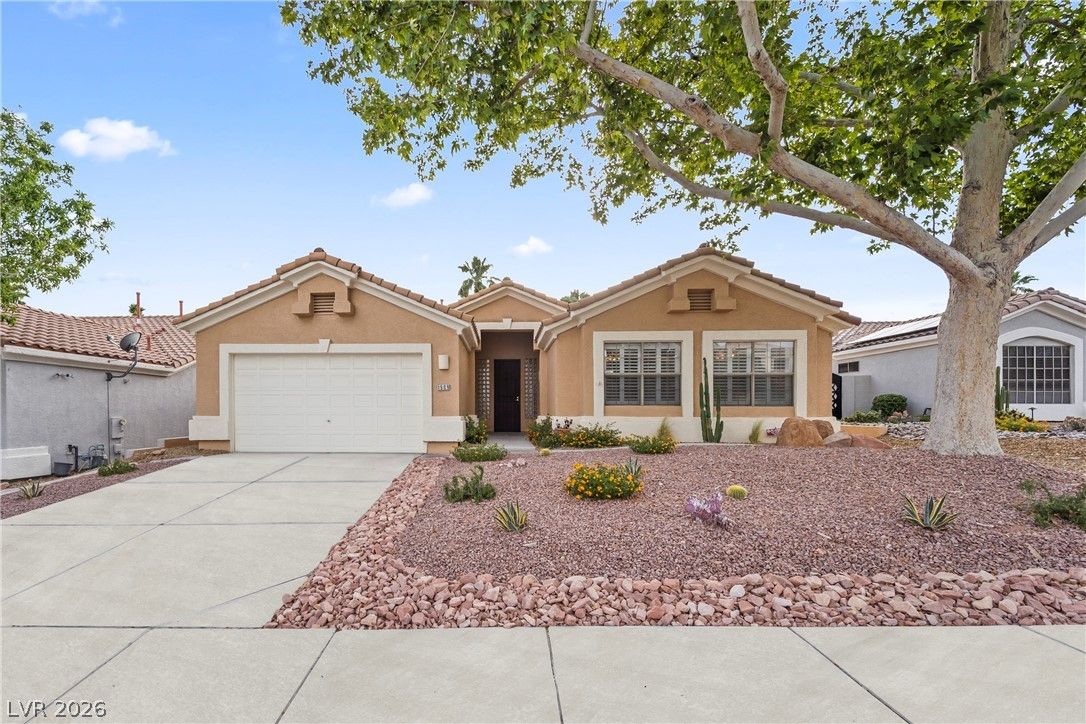
$595,0004 bd3 ba2,336 sqft$255/sqft0.43 mi60 daysSold 2026-08-05
$658,7004 bd3 ba2,336 sqft$282/sqft0.50 mi3 daysSold 2026-05-15
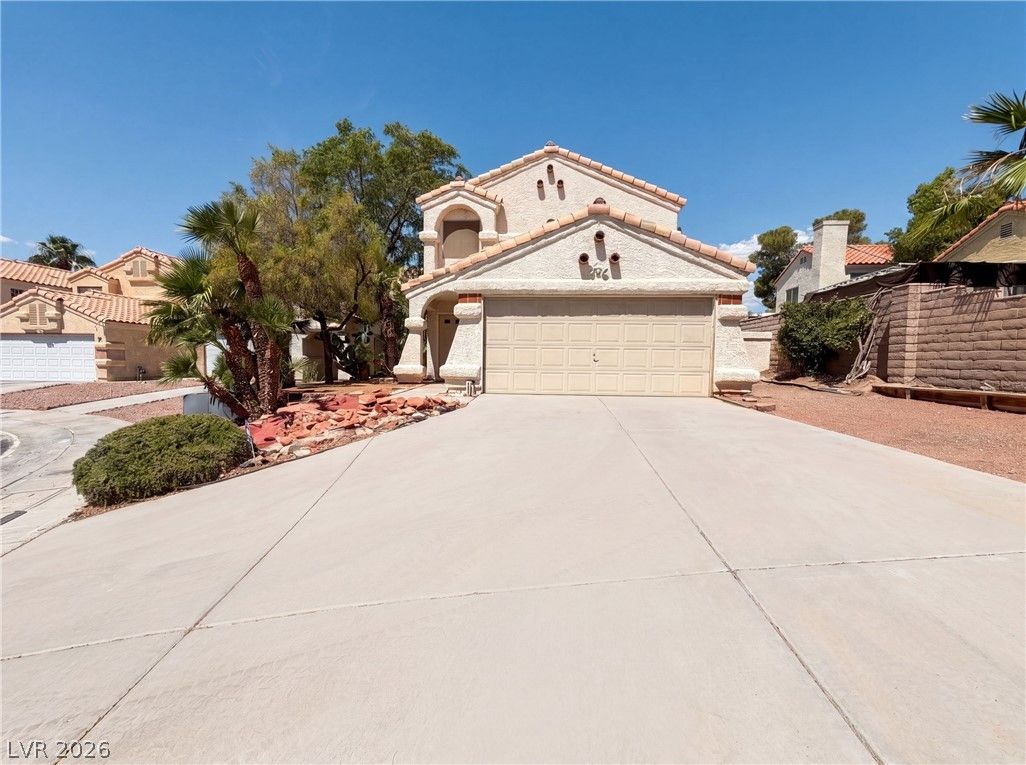
2801 Autumn Haze LaneActive
$469,0004 bd3 ba2,080 sqft$225/sqft0.52 mi96 days
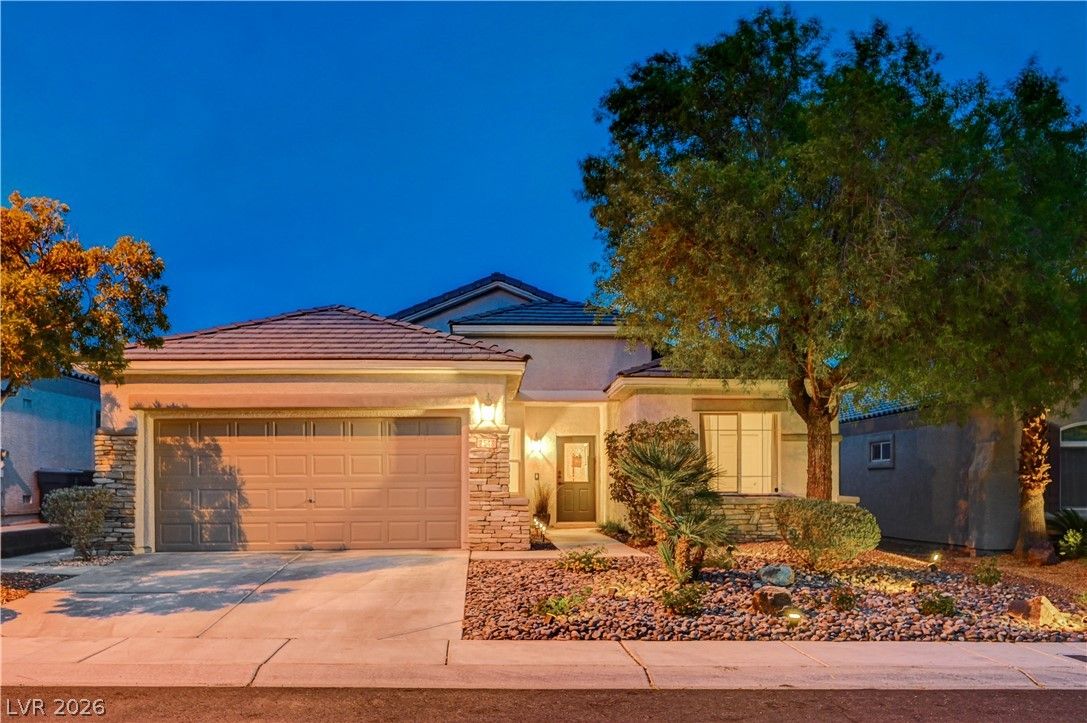
2546 Belgreen StreetPending
$695,0003 bd2 ba1,806 sqft$385/sqft0.56 mi1 days
$545,0003 bd2 ba1,661 sqft$328/sqft0.56 mi22 daysSold 2026-05-11
$707,5004 bd3 ba2,404 sqft$294/sqft0.56 mi3 daysSold 2026-05-29
$665,0003 bd2 ba1,806 sqft$368/sqft0.56 mi53 daysSold 2026-06-26
Nearest comparable sales and listings
12 comparables · median price $597,500 · range $469,000 – $707,500 · median $/sq ft $308 · average $/sq ft $308
| Address | Status | Price | $/Sq Ft | Bd / Ba | Sq Ft | Sold / market time | Distance |
|---|---|---|---|---|---|---|---|
| 10237 Jersey Shore Avenue | Sold | $530,000 | $321 | 4 / 3 | 1,650 | Sold 2026-08-04 | 0.24 mi |
| 2676 Pine Run Road | Active | $505,000 | $331 | 3 / 3 | 1,527 | 11 days on market | 0.32 mi |
| 1959 Towering Pines Street | Active | $499,950 | $293 | 3 / 3 | 1,707 | 172 days on market | 0.34 mi |
| 1909 Rolling Dunes Court | Sold | $595,000 | $255 | 4 / 3 | 2,336 | Sold 2026-08-05 | 0.43 mi |
| 9805 Pinnacle Pass Drive | Sold | $658,700 | $282 | 4 / 3 | 2,336 | Sold 2026-05-15 | 0.50 mi |
| 2801 Autumn Haze Lane | Active | $469,000 | $225 | 4 / 3 | 2,080 | 96 days on market | 0.52 mi |
| 2546 Belgreen Street | Pending | $695,000 | $385 | 3 / 2 | 1,806 | 1 days on market | 0.56 mi |
| 2902 Desert Zinnia Lane | Sold | $545,000 | $328 | 3 / 2 | 1,661 | Sold 2026-05-11 | 0.56 mi |
| 9900 Long Cattle Avenue | Sold | $707,500 | $294 | 4 / 3 | 2,404 | Sold 2026-05-29 | 0.56 mi |
| 2536 Belgreen Street | Sold | $665,000 | $368 | 3 / 2 | 1,806 | Sold 2026-06-26 | 0.56 mi |
| 2651 Thornview Street | Active | $699,990 | $326 | 4 / 2 | 2,144 | 5 days on market | 0.57 mi |
| 2305 Loggerhead Road | Active | $600,000 | $292 | 4 / 3 | 2,052 | 14 days on market | 0.59 mi |


