
Comparable Sales Near 4861 Torrence Drive, Las Vegas, NV 89103
1st Realty · Comparable sales report · 1st.estate · October 20, 2026
Read the Spring Valley neighborhood guide →
4861 Torrence Drive, Las Vegas, NV 89103
Status: Sold
$460,000 Sold Price
$296
$ / Sq Ft
1,555
Living Area
6,098 sqft
Lot Size
3
Beds
2
Baths
1986
Year Built
Search Parameters
Property Type
Status
Radius
Sold Within
Beds
Baths
Living Area (Sq Ft)
Lot Size (Sq Ft)
This comp search reflects your current search parameters — adjust the filters above as needed for a more accurate estimate.
Estimated Value
—
Average $/Sqft
—
Check one or more comps below to calculate an estimate.
Nearest 10 of 60 comparable sales and listings within 1 mile of this home. Use the filters above and press Search to refine.
$440,0004 bd2 ba1,514 sqft$291/sqft0.39 mi7 daysSold 2026-05-01
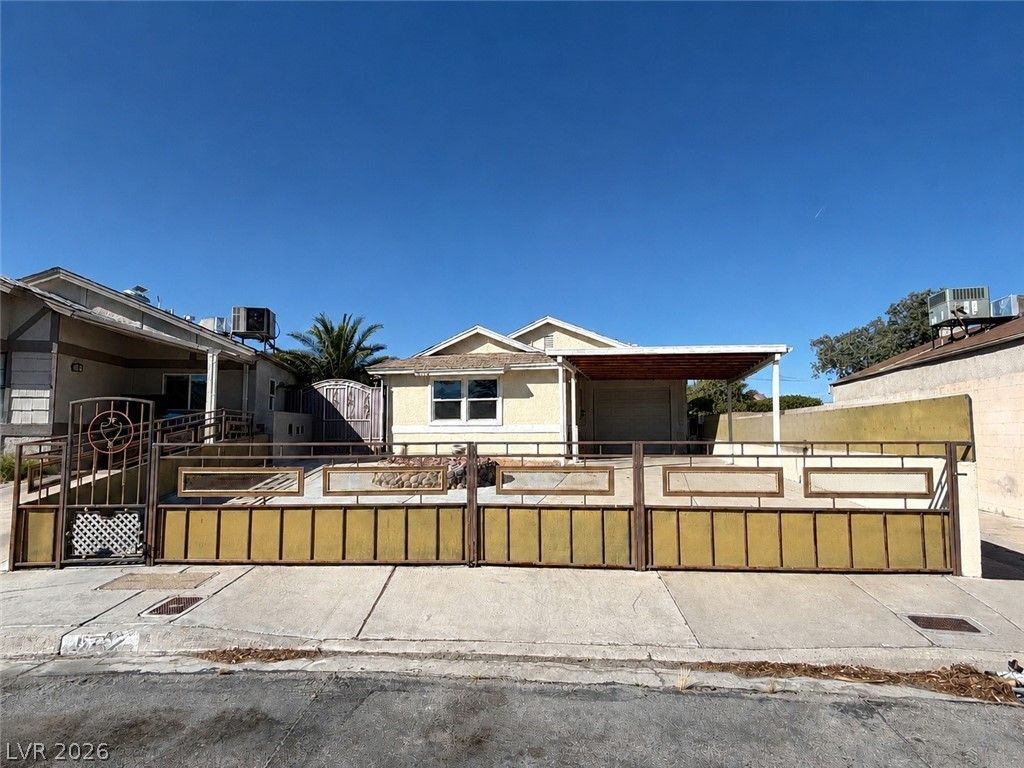
6752 Arroyo AvenueActive
$399,9003 bd3 ba1,871 sqft$214/sqft0.40 mi123 days
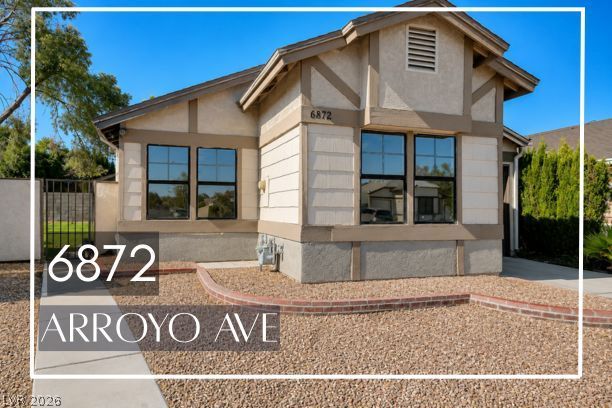
$325,0003 bd2 ba1,185 sqft$274/sqft0.41 mi16 daysSold 2026-09-30
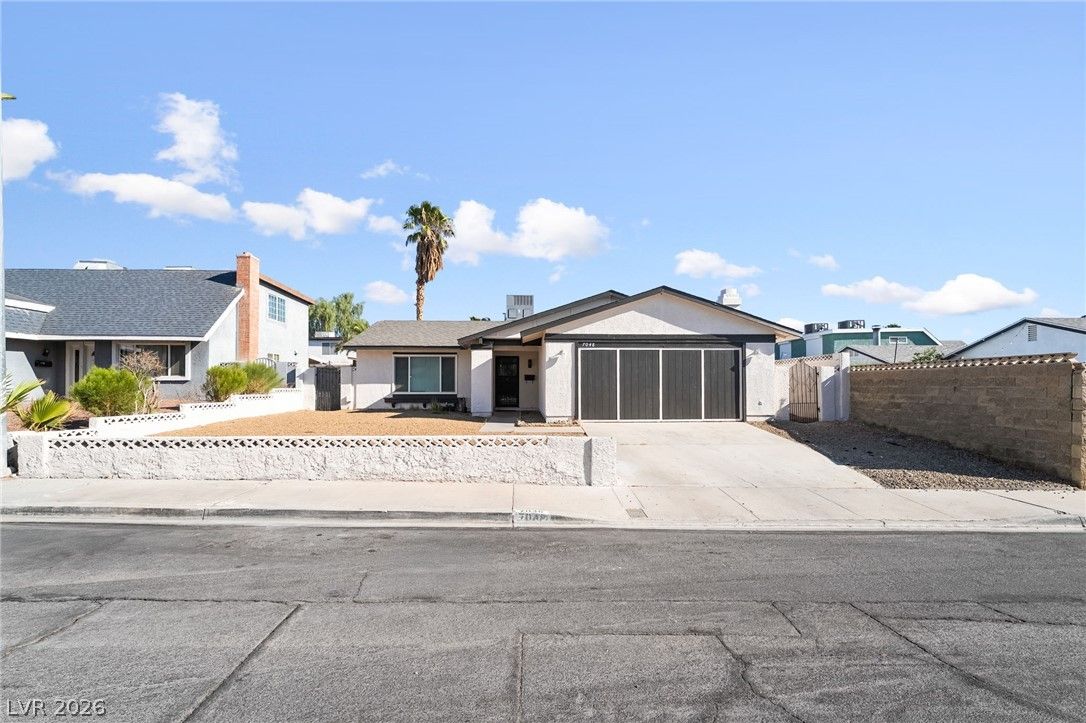
7048 Grasswood DriveActive
$420,0004 bd2 ba1,799 sqft$233/sqft0.42 mi1 days
$463,0003 bd2 ba1,538 sqft$301/sqft0.42 mi6 daysSold 2026-05-28
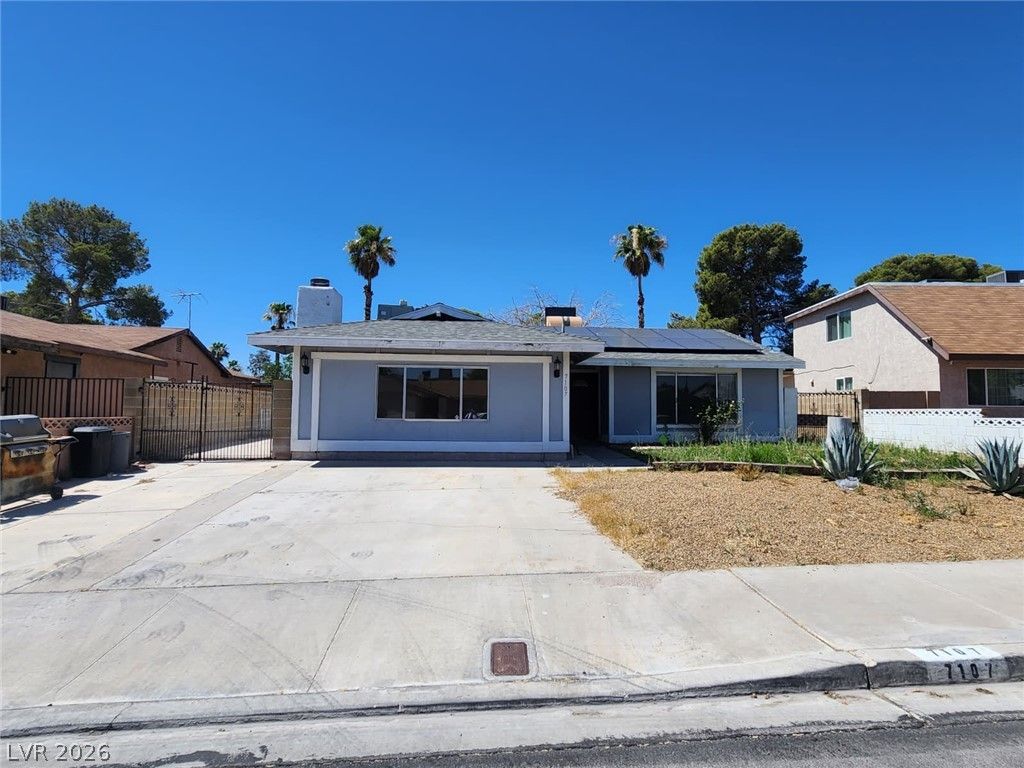
$351,0003 bd2 ba1,658 sqft$212/sqft0.43 mi36 daysSold 2026-09-16
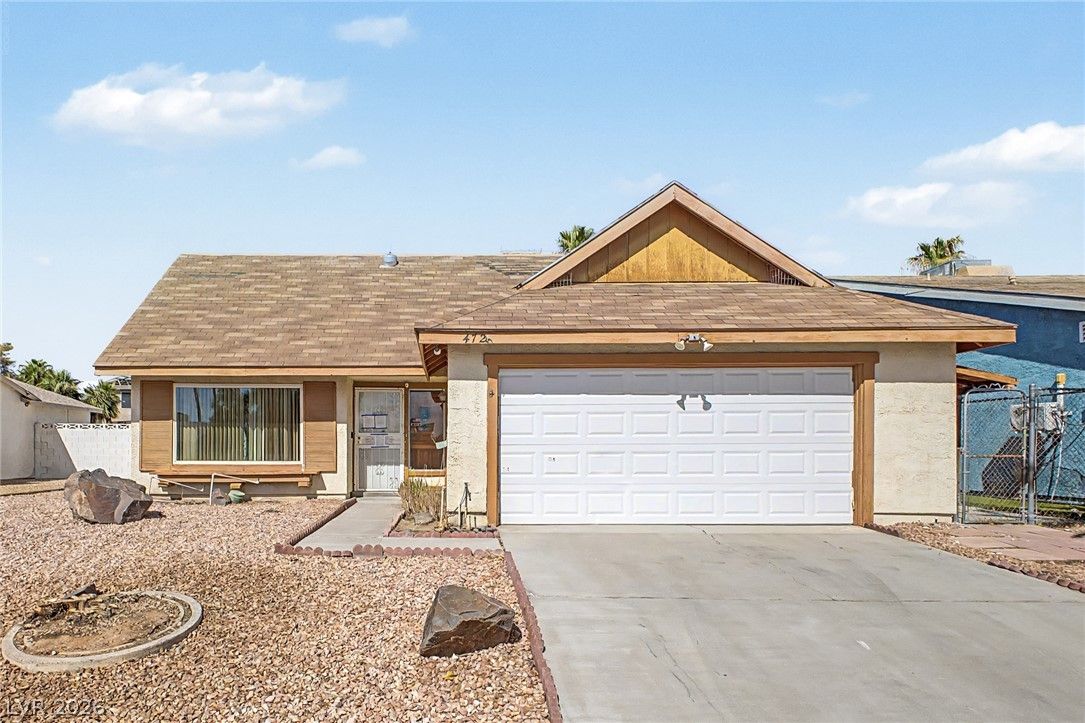
4725 Lake PlaceActive
$375,0004 bd3 ba1,692 sqft$222/sqft0.45 mi59 days

7112 Fenway AvenueActive
$412,5003 bd2 ba1,202 sqft$343/sqft0.45 mi25 days
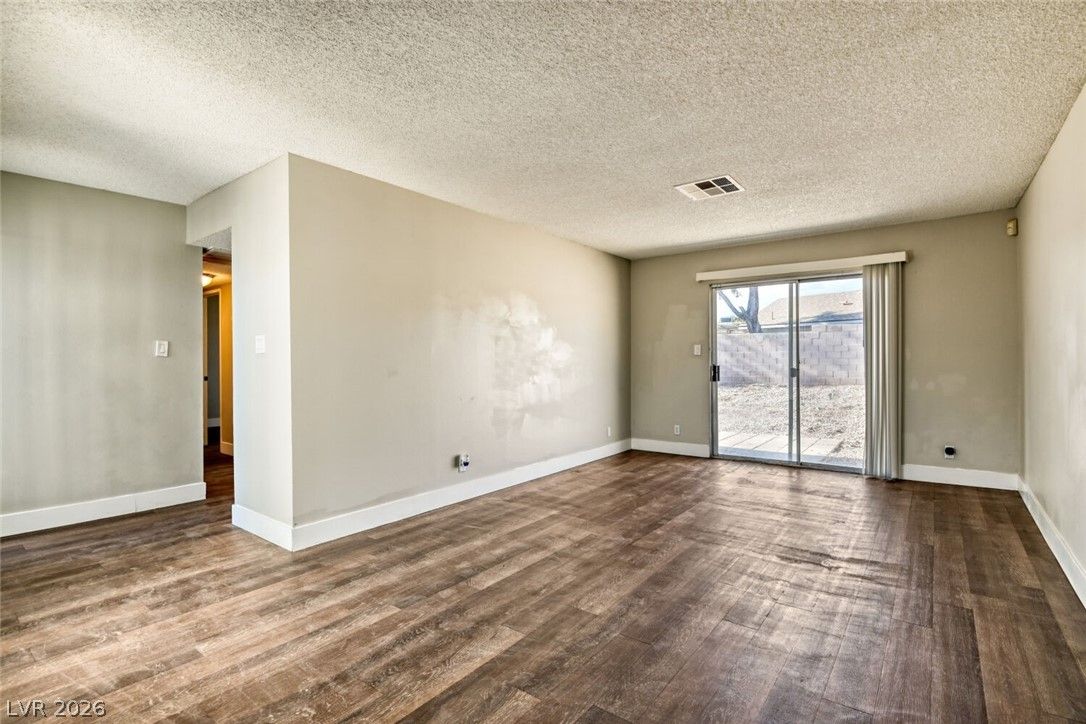
6459 Aclare AvenueActive
$369,9003 bd2 ba1,196 sqft$309/sqft0.46 mi117 days
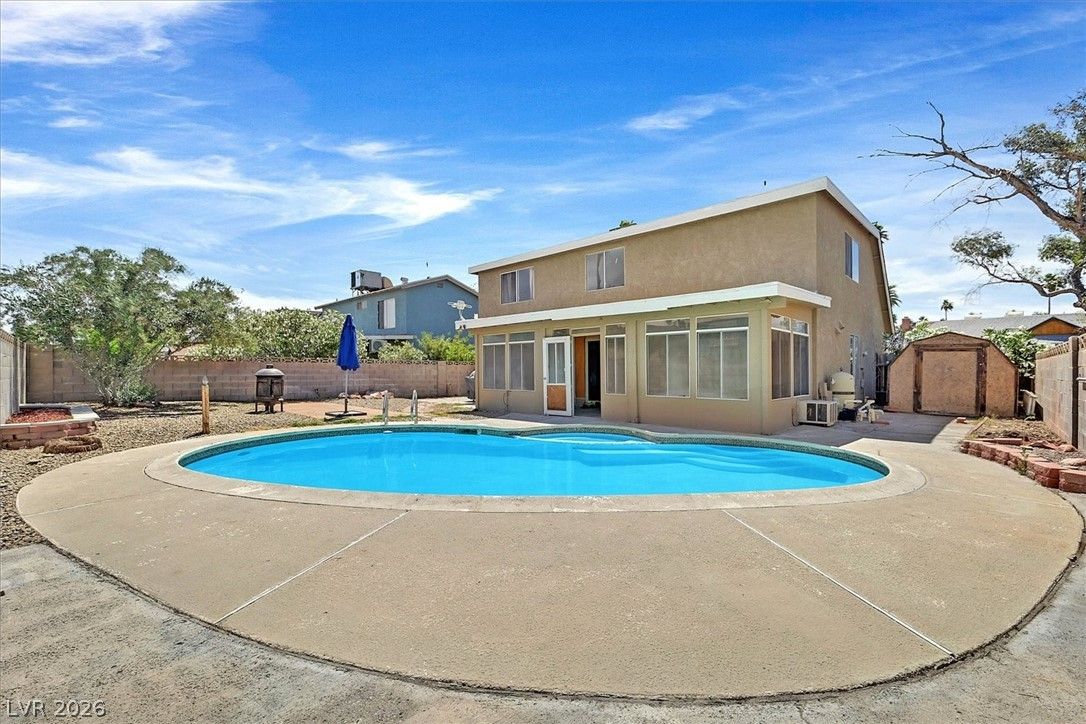
$395,0004 bd3 ba1,692 sqft$233/sqft0.47 mi16 daysSold 2026-07-24
Nearest comparable sales and listings
12 comparables · median price $399,450 · range $325,000 – $463,000 · median $/sq ft $236 · average $/sq ft $258
| Address | Status | Price | $/Sq Ft | Bd / Ba | Sq Ft | Sold / market time | Distance |
|---|---|---|---|---|---|---|---|
| 4755 Knollwood Drive | Sold | $440,000 | $291 | 4 / 2 | 1,514 | Sold 2026-05-01 | 0.39 mi |
| 6752 Arroyo Avenue | Active | $399,900 | $214 | 3 / 3 | 1,871 | 123 days on market | 0.40 mi |
| 6872 Arroyo Avenue | Sold | $325,000 | $274 | 3 / 2 | 1,185 | Sold 2026-09-30 | 0.41 mi |
| 7048 Grasswood Drive | Active | $420,000 | $233 | 4 / 2 | 1,799 | 1 days on market | 0.42 mi |
| 4690 Freshwater Drive | Sold | $463,000 | $301 | 3 / 2 | 1,538 | Sold 2026-05-28 | 0.42 mi |
| 7107 Fenway Avenue | Sold | $351,000 | $212 | 3 / 2 | 1,658 | Sold 2026-09-16 | 0.43 mi |
| 4725 Lake Place | Active | $375,000 | $222 | 4 / 3 | 1,692 | 59 days on market | 0.45 mi |
| 7112 Fenway Avenue | Active | $412,500 | $343 | 3 / 2 | 1,202 | 25 days on market | 0.45 mi |
| 6459 Aclare Avenue | Active | $369,900 | $309 | 3 / 2 | 1,196 | 117 days on market | 0.46 mi |
| 4716 Marlboro Court | Sold | $395,000 | $233 | 4 / 3 | 1,692 | Sold 2026-07-24 | 0.47 mi |
| 6592 Peachtree Lane | Under Contract | $399,000 | $225 | 4 / 2 | 1,771 | 36 days on market | 0.51 mi |
| 7024 Acorn Court | Sold | $460,000 | $238 | 3 / 3 | 1,932 | Sold 2026-05-26 | 0.51 mi |


