
Comparable Sales Near 8038 Indian Blanket Street, Las Vegas, NV 89143
1st Realty · Comparable sales report · 1st.estate · October 20, 2026
Read the Centennial Hills neighborhood guide →
8038 Indian Blanket Street, Las Vegas, NV 89143
Status: Sold
$385,000 Sold Price
$241
$ / Sq Ft
1,596
Living Area
3,049 sqft
Lot Size
3
Beds
3
Baths
2004
Year Built
Search Parameters
Property Type
Status
Radius
Sold Within
Beds
Baths
Living Area (Sq Ft)
Lot Size (Sq Ft)
This comp search reflects your current search parameters — adjust the filters above as needed for a more accurate estimate.
Estimated Value
—
Average $/Sqft
—
Check one or more comps below to calculate an estimate.
Nearest 10 of 29 comparable sales and listings within 1 mile of this home. Use the filters above and press Search to refine.
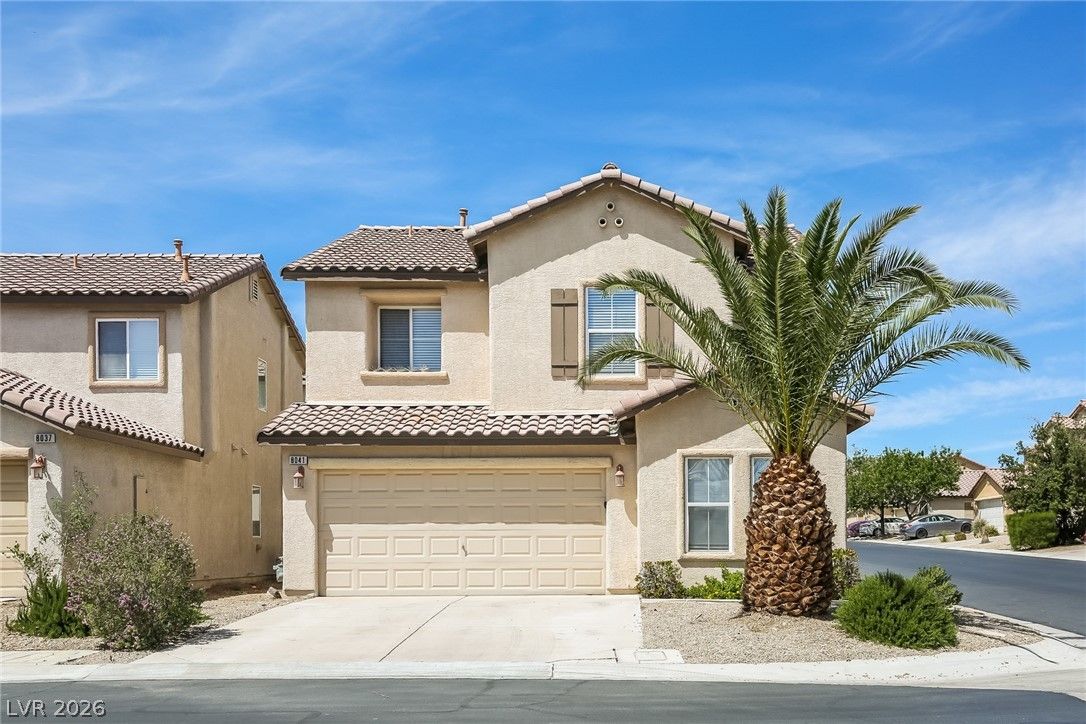
$395,0004 bd3 ba1,596 sqft$247/sqft0.06 mi134 daysSold 2026-09-30
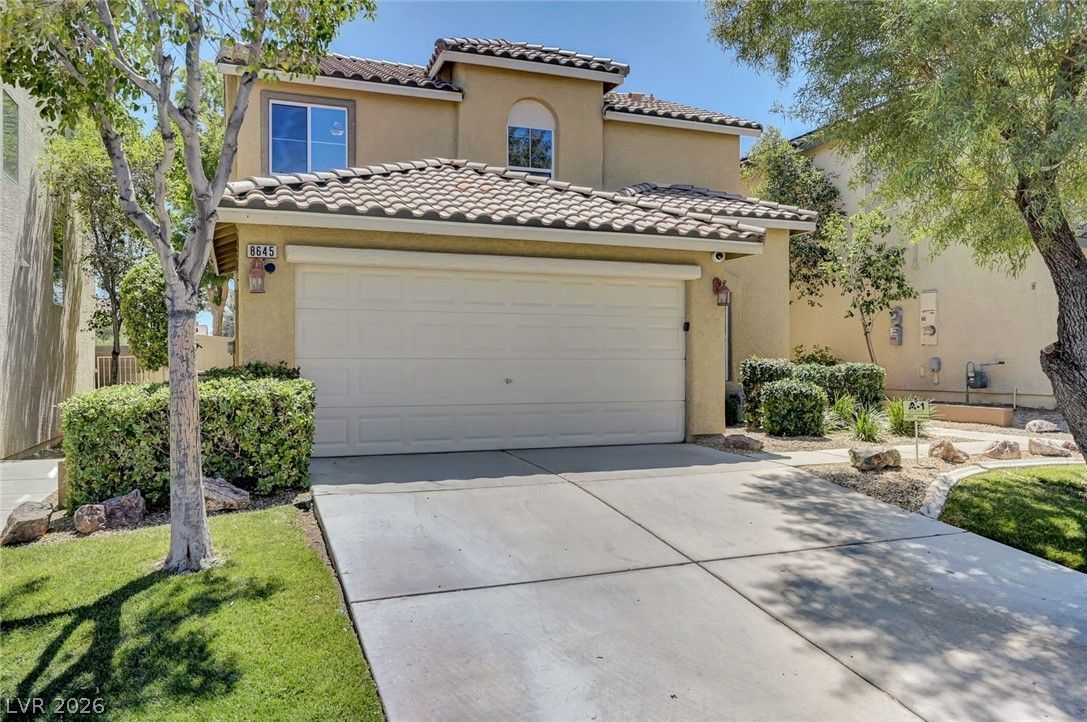
$390,0003 bd3 ba1,406 sqft$277/sqft0.07 mi95 daysSold 2026-08-31
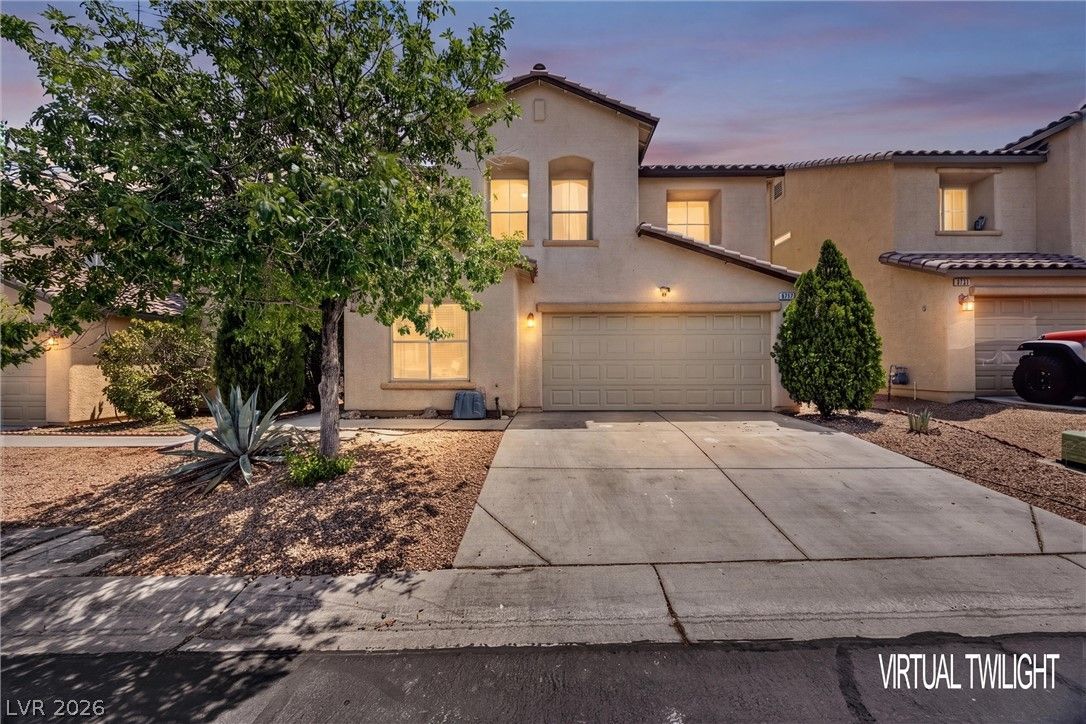
8717 Pitch Fork AvenuePending
$395,0003 bd3 ba1,595 sqft$248/sqft0.09 mi25 days
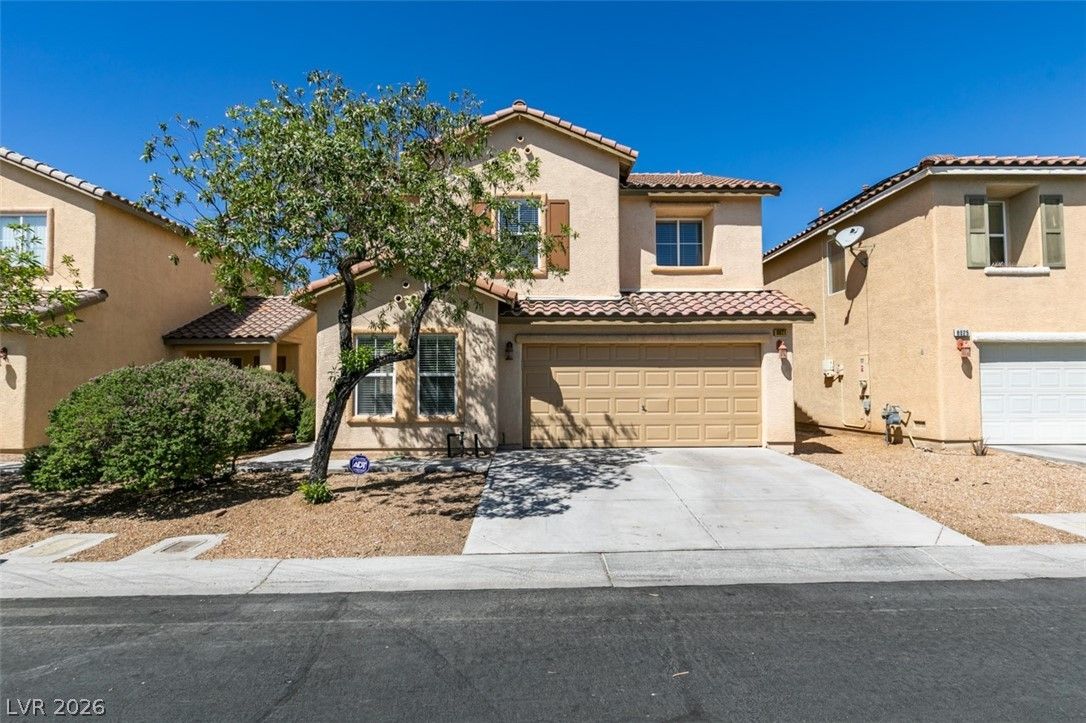
$400,0003 bd3 ba1,596 sqft$251/sqft0.09 mi82 daysSold 2026-08-06
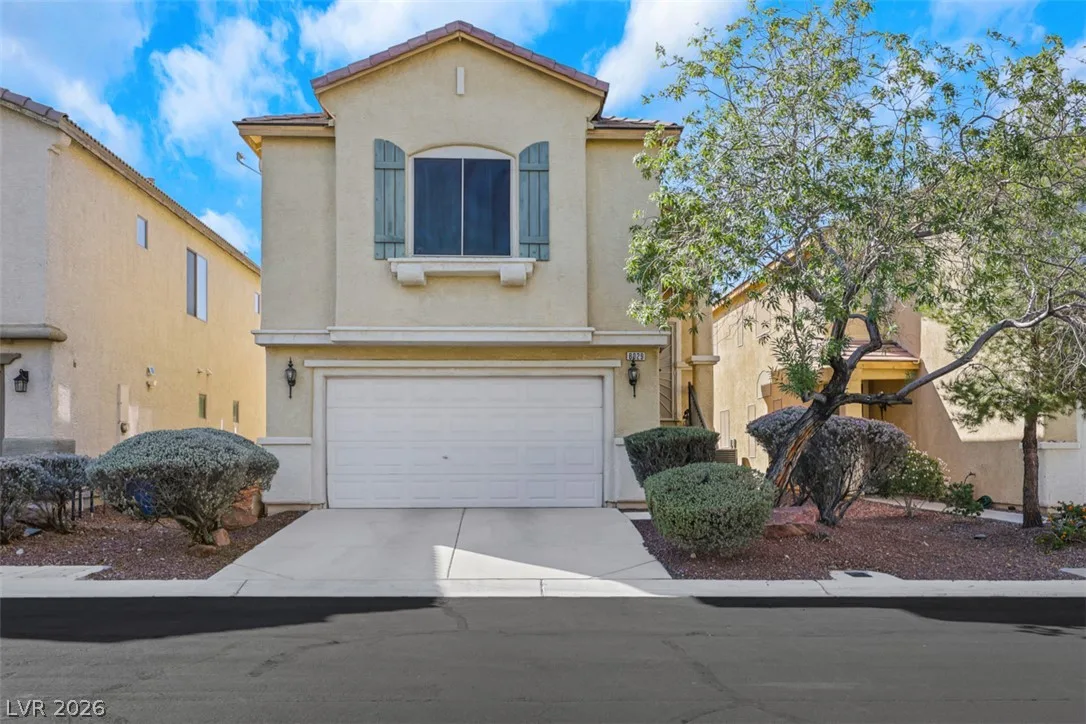
$424,9003 bd3 ba1,764 sqft$241/sqft0.22 mi2 days
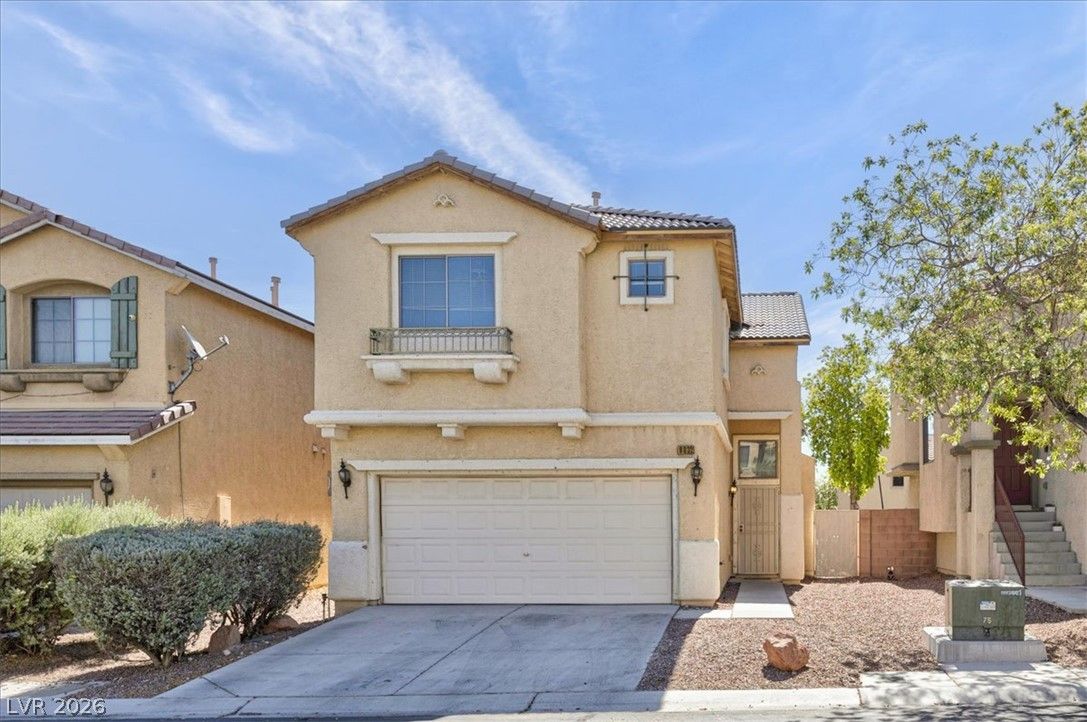
$380,0003 bd3 ba1,592 sqft$239/sqft0.24 mi34 daysSold 2026-08-31
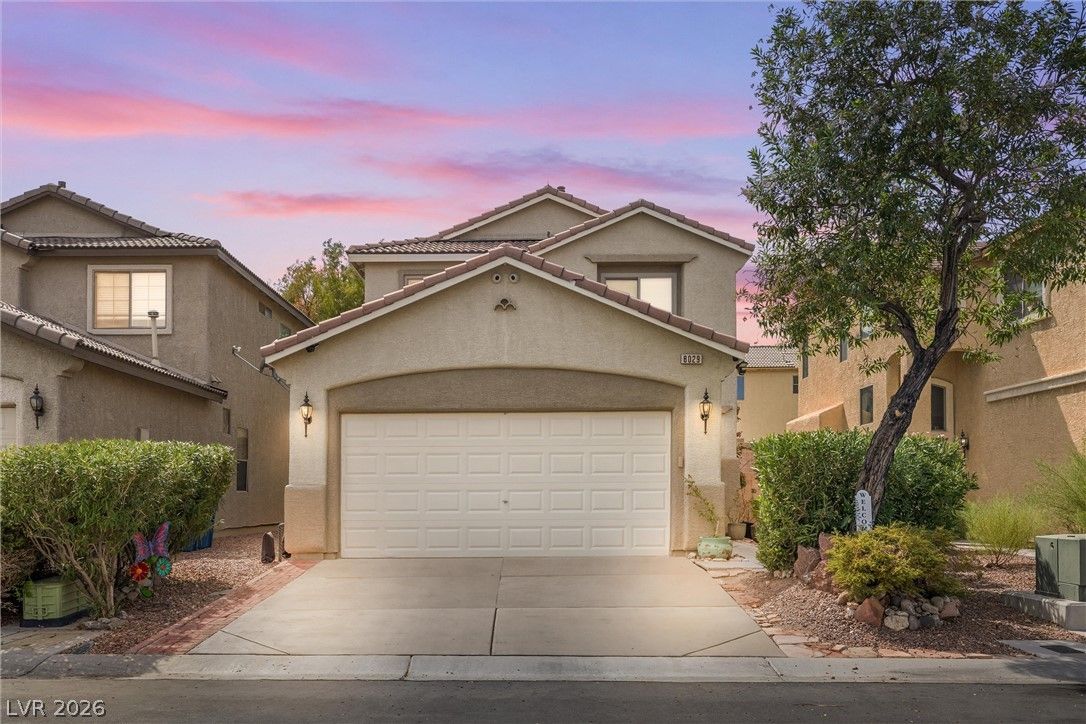
$499,9994 bd3 ba1,801 sqft$278/sqft0.26 mi31 days
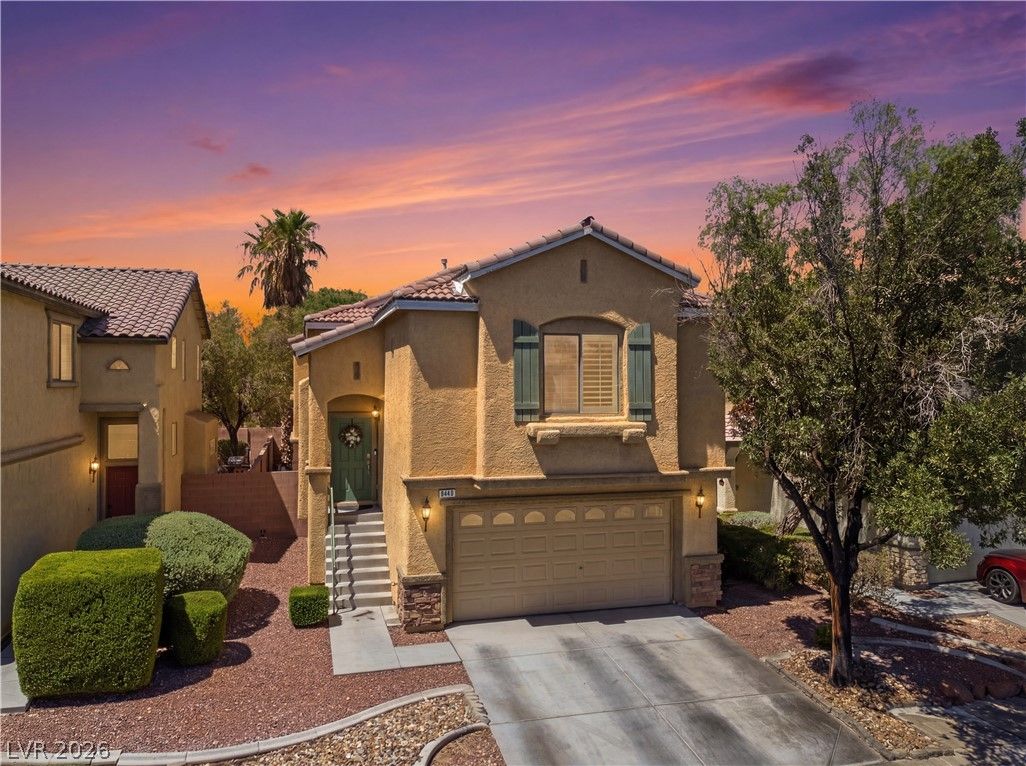
$405,0003 bd3 ba1,764 sqft$230/sqft0.26 mi6 daysSold 2026-08-03
$375,0003 bd3 ba1,855 sqft$202/sqft0.41 mi54 daysSold 2026-07-21
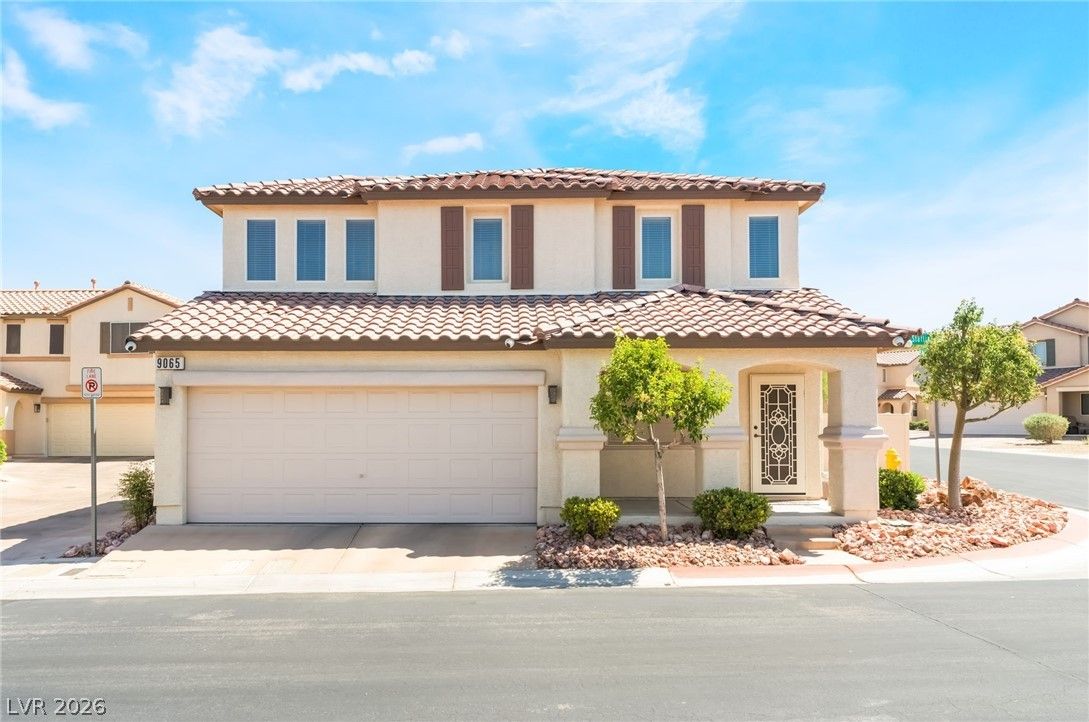
9065 Starling Wing PlaceActive
$373,0003 bd3 ba1,476 sqft$253/sqft0.48 mi79 days
Nearest comparable sales and listings
12 comparables · median price $392,500 · range $338,000 – $499,999 · median $/sq ft $249 · average $/sq ft $249
| Address | Status | Price | $/Sq Ft | Bd / Ba | Sq Ft | Sold / market time | Distance |
|---|---|---|---|---|---|---|---|
| 8041 Cracker Barrel Street | Sold | $395,000 | $247 | 4 / 3 | 1,596 | Sold 2026-09-30 | 0.06 mi |
| 8645 Pitch Fork Avenue | Sold | $390,000 | $277 | 3 / 3 | 1,406 | Sold 2026-08-31 | 0.07 mi |
| 8717 Pitch Fork Avenue | Pending | $395,000 | $248 | 3 / 3 | 1,595 | 25 days on market | 0.09 mi |
| 8021 Copperhead Creek Street | Sold | $400,000 | $251 | 3 / 3 | 1,596 | Sold 2026-08-06 | 0.09 mi |
| 8029 Dancing Springs Street | Active | $424,900 | $241 | 3 / 3 | 1,764 | 2 days on market | 0.22 mi |
| 8032 Dancing Springs Street | Sold | $380,000 | $239 | 3 / 3 | 1,592 | Sold 2026-08-31 | 0.24 mi |
| 8029 Peaceful Woods Street | Active | $499,999 | $278 | 4 / 3 | 1,801 | 31 days on market | 0.26 mi |
| 8440 Cheerful Brook Avenue | Sold | $405,000 | $230 | 3 / 3 | 1,764 | Sold 2026-08-03 | 0.26 mi |
| 7931 Kelburn Hill Street | Sold | $375,000 | $202 | 3 / 3 | 1,855 | Sold 2026-07-21 | 0.41 mi |
| 9065 Starling Wing Place | Active | $373,000 | $253 | 3 / 3 | 1,476 | 79 days on market | 0.48 mi |
| 7712 Hand Woven Court | Sold | $338,000 | $260 | 3 / 3 | 1,298 | Sold 2026-08-20 | 0.51 mi |
| 9144 Starling Wing Place | Active | $369,900 | $265 | 3 / 3 | 1,397 | 35 days on market | 0.54 mi |


