
Comparable Sales Near 7831 Windward Road, Las Vegas, NV 89147
1st Realty · Comparable sales report · 1st.estate · October 20, 2026
Read the Spring Valley neighborhood guide →
7831 Windward Road, Las Vegas, NV 89147
Status: Sold
$488,000 Sold Price
$251
$ / Sq Ft
1,946
Living Area
5,663 sqft
Lot Size
3
Beds
3
Baths
1998
Year Built
Search Parameters
Property Type
Status
Radius
Sold Within
Beds
Baths
Living Area (Sq Ft)
Lot Size (Sq Ft)
This comp search reflects your current search parameters — adjust the filters above as needed for a more accurate estimate.
Estimated Value
—
Average $/Sqft
—
Check one or more comps below to calculate an estimate.
Nearest 10 of 65 comparable sales and listings within 1 mile of this home. Use the filters above and press Search to refine.
$385,0003 bd3 ba1,574 sqft$245/sqft0.12 mi12 daysSold 2026-06-23
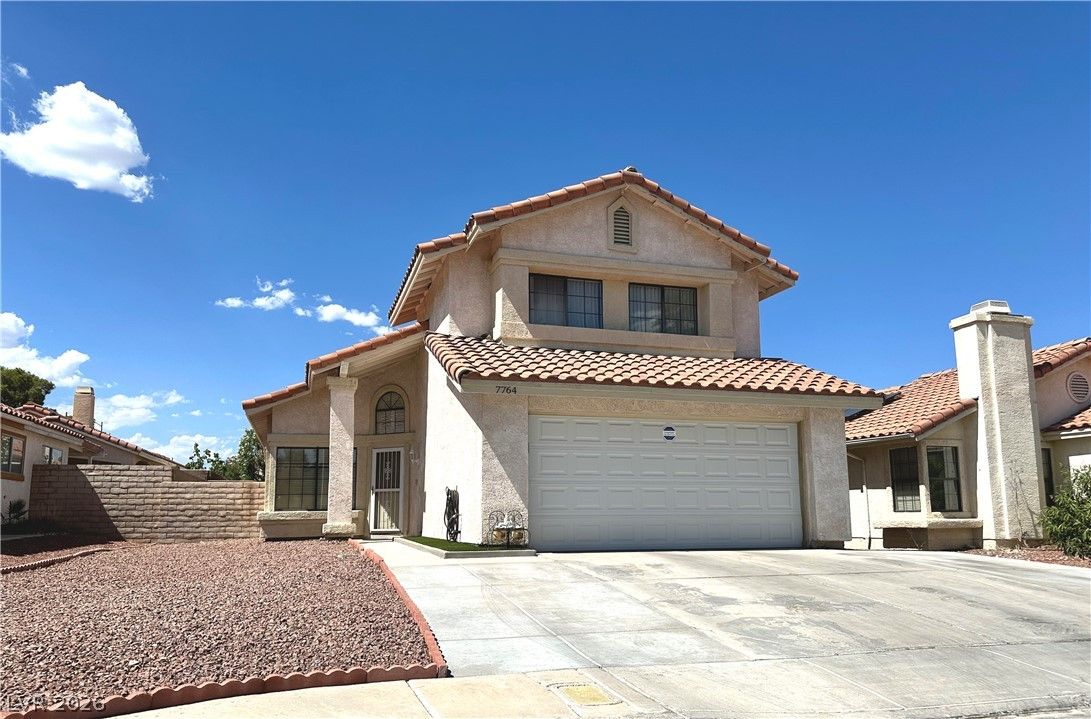
$399,0003 bd3 ba1,558 sqft$256/sqft0.13 mi33 daysSold 2026-08-27

7744 Pacemont CourtActive
$396,0003 bd3 ba1,688 sqft$235/sqft0.14 mi21 days
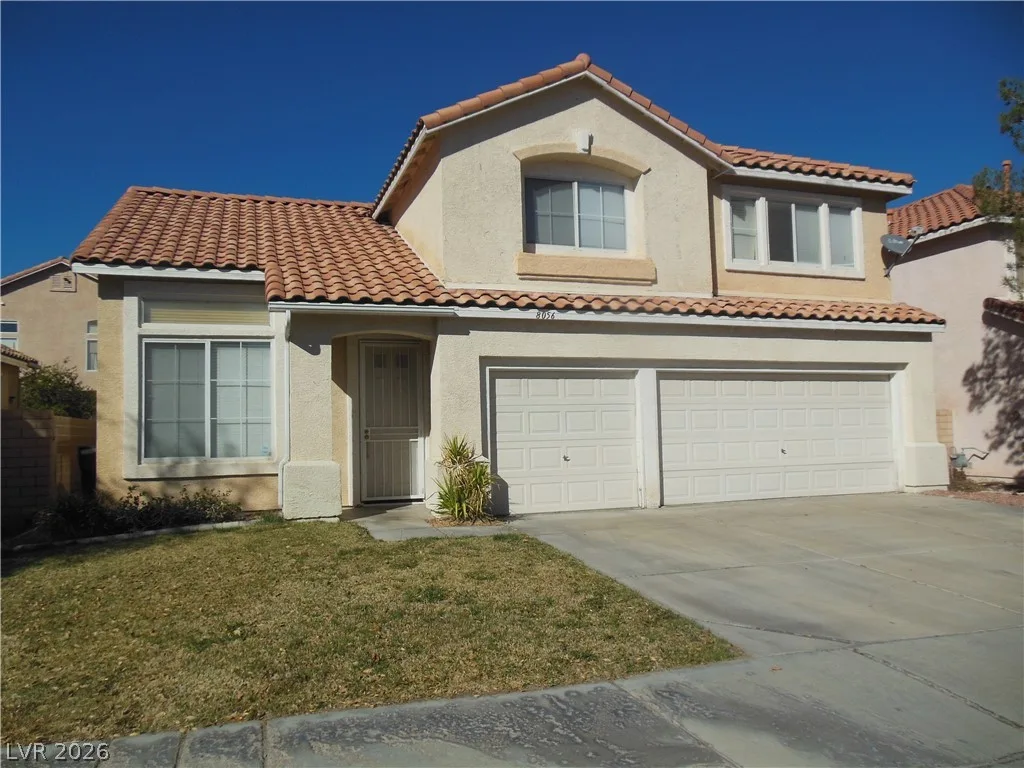
8056 Bonaventure DriveActive
$499,9004 bd3 ba2,158 sqft$232/sqft0.26 mi0 days

7531 Kalmalii AvenueActive
$519,9993 bd3 ba1,574 sqft$330/sqft0.34 mi1 days
$490,0004 bd3 ba2,266 sqft$216/sqft0.35 mi295 daysSold 2026-04-28
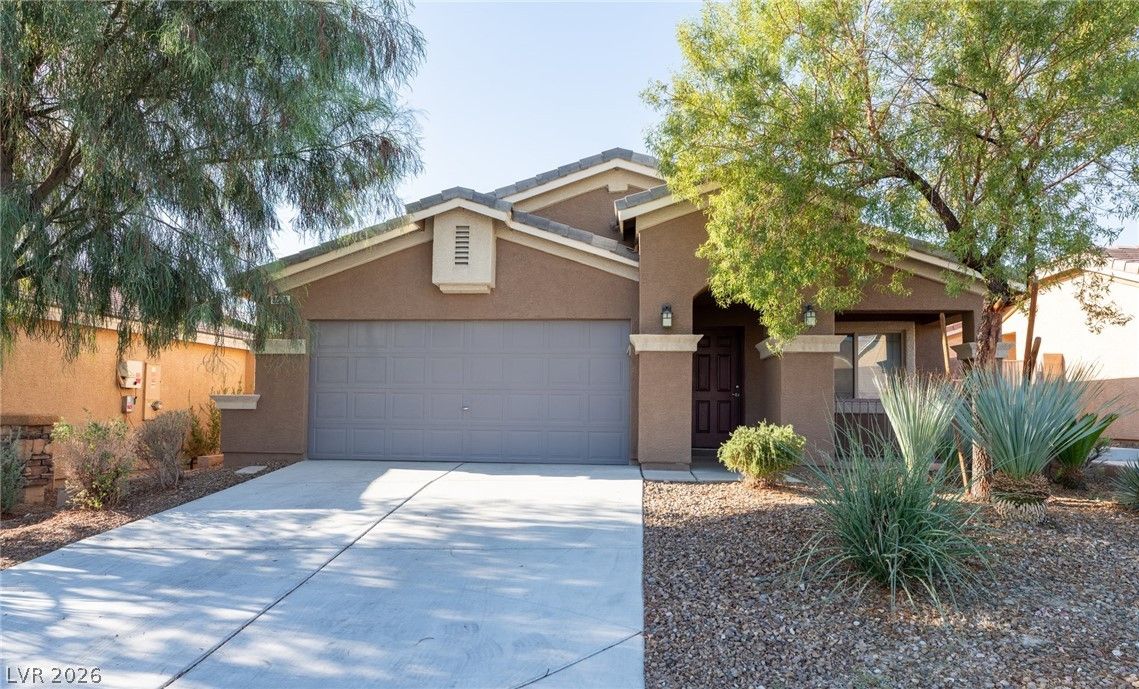
8079 Buffalo Ranch AvenueUnder Contract
$514,8883 bd2 ba1,948 sqft$264/sqft0.37 mi20 days
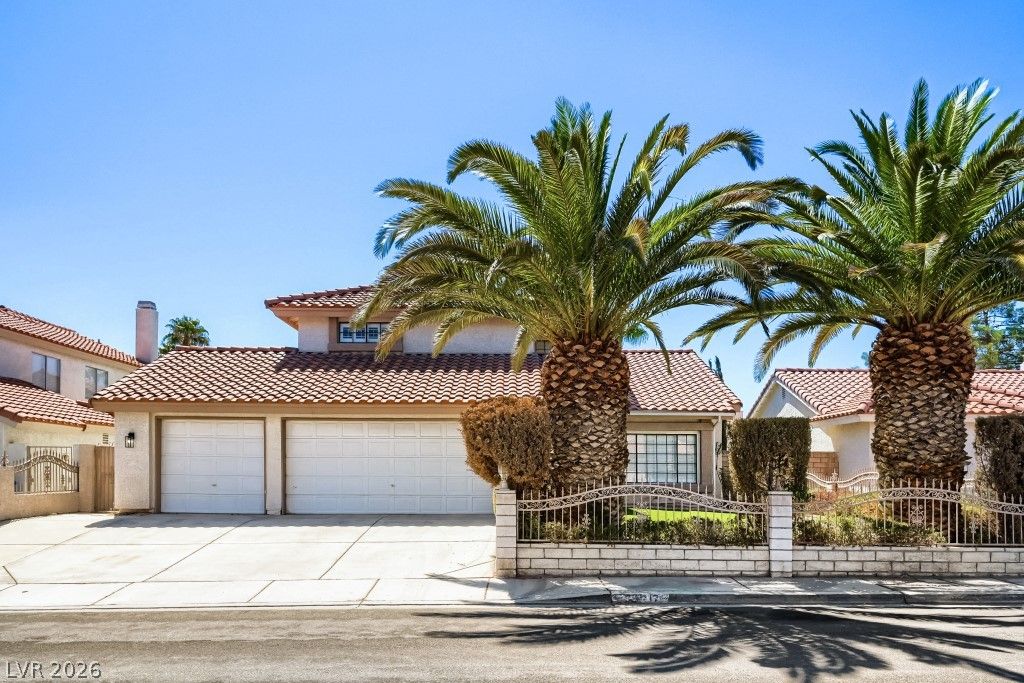
$550,0004 bd3 ba2,266 sqft$243/sqft0.38 mi5 daysSold 2026-10-01

4715 Illustrious StreetActive
$500,0004 bd3 ba2,266 sqft$221/sqft0.39 mi309 days
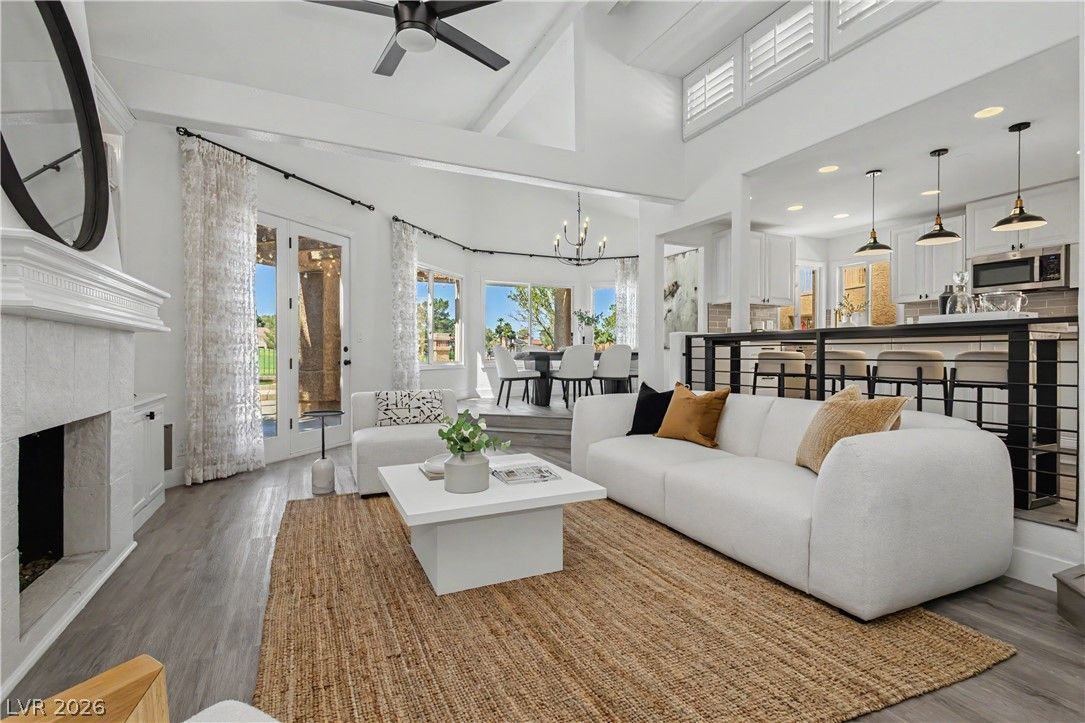
$699,0003 bd2 ba1,814 sqft$385/sqft0.39 mi4 daysSold 2026-08-31
Nearest comparable sales and listings
12 comparables · median price $503,000 · range $385,000 – $699,000 · median $/sq ft $250 · average $/sq ft $263
| Address | Status | Price | $/Sq Ft | Bd / Ba | Sq Ft | Sold / market time | Distance |
|---|---|---|---|---|---|---|---|
| 4782 Farlington Drive | Sold | $385,000 | $245 | 3 / 3 | 1,574 | Sold 2026-06-23 | 0.12 mi |
| 7764 Pacemont Court | Sold | $399,000 | $256 | 3 / 3 | 1,558 | Sold 2026-08-27 | 0.13 mi |
| 7744 Pacemont Court | Active | $396,000 | $235 | 3 / 3 | 1,688 | 21 days on market | 0.14 mi |
| 8056 Bonaventure Drive | Active | $499,900 | $232 | 4 / 3 | 2,158 | 0 days on market | 0.26 mi |
| 7531 Kalmalii Avenue | Active | $519,999 | $330 | 3 / 3 | 1,574 | 1 days on market | 0.34 mi |
| 7544 Shangri La Avenue | Sold | $490,000 | $216 | 4 / 3 | 2,266 | Sold 2026-04-28 | 0.35 mi |
| 8079 Buffalo Ranch Avenue | Under Contract | $514,888 | $264 | 3 / 2 | 1,948 | 20 days on market | 0.37 mi |
| 7527 Palermo Avenue | Sold | $550,000 | $243 | 4 / 3 | 2,266 | Sold 2026-10-01 | 0.38 mi |
| 4715 Illustrious Street | Active | $500,000 | $221 | 4 / 3 | 2,266 | 309 days on market | 0.39 mi |
| 7748 Boca Raton Drive | Sold | $699,000 | $385 | 3 / 2 | 1,814 | Sold 2026-08-31 | 0.39 mi |
| 4548 Avery Rock Street | Sold | $506,000 | $262 | 3 / 2 | 1,928 | Sold 2026-05-12 | 0.40 mi |
| 8185 Bonaventure Drive | Active | $574,999 | $266 | 4 / 3 | 2,158 | 3 days on market | 0.42 mi |


