
Comparable Sales Near 7247 Enterprise Drive, Las Vegas, NV 89147
1st Realty · Comparable sales report · 1st.estate · October 21, 2026
Read the Spring Valley neighborhood guide →
7247 Enterprise Drive, Las Vegas, NV 89147
Status: Sold
$1,985 Sold Price
$1
$ / Sq Ft
1,529
Living Area
6,970 sqft
Lot Size
4
Beds
2
Baths
1977
Year Built
Search Parameters
Property Type
Status
Radius
Sold Within
Beds
Baths
Living Area (Sq Ft)
Lot Size (Sq Ft)
This comp search reflects your current search parameters — adjust the filters above as needed for a more accurate estimate.
Estimated Value
—
Average $/Sqft
—
Check one or more comps below to calculate an estimate.
Nearest 10 of 52 comparable sales and listings within 1 mile of this home. Use the filters above and press Search to refine.
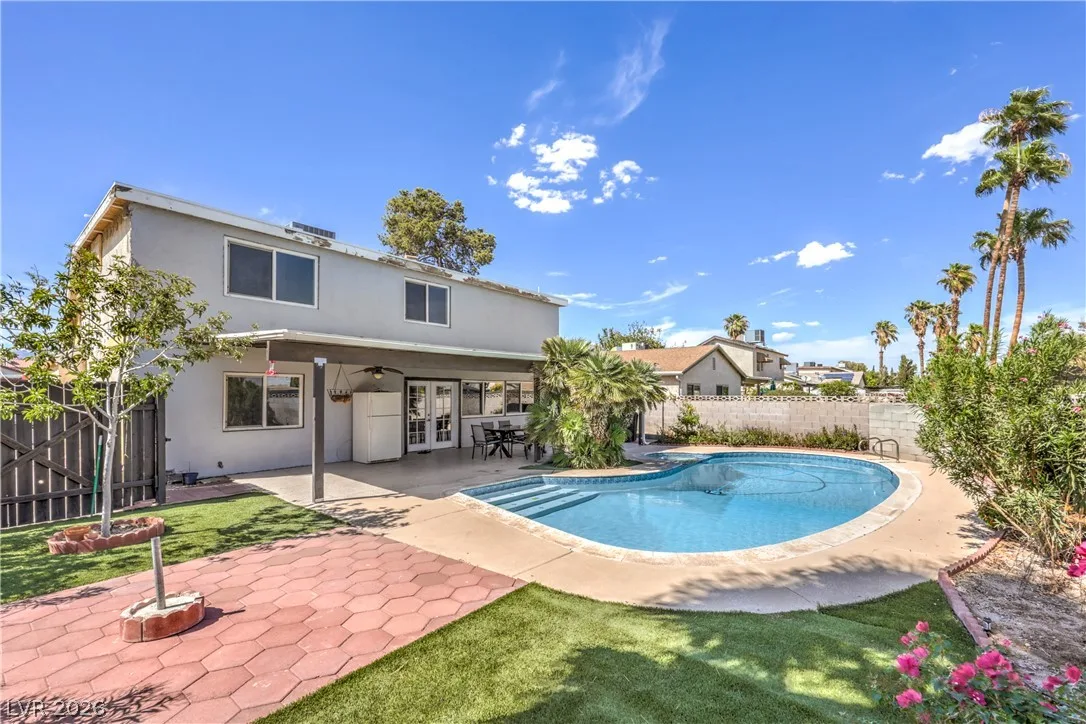
4816 Castle Rock CourtActive
$459,5004 bd3 ba1,762 sqft$261/sqft0.11 mi0 days

4823 Castle Rock CourtActive
$465,0004 bd3 ba1,762 sqft$264/sqft0.12 mi42 days
$393,5003 bd3 ba1,762 sqft$223/sqft0.12 mi5 daysSold 2026-07-08
$395,0004 bd2 ba1,529 sqft$258/sqft0.17 mi2 daysSold 2026-07-10
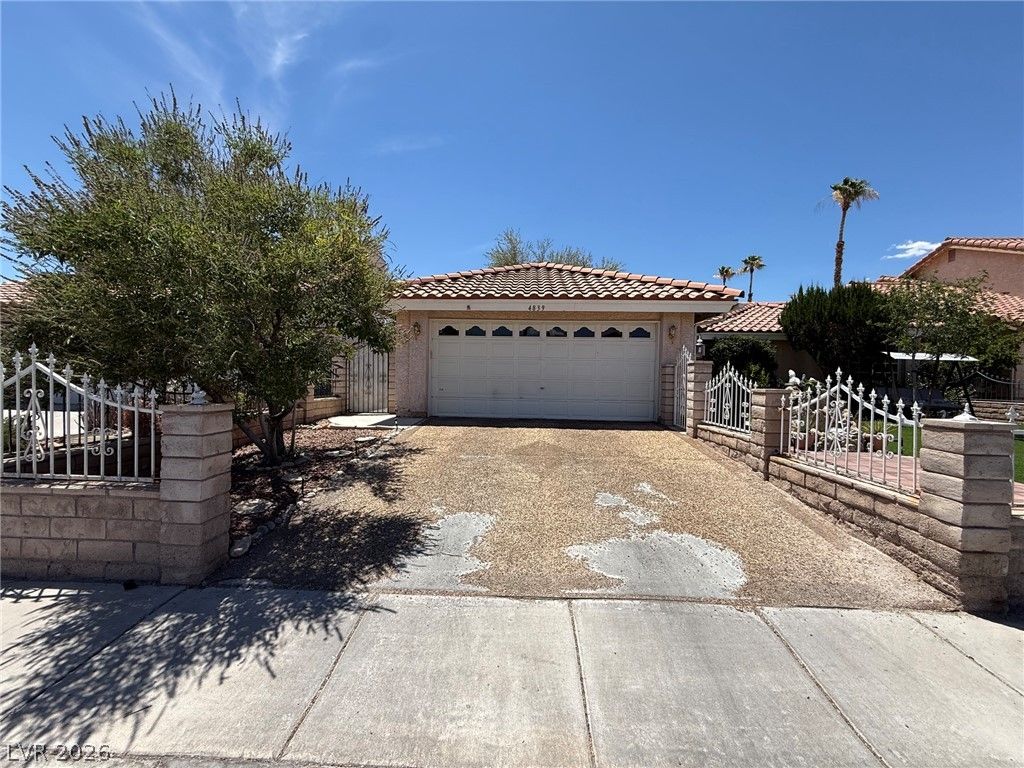
$398,0003 bd2 ba1,555 sqft$256/sqft0.18 mi8 daysSold 2026-07-31
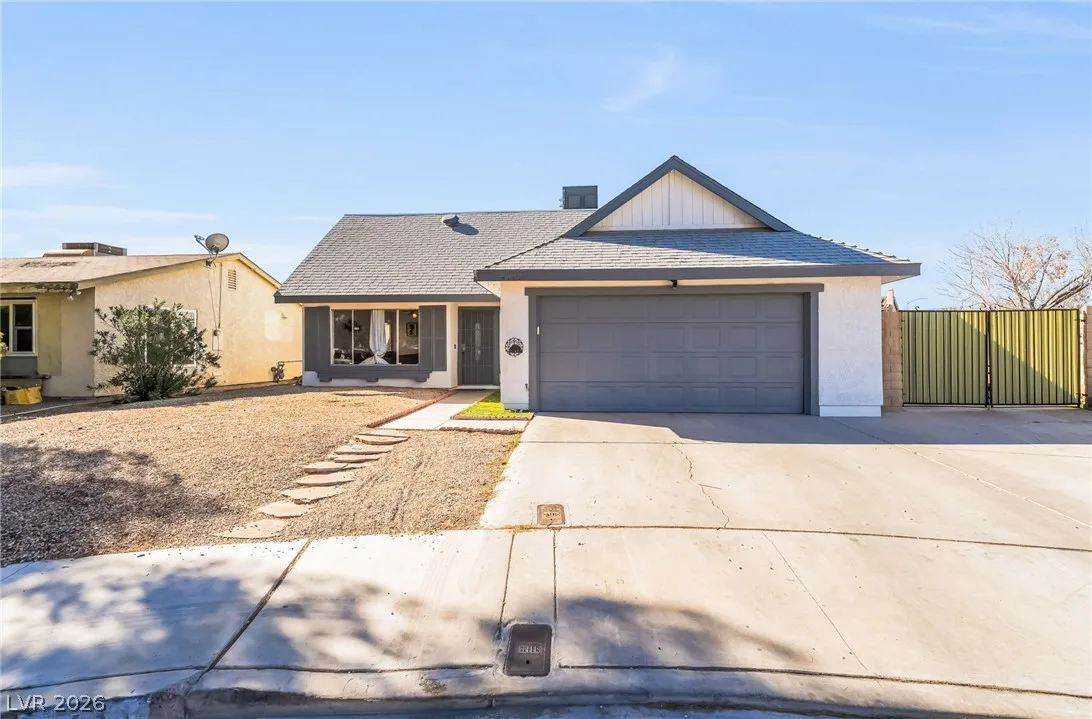
4733 Castle Rock CourtActive
$440,0004 bd3 ba1,762 sqft$250/sqft0.21 mi0 days
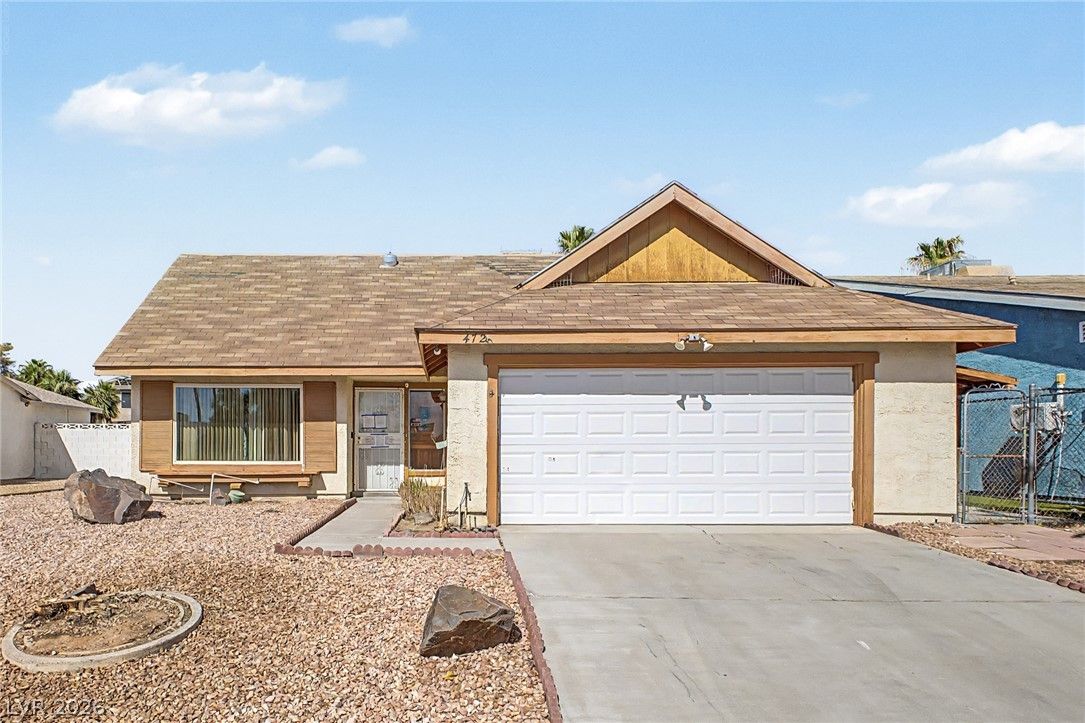
4725 Lake PlaceActive
$375,0004 bd3 ba1,692 sqft$222/sqft0.22 mi59 days
$440,0004 bd2 ba1,514 sqft$291/sqft0.22 mi7 daysSold 2026-05-01
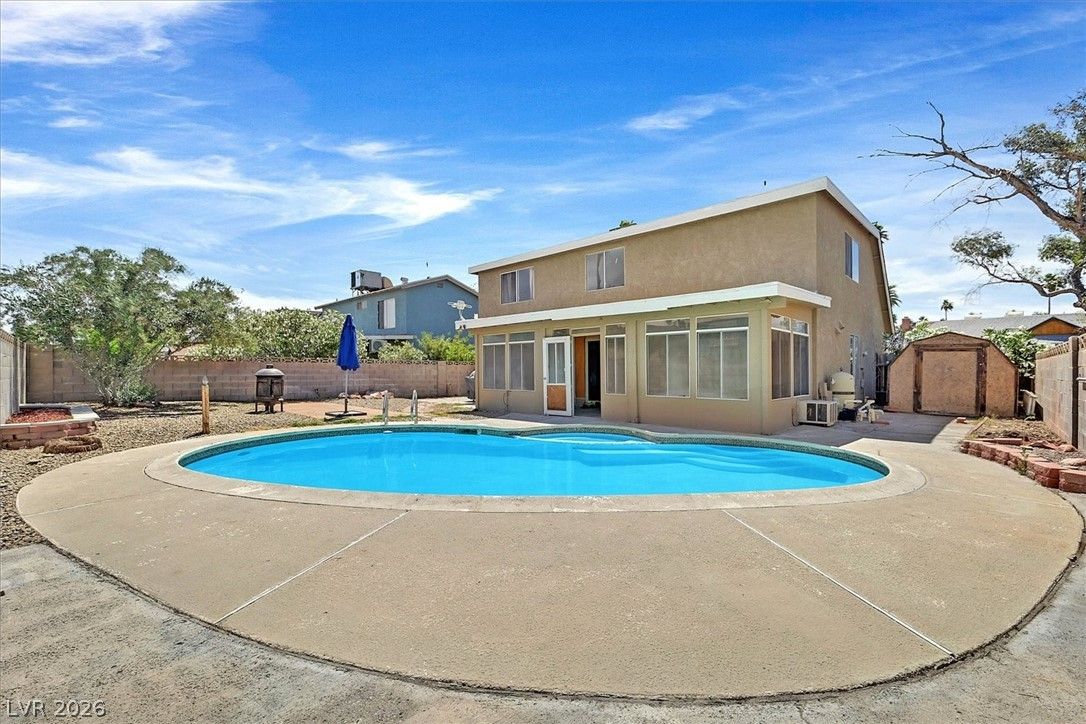
$395,0004 bd3 ba1,692 sqft$233/sqft0.22 mi16 daysSold 2026-07-24
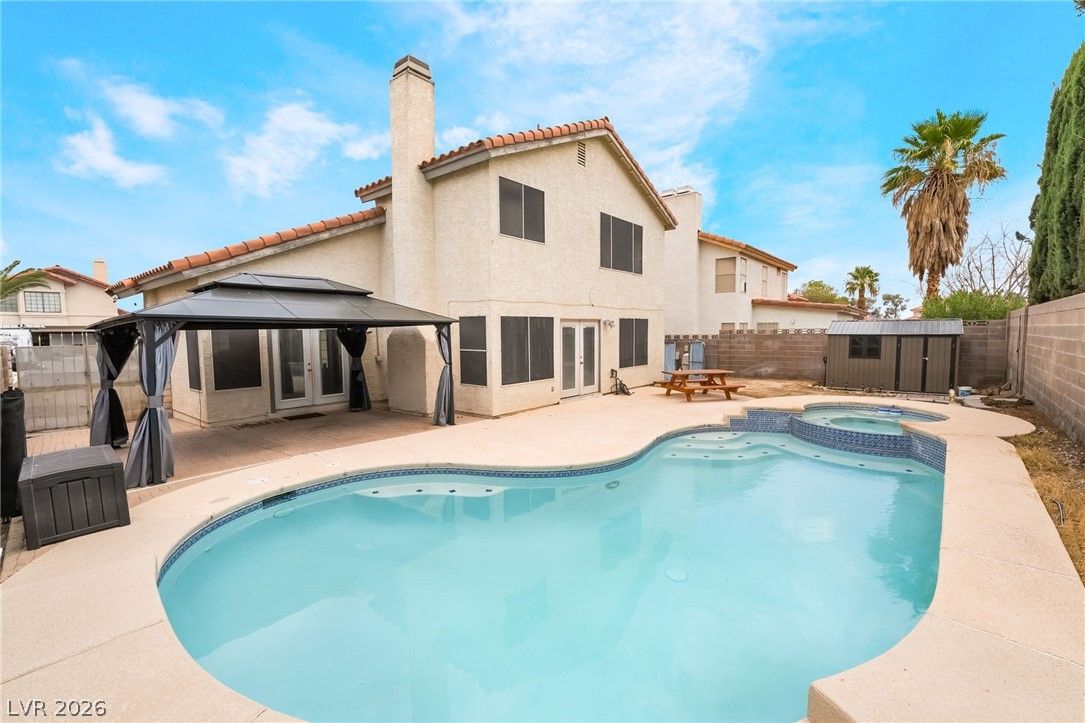
$465,0004 bd3 ba1,853 sqft$251/sqft0.25 mi18 daysSold 2026-09-01
Nearest comparable sales and listings
12 comparables · median price $405,250 · range $351,000 – $465,000 · median $/sq ft $253 · average $/sq ft $255
| Address | Status | Price | $/Sq Ft | Bd / Ba | Sq Ft | Sold / market time | Distance |
|---|---|---|---|---|---|---|---|
| 4816 Castle Rock Court | Active | $459,500 | $261 | 4 / 3 | 1,762 | 0 days on market | 0.11 mi |
| 4823 Castle Rock Court | Active | $465,000 | $264 | 4 / 3 | 1,762 | 42 days on market | 0.12 mi |
| 4785 Millbrook Court | Sold | $393,500 | $223 | 3 / 3 | 1,762 | Sold 2026-07-08 | 0.12 mi |
| 4755 Ashbrook Place | Sold | $395,000 | $258 | 4 / 2 | 1,529 | Sold 2026-07-10 | 0.17 mi |
| 4839 Beaconsfield Street | Sold | $398,000 | $256 | 3 / 2 | 1,555 | Sold 2026-07-31 | 0.18 mi |
| 4733 Castle Rock Court | Active | $440,000 | $250 | 4 / 3 | 1,762 | 0 days on market | 0.21 mi |
| 4725 Lake Place | Active | $375,000 | $222 | 4 / 3 | 1,692 | 59 days on market | 0.22 mi |
| 4755 Knollwood Drive | Sold | $440,000 | $291 | 4 / 2 | 1,514 | Sold 2026-05-01 | 0.22 mi |
| 4716 Marlboro Court | Sold | $395,000 | $233 | 4 / 3 | 1,692 | Sold 2026-07-24 | 0.22 mi |
| 4767 Beaconsfield Street | Sold | $465,000 | $251 | 4 / 3 | 1,853 | Sold 2026-09-01 | 0.25 mi |
| 7107 Fenway Avenue | Sold | $351,000 | $212 | 3 / 2 | 1,658 | Sold 2026-09-16 | 0.30 mi |
| 7112 Fenway Avenue | Active | $412,500 | $343 | 3 / 2 | 1,202 | 25 days on market | 0.32 mi |


