
Comparable Sales Near 3339 Robin Nest Court, Las Vegas, NV 89117
1st Realty · Comparable sales report · 1st.estate · October 20, 2026
Read the Spring Valley neighborhood guide →
3339 Robin Nest Court, Las Vegas, NV 89117
Status: Sold
$400,000 Sold Price
$253
$ / Sq Ft
1,582
Living Area
4,792 sqft
Lot Size
3
Beds
2
Baths
1996
Year Built
Search Parameters
Property Type
Status
Radius
Sold Within
Beds
Baths
Living Area (Sq Ft)
Lot Size (Sq Ft)
This comp search reflects your current search parameters — adjust the filters above as needed for a more accurate estimate.
Estimated Value
—
Average $/Sqft
—
Check one or more comps below to calculate an estimate.
Nearest 10 of 43 comparable sales and listings within 1 mile of this home. Use the filters above and press Search to refine.
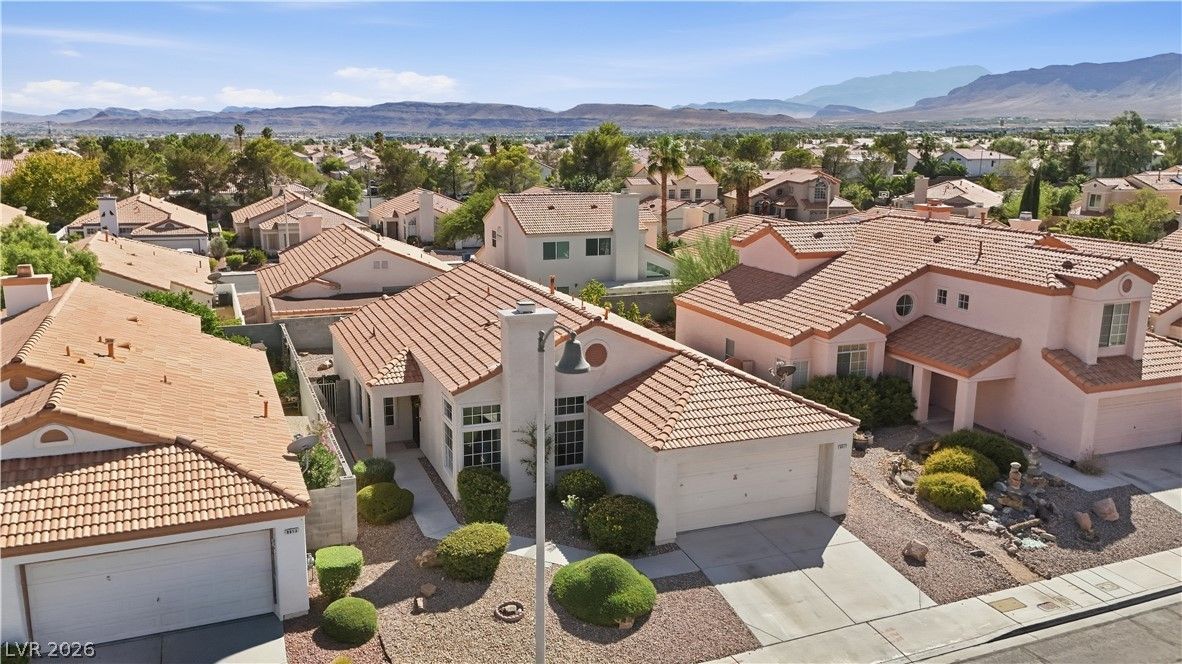
$445,0004 bd3 ba1,690 sqft$263/sqft0.06 mi6 daysSold 2026-05-04
9817 Cross Creek WayActive
$465,0003 bd2 ba1,614 sqft$288/sqft0.14 mi14 days
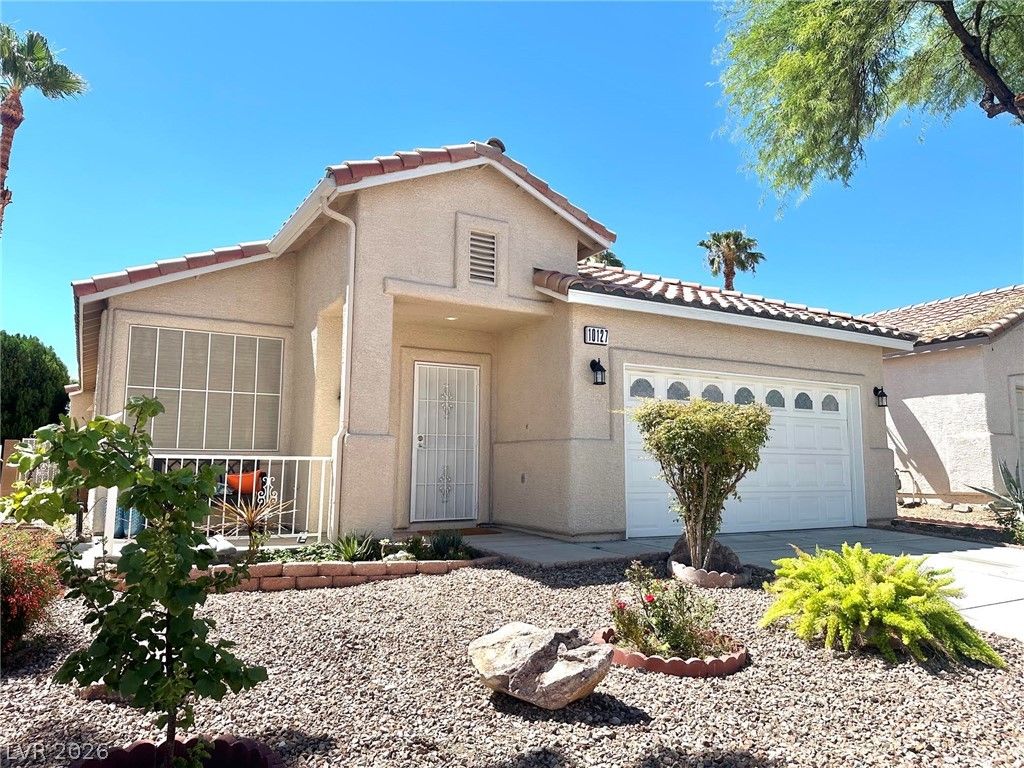
$495,0003 bd2 ba1,582 sqft$313/sqft0.15 mi18 daysSold 2026-10-09
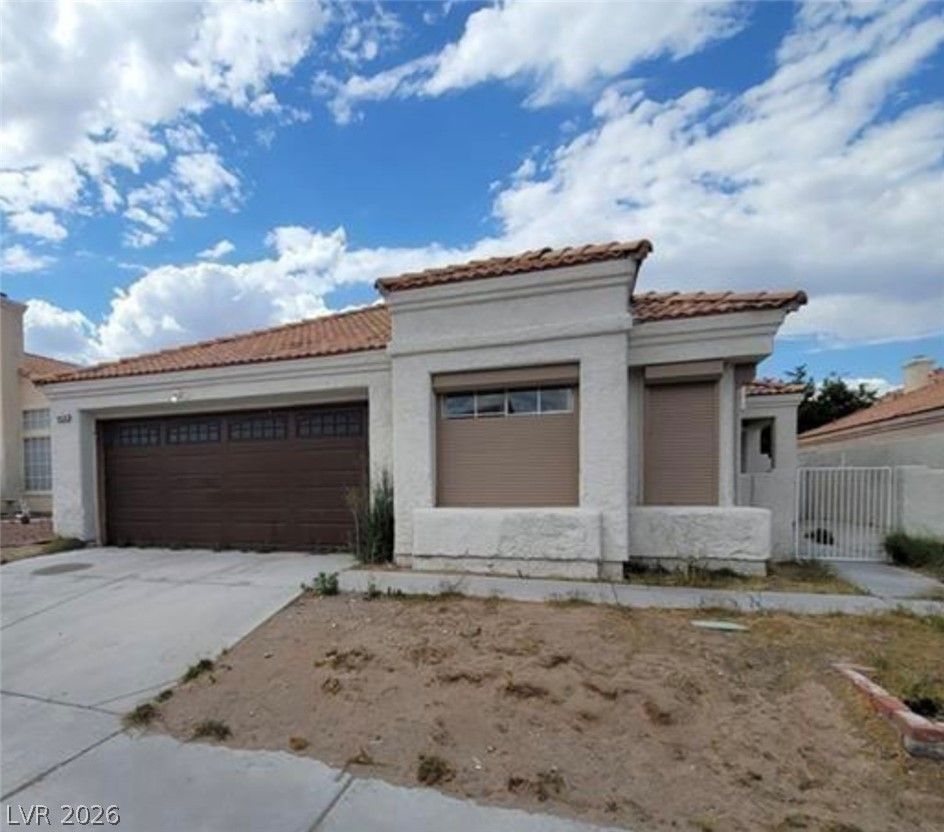
9820 Cross Creek WayActive
$579,9003 bd2 ba1,789 sqft$324/sqft0.17 mi0 days
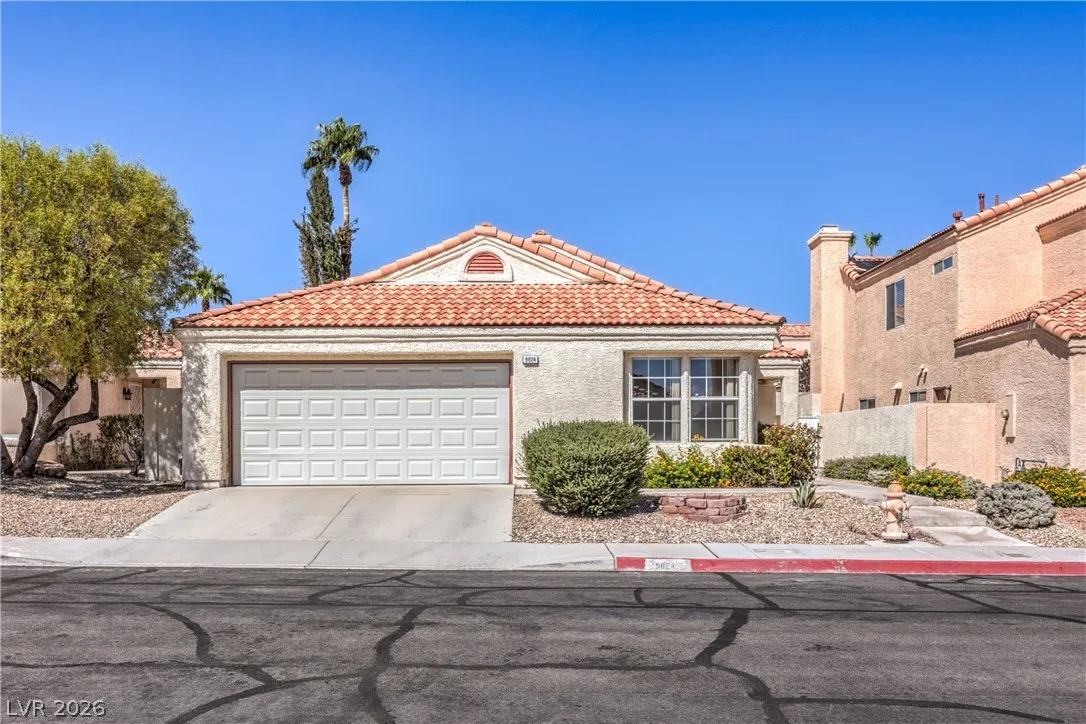
9824 Russett Wood CircleUnder Contract
$399,0003 bd2 ba1,789 sqft$223/sqft0.20 mi2 days
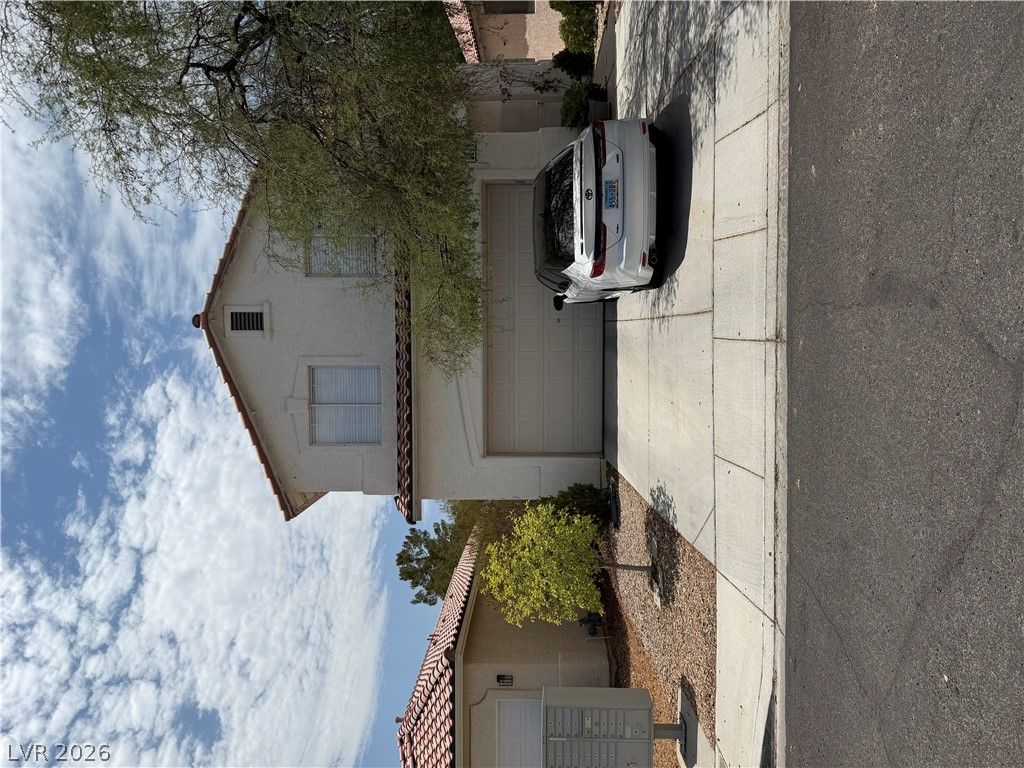
$440,0004 bd3 ba1,833 sqft$240/sqft0.28 mi29 daysSold 2026-09-03
$480,0003 bd2 ba1,614 sqft$297/sqft0.29 mi22 daysSold 2026-06-16
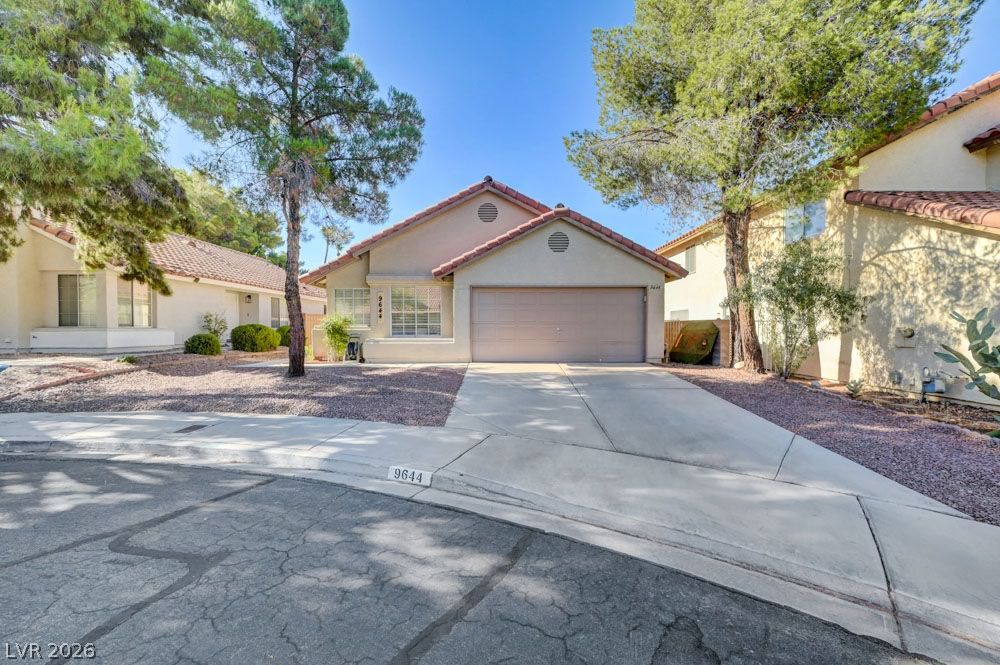
$412,0002 bd2 ba1,284 sqft$321/sqft0.30 mi3 daysSold 2026-07-30
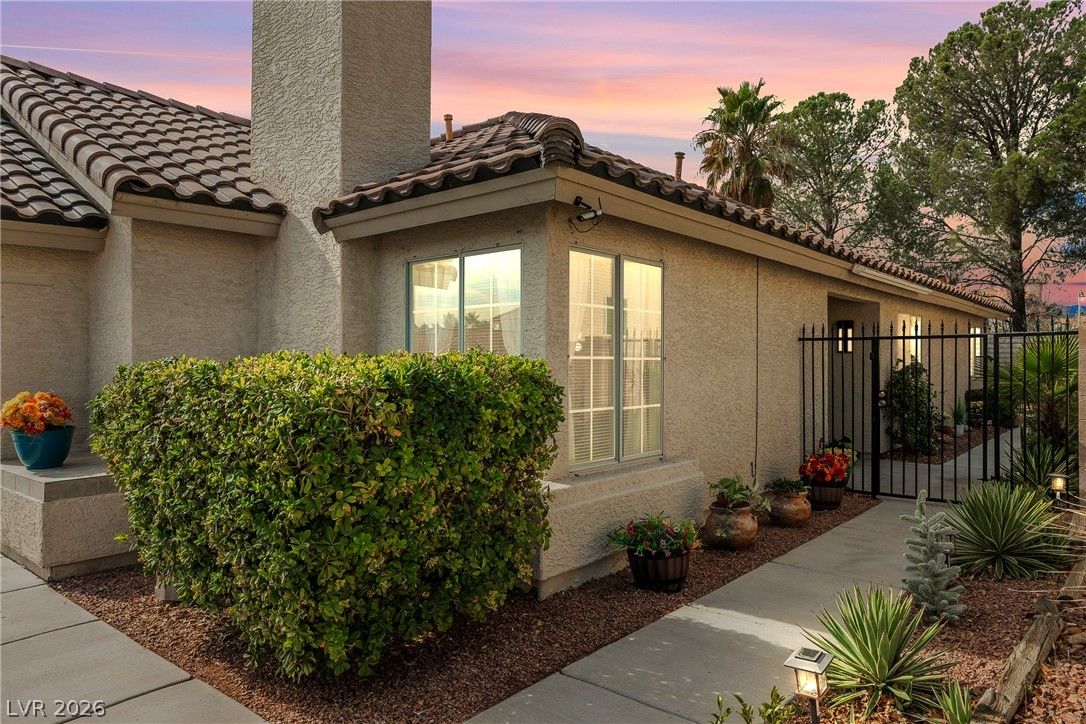
3213 Oyster Bay StreetActive
$444,9993 bd2 ba1,350 sqft$330/sqft0.35 mi0 days
$415,0003 bd2 ba1,389 sqft$299/sqft0.36 mi21 daysSold 2026-05-27
Nearest comparable sales and listings
12 comparables · median price $445,000 · range $399,000 – $579,900 · median $/sq ft $298 · average $/sq ft $293
| Address | Status | Price | $/Sq Ft | Bd / Ba | Sq Ft | Sold / market time | Distance |
|---|---|---|---|---|---|---|---|
| 10008 Yellow Canary Avenue | Sold | $445,000 | $263 | 4 / 3 | 1,690 | Sold 2026-05-04 | 0.06 mi |
| 9817 Cross Creek Way | Active | $465,000 | $288 | 3 / 2 | 1,614 | 14 days on market | 0.14 mi |
| 10127 Sparrow Ridge Avenue | Sold | $495,000 | $313 | 3 / 2 | 1,582 | Sold 2026-10-09 | 0.15 mi |
| 9820 Cross Creek Way | Active | $579,900 | $324 | 3 / 2 | 1,789 | 0 days on market | 0.17 mi |
| 9824 Russett Wood Circle | Under Contract | $399,000 | $223 | 3 / 2 | 1,789 | 2 days on market | 0.20 mi |
| 3549 April Springs Street | Sold | $440,000 | $240 | 4 / 3 | 1,833 | Sold 2026-09-03 | 0.28 mi |
| 9705 Great Bend Drive | Sold | $480,000 | $297 | 3 / 2 | 1,614 | Sold 2026-06-16 | 0.29 mi |
| 9644 Swan Bay Drive | Sold | $412,000 | $321 | 2 / 2 | 1,284 | Sold 2026-07-30 | 0.30 mi |
| 3213 Oyster Bay Street | Active | $444,999 | $330 | 3 / 2 | 1,350 | 0 days on market | 0.35 mi |
| 10040 Peach Flower Court | Sold | $415,000 | $299 | 3 / 2 | 1,389 | Sold 2026-05-27 | 0.36 mi |
| 10011 Peach Flower Court | Active | $459,900 | $331 | 3 / 2 | 1,389 | 0 days on market | 0.39 mi |
| 3300 Haven Beach Way | Sold | $405,000 | $292 | 3 / 2 | 1,385 | Sold 2026-06-16 | 0.39 mi |


