
Comparable Sales Near 59 Ginger Lily Terrace, Henderson, NV 89074
1st Realty · Comparable sales report · 1st.estate · October 20, 2026
Read the Henderson area guide →
59 Ginger Lily Terrace, Henderson, NV 89074
Status: Sold
$405,000 Sold Price
$203
$ / Sq Ft
1,996
Living Area
5,227 sqft
Lot Size
4
Beds
3
Baths
1991
Year Built
Search Parameters
Property Type
Status
Radius
Sold Within
Beds
Baths
Living Area (Sq Ft)
Lot Size (Sq Ft)
This comp search reflects your current search parameters — adjust the filters above as needed for a more accurate estimate.
Estimated Value
—
Average $/Sqft
—
Check one or more comps below to calculate an estimate.
Nearest 10 of 45 comparable sales and listings within 1 mile of this home. Use the filters above and press Search to refine.
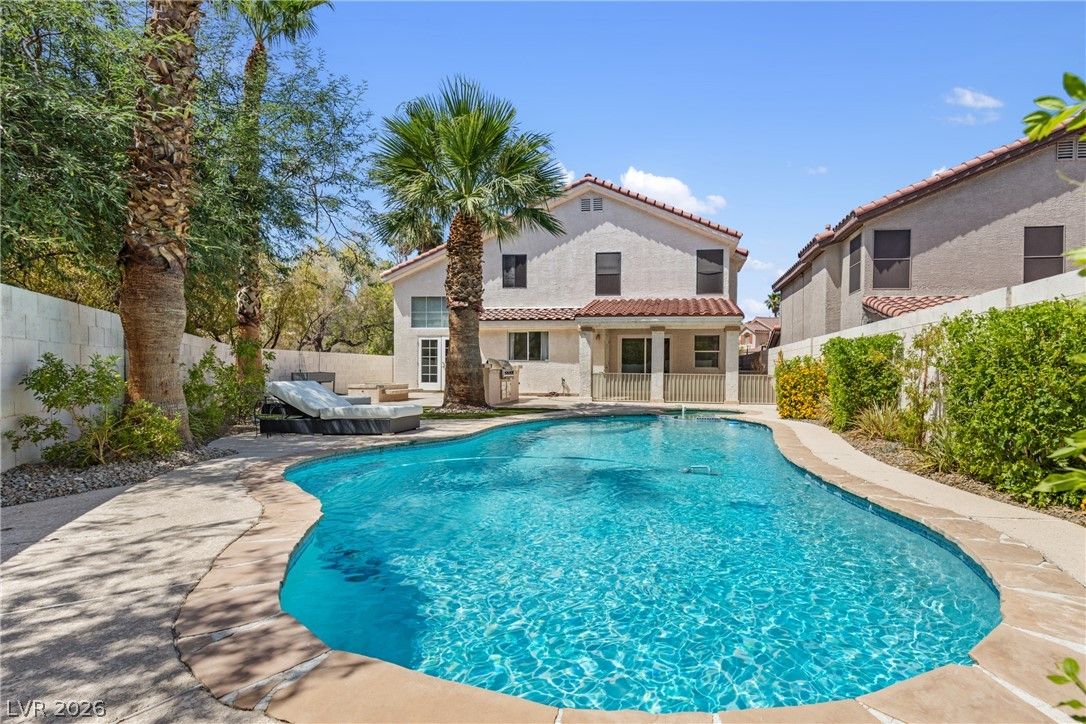
$535,0003 bd3 ba2,059 sqft$260/sqft0.07 mi21 daysSold 2026-09-16
$460,0003 bd3 ba1,883 sqft$244/sqft0.11 mi1 daysSold 2026-05-13
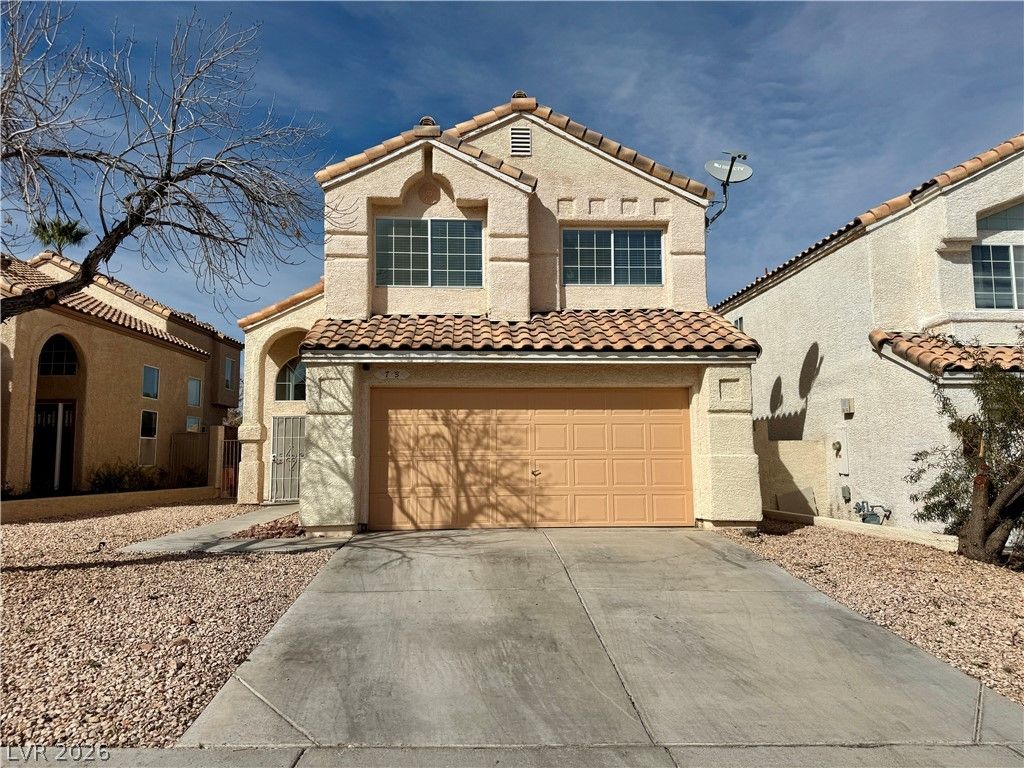
73 Sea Holly WaySold
$402,0003 bd3 ba1,680 sqft$239/sqft0.13 mi149 daysSold 2026-08-18
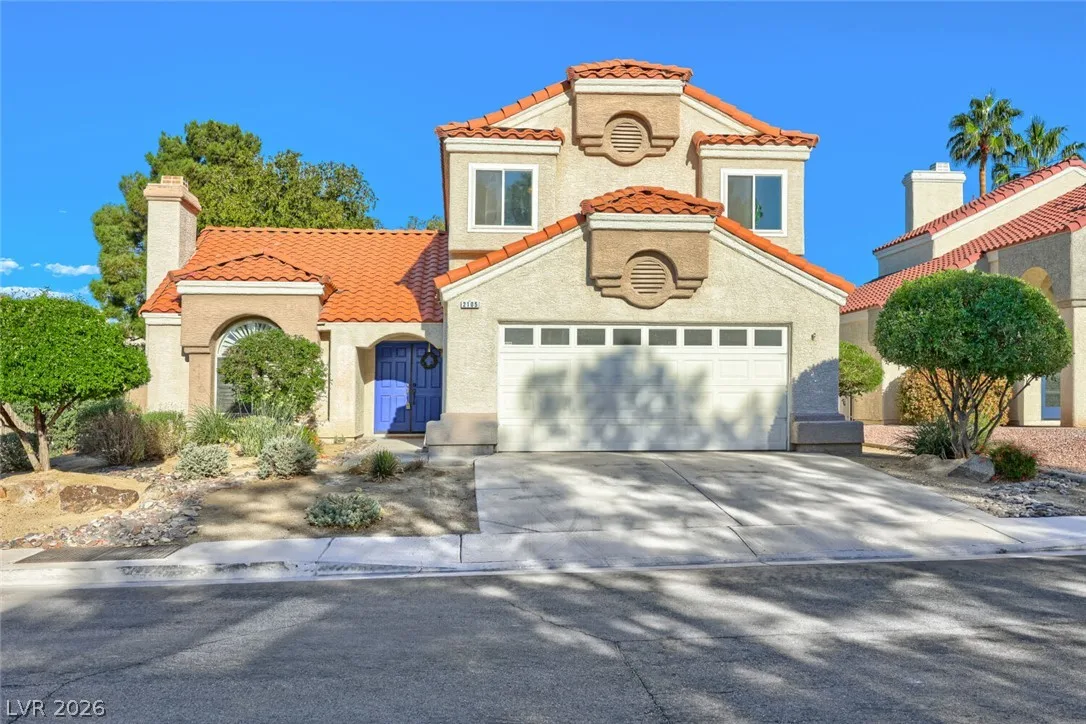
$420,0003 bd3 ba1,761 sqft$239/sqft0.18 mi5 days
$456,0004 bd3 ba1,949 sqft$234/sqft0.21 mi88 daysSold 2026-06-12
$588,0004 bd3 ba2,141 sqft$275/sqft0.26 mi5 daysSold 2026-04-24
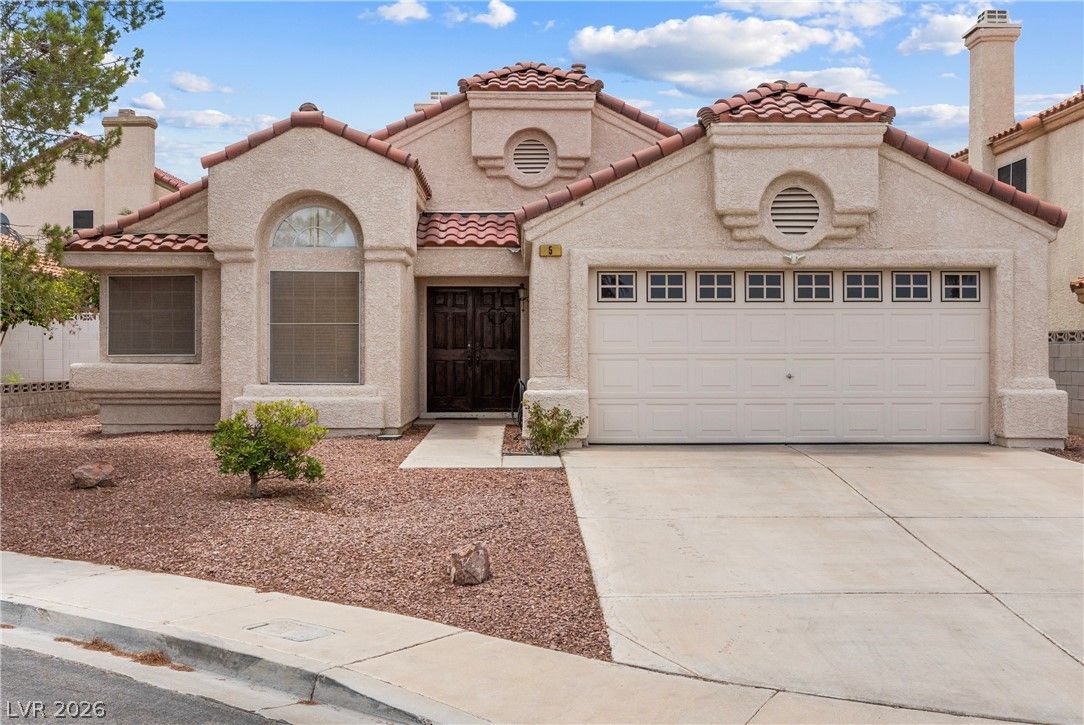
5 Barton Spring CircleActive
$444,0003 bd2 ba1,603 sqft$277/sqft0.30 mi29 days
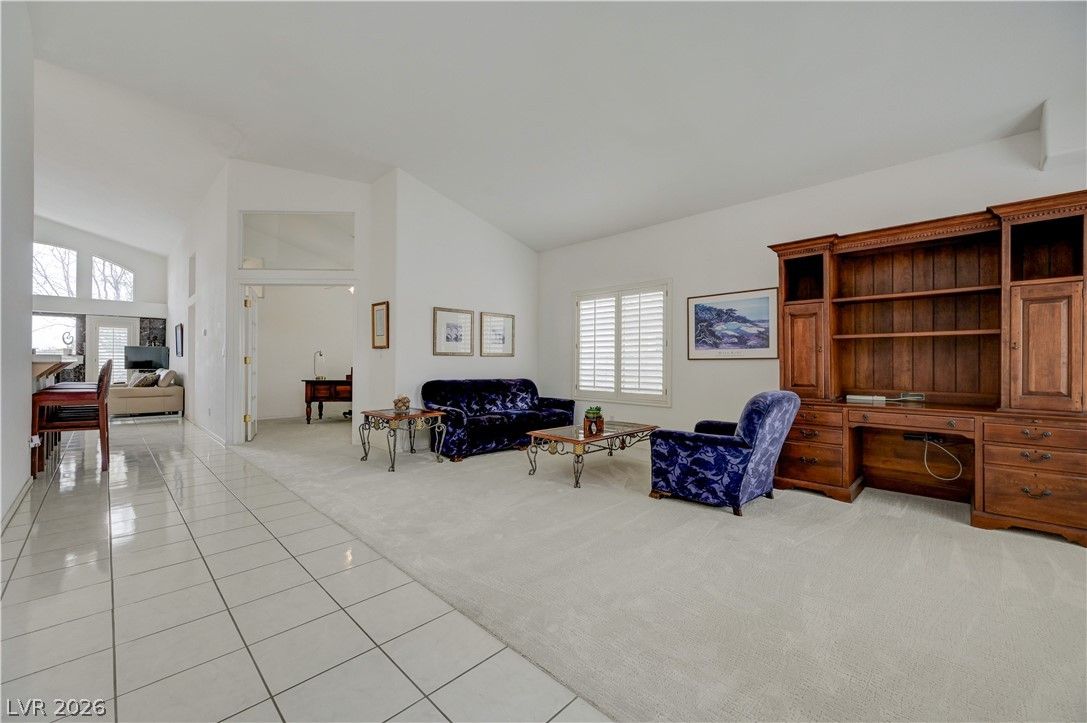
103 Eagleview CourtActive
$478,0003 bd2 ba1,708 sqft$280/sqft0.30 mi54 days
$535,0003 bd2 ba1,554 sqft$344/sqft0.31 mi3 daysSold 2026-06-01
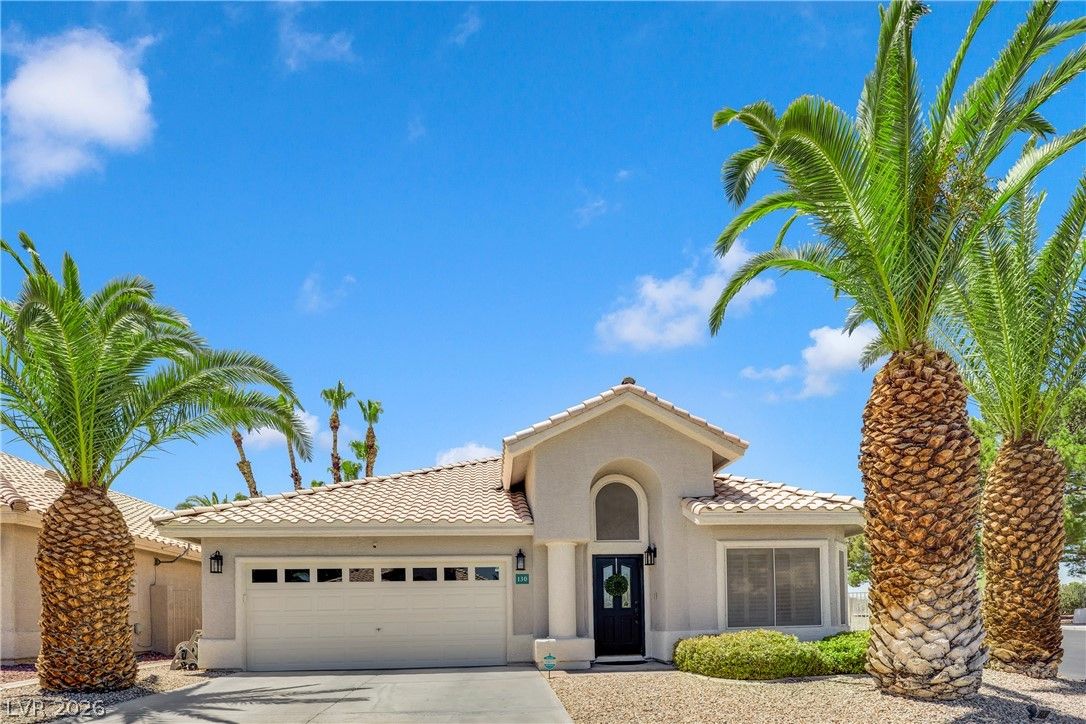
$545,0003 bd2 ba1,695 sqft$322/sqft0.32 mi17 daysSold 2026-07-31
Nearest comparable sales and listings
12 comparables · median price $481,450 · range $402,000 – $588,000 · median $/sq ft $276 · average $/sq ft $277
| Address | Status | Price | $/Sq Ft | Bd / Ba | Sq Ft | Sold / market time | Distance |
|---|---|---|---|---|---|---|---|
| 66 Huntfield Drive | Sold | $535,000 | $260 | 3 / 3 | 2,059 | Sold 2026-09-16 | 0.07 mi |
| 80 Huntfield Drive | Sold | $460,000 | $244 | 3 / 3 | 1,883 | Sold 2026-05-13 | 0.11 mi |
| 73 Sea Holly Way | Sold | $402,000 | $239 | 3 / 3 | 1,680 | Sold 2026-08-18 | 0.13 mi |
| 2105 Fountain Springs Drive | Active | $420,000 | $239 | 3 / 3 | 1,761 | 5 days on market | 0.18 mi |
| 2132 Polynesia Circle | Sold | $456,000 | $234 | 4 / 3 | 1,949 | Sold 2026-06-12 | 0.21 mi |
| 8 Richland Acres Court | Sold | $588,000 | $275 | 4 / 3 | 2,141 | Sold 2026-04-24 | 0.26 mi |
| 5 Barton Spring Circle | Active | $444,000 | $277 | 3 / 2 | 1,603 | 29 days on market | 0.30 mi |
| 103 Eagleview Court | Active | $478,000 | $280 | 3 / 2 | 1,708 | 54 days on market | 0.30 mi |
| 133 Wildhorn Court | Sold | $535,000 | $344 | 3 / 2 | 1,554 | Sold 2026-06-01 | 0.31 mi |
| 130 Wildhorn Court | Sold | $545,000 | $322 | 3 / 2 | 1,695 | Sold 2026-07-31 | 0.32 mi |
| 2146 Eaglepath Circle | Active | $484,900 | $312 | 3 / 2 | 1,554 | 79 days on market | 0.33 mi |
| 2154 Eaglepath Circle | Active | $497,000 | $293 | 3 / 2 | 1,695 | 30 days on market | 0.35 mi |


