
Comparable Sales Near 5260 Janfred Court 11, Las Vegas, NV 89103
1st Realty · Comparable sales report · 1st.estate · October 20, 2026
Read the Spring Valley neighborhood guide →
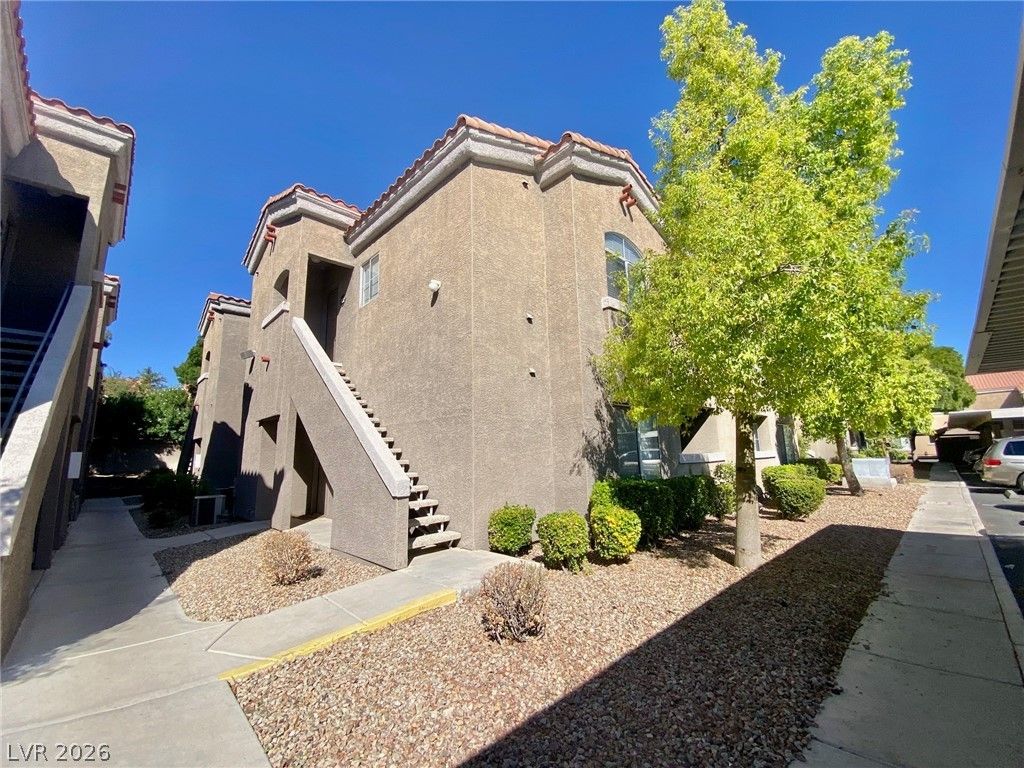
5260 Janfred Court 11, Las Vegas, NV 89103
Status: Sold
$205,000 Sold Price
$190
$ / Sq Ft
1,080
Living Area
4,439 sqft
Lot Size
2
Beds
2
Baths
1983
Year Built
Search Parameters
Property Type
Status
Radius
Sold Within
Beds
Baths
Living Area (Sq Ft)
Lot Size (Sq Ft)
This comp search reflects your current search parameters — adjust the filters above as needed for a more accurate estimate.
Estimated Value
—
Average $/Sqft
—
Check one or more comps below to calculate an estimate.
Nearest 10 of 23 comparable sales and listings within 1 mile of this home. Use the filters above and press Search to refine.
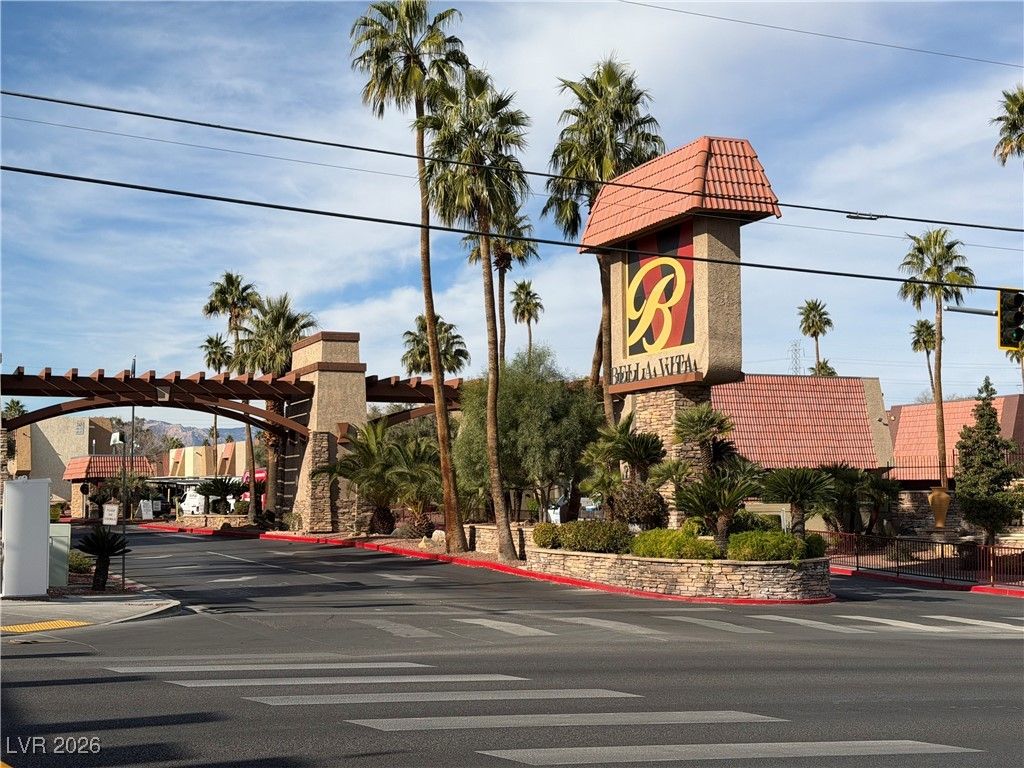
$210,0002 bd2 ba978 sqft$215/sqft0.13 mi26 days
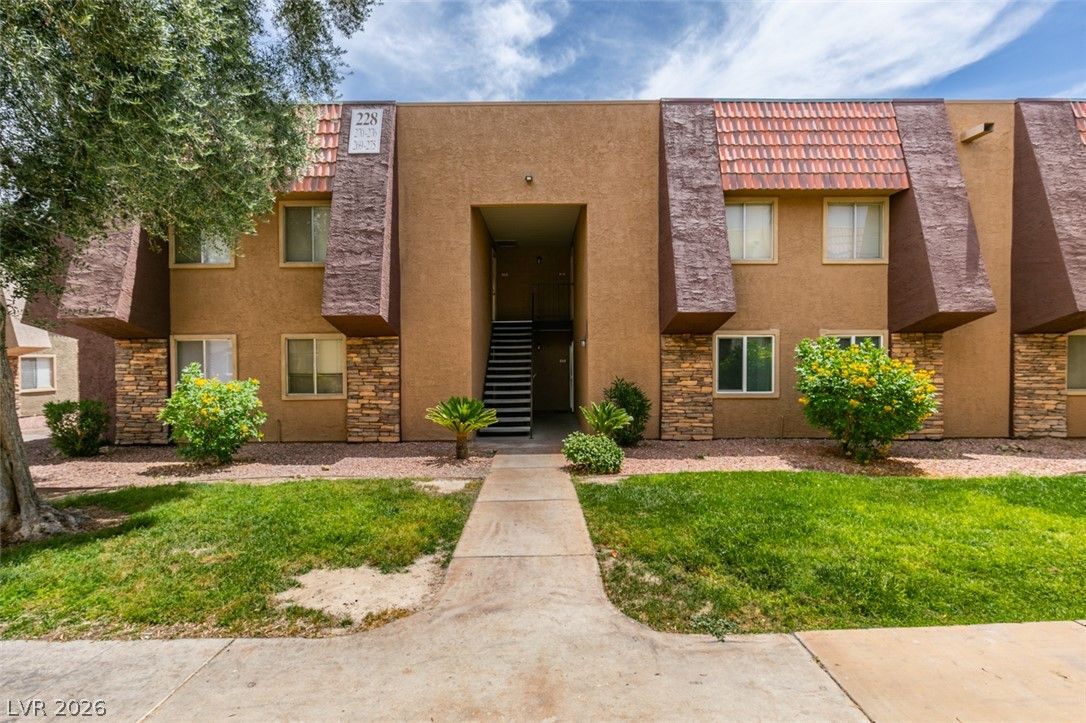
$189,0002 bd2 ba978 sqft$193/sqft0.13 mi2 days
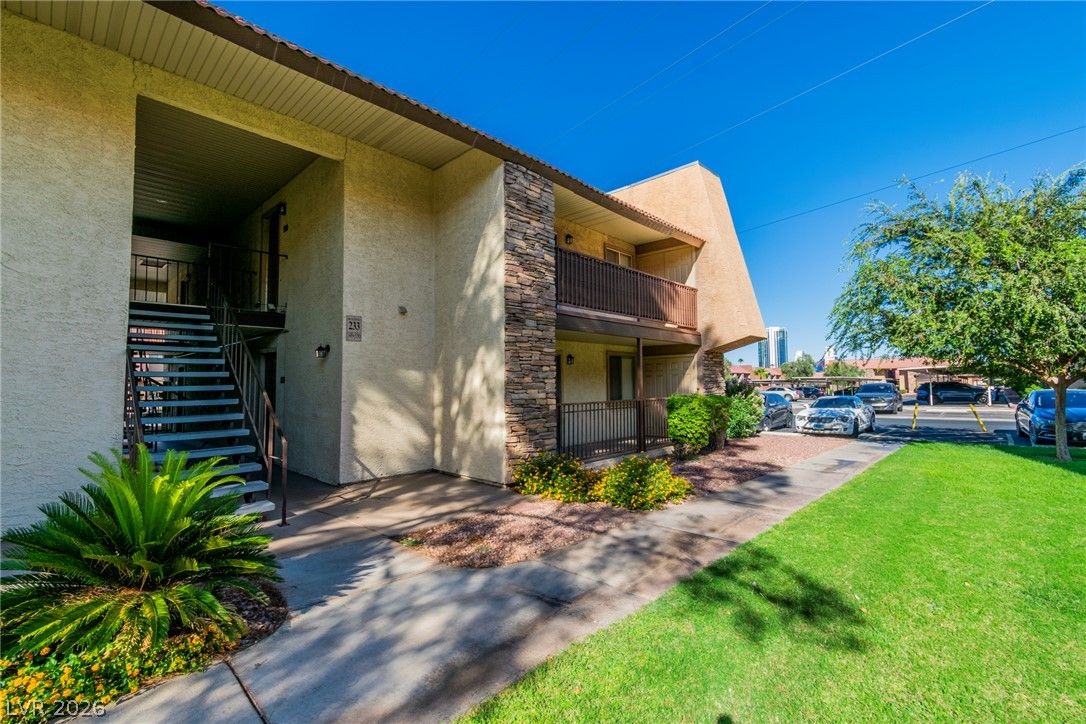
$190,0002 bd1 ba816 sqft$233/sqft0.15 mi0 days
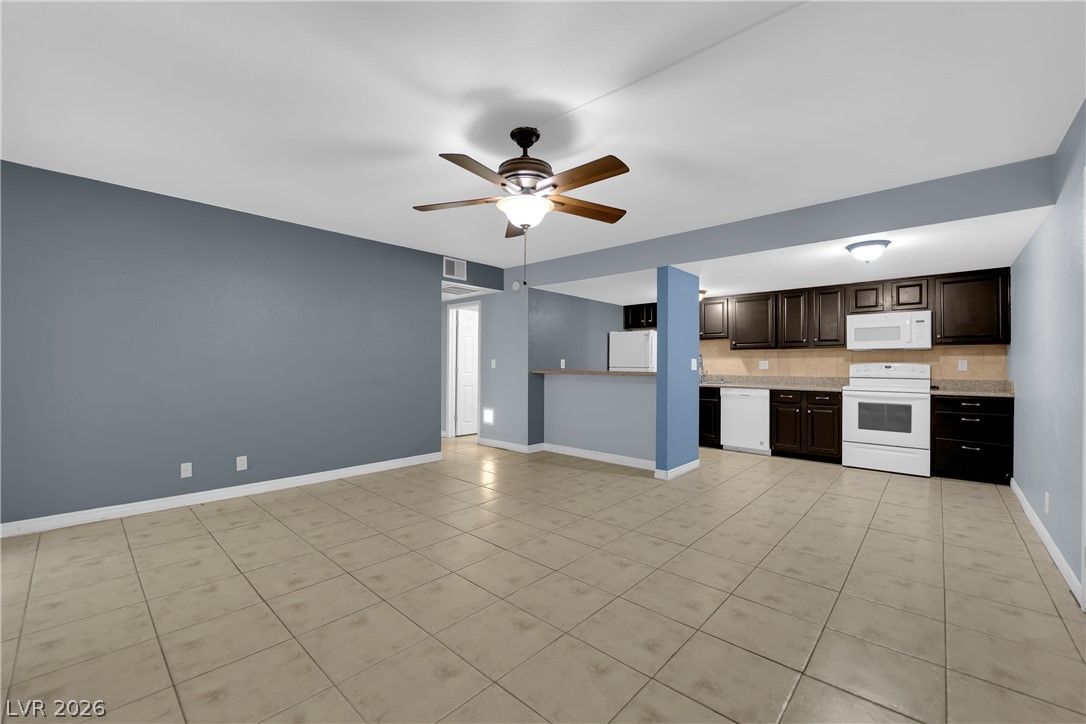
$160,0002 bd1 ba816 sqft$196/sqft0.23 mi22 days
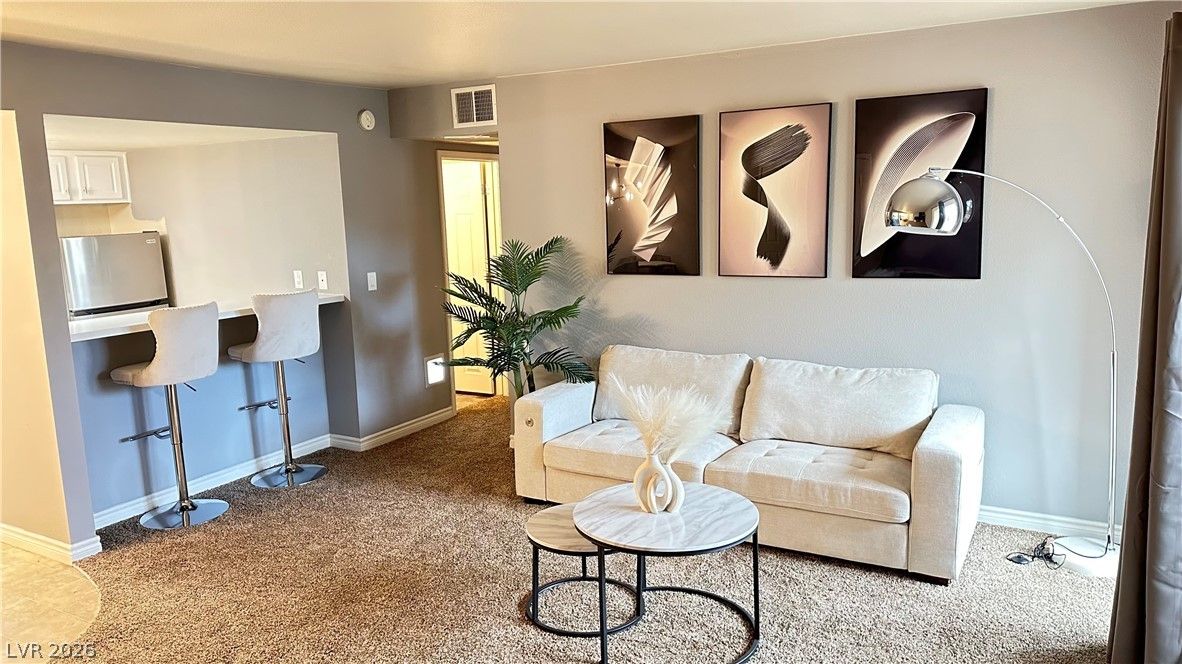
$250,0002 bd1 ba816 sqft$306/sqft0.27 mi6 days
$150,0002 bd1 ba816 sqft$184/sqft0.31 mi21 daysSold 2026-05-27
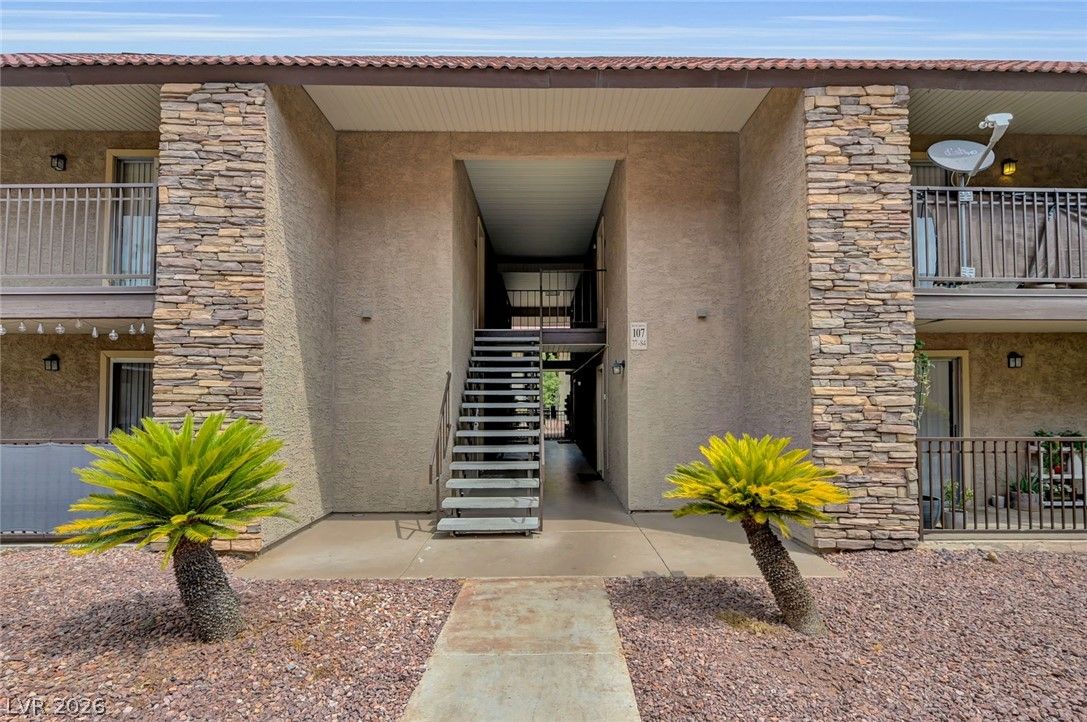
$165,0002 bd1 ba816 sqft$202/sqft0.34 mi28 days
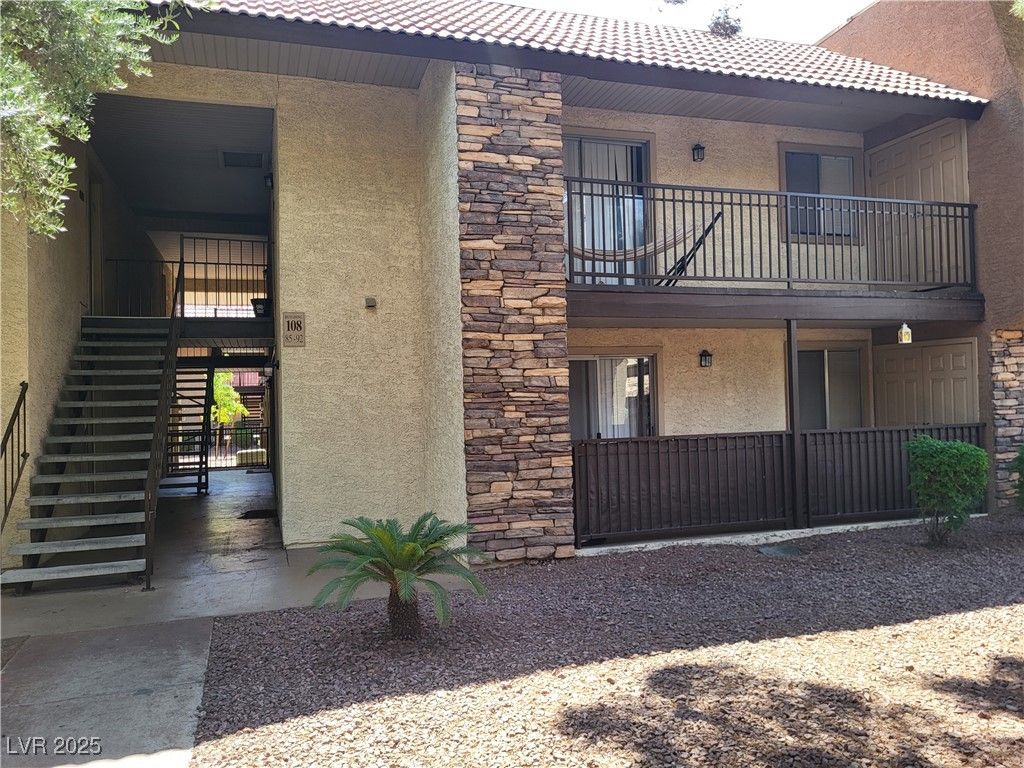
(no address on file)Active
$185,0002 bd1 ba816 sqft$227/sqft0.35 mi359 days
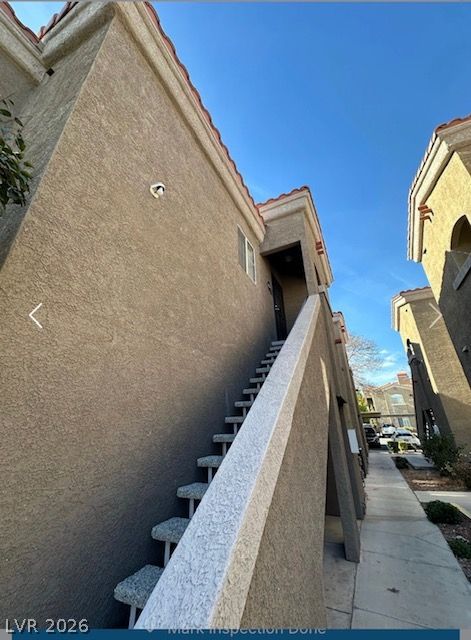
$179,0001 bd1 ba870 sqft$206/sqft0.46 mi1 days
$160,0001 bd1 ba870 sqft$184/sqft0.48 mi119 days
Nearest comparable sales and listings
12 comparables · median price $185,000 · range $150,000 – $250,000 · median $/sq ft $204 · average $/sq ft $212
| Address | Status | Price | $/Sq Ft | Bd / Ba | Sq Ft | Sold / market time | Distance |
|---|---|---|---|---|---|---|---|
| 5240 Indian River Drive 274 | Active | $210,000 | $215 | 2 / 2 | 978 | 26 days on market | 0.13 mi |
| 5240 Indian River Drive 273 | Active | $189,000 | $193 | 2 / 2 | 978 | 2 days on market | 0.13 mi |
| 5180 Indian River Drive 356 | Active | $190,000 | $233 | 2 / 1 | 816 | 0 days on market | 0.15 mi |
| 5242 River Glen Drive 439 | Active | $160,000 | $196 | 2 / 1 | 816 | 22 days on market | 0.23 mi |
| 4410 Sandy River Drive 23 | Active | $250,000 | $306 | 2 / 1 | 816 | 6 days on market | 0.27 mi |
| 4370 Sandy River Drive 24 | Sold | $150,000 | $184 | 2 / 1 | 816 | Sold 2026-05-27 | 0.31 mi |
| 4340 Sandy River Drive 84 | Active | $165,000 | $202 | 2 / 1 | 816 | 28 days on market | 0.34 mi |
| (no address on file) | Active | $185,000 | $227 | 2 / 1 | 816 | 359 days on market | 0.35 mi |
| 5525 West Flamingo Road 2029 | Active | $179,000 | $206 | 1 / 1 | 870 | 1 days on market | 0.46 mi |
| 5525 West Flamingo Road 2009 | Active | $160,000 | $184 | 1 / 1 | 870 | 119 days on market | 0.48 mi |
| 4400 South Jones Boulevard 1128 | Sold | $220,000 | $221 | 2 / 2 | 994 | Sold 2026-09-28 | 0.53 mi |
| 4955 Lindell Road 218 | Sold | $185,000 | $180 | 2 / 2 | 1,027 | Sold 2026-09-29 | 0.61 mi |


