
Comparable Sales Near 214 Rolling Desert Street, Henderson, NV 89012
1st Realty · Comparable sales report · 1st.estate · October 20, 2026
Read the Henderson area guide →
214 Rolling Desert Street, Henderson, NV 89012
Status: Sold
$595,000 Sold Price
$247
$ / Sq Ft
2,405
Living Area
7,405 sqft
Lot Size
3
Beds
3
Baths
2007
Year Built
Search Parameters
Property Type
Status
Radius
Sold Within
Beds
Baths
Living Area (Sq Ft)
Lot Size (Sq Ft)
This comp search reflects your current search parameters — adjust the filters above as needed for a more accurate estimate.
Estimated Value
—
Average $/Sqft
—
Check one or more comps below to calculate an estimate.
Nearest 10 of 34 comparable sales and listings within 1 mile of this home. Use the filters above and press Search to refine.
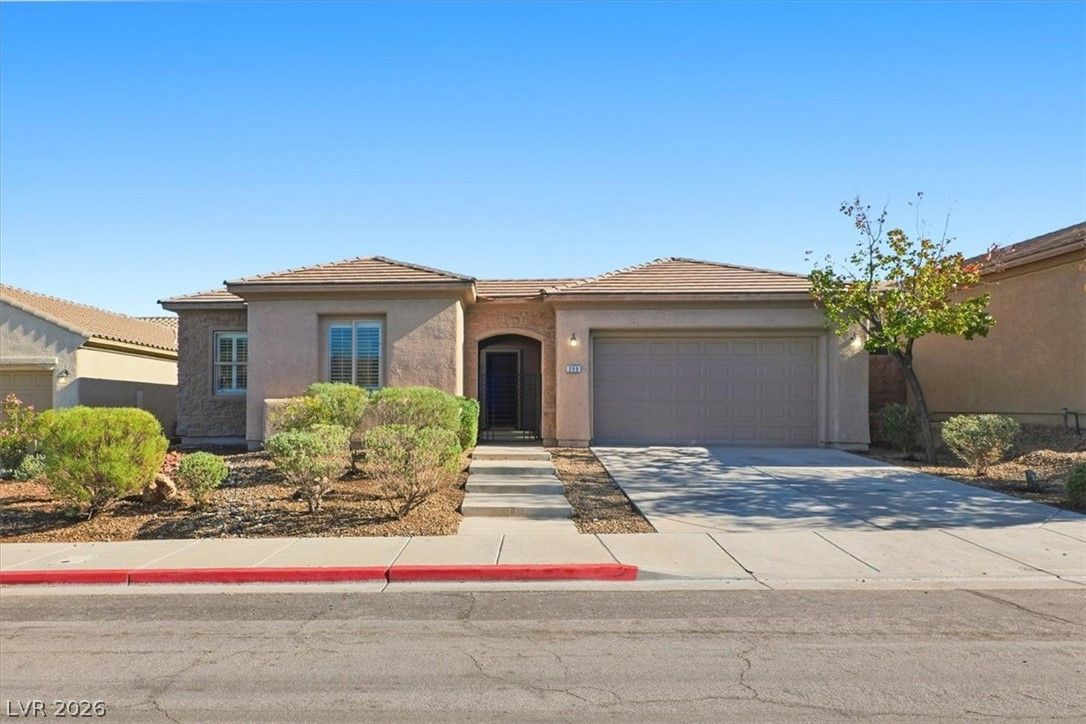
$724,9003 bd3 ba2,692 sqft$269/sqft0.06 mi25 days
$500,0003 bd3 ba2,075 sqft$241/sqft0.10 mi4 daysSold 2026-05-08
$700,0004 bd2 ba2,582 sqft$271/sqft0.10 mi138 daysSold 2026-07-20

1074 Parkington AvenueActive
$799,0004 bd3 ba2,430 sqft$329/sqft0.11 mi14 days
$450,0004 bd3 ba2,075 sqft$217/sqft0.20 mi27 daysSold 2026-05-08
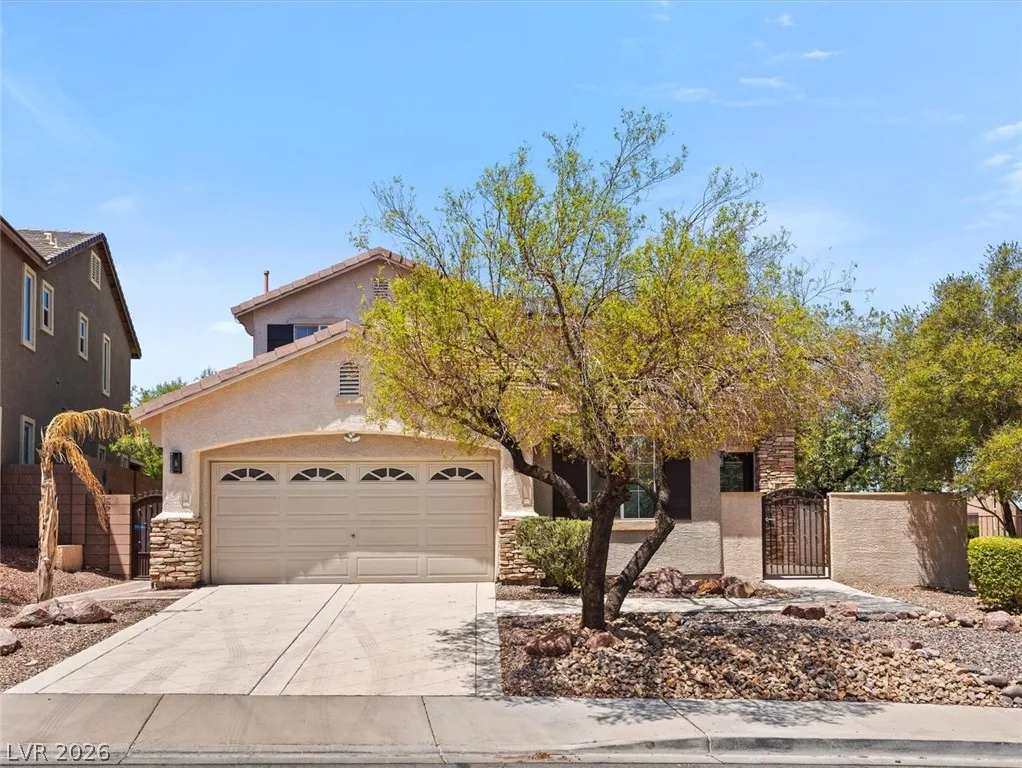
215 Sunset Shower DriveActive
$670,0003 bd3 ba2,186 sqft$306/sqft0.23 mi0 days
$565,0003 bd2 ba2,118 sqft$267/sqft0.31 mi23 daysSold 2026-05-18
$518,0004 bd3 ba2,076 sqft$250/sqft0.38 mi2 daysSold 2026-06-26
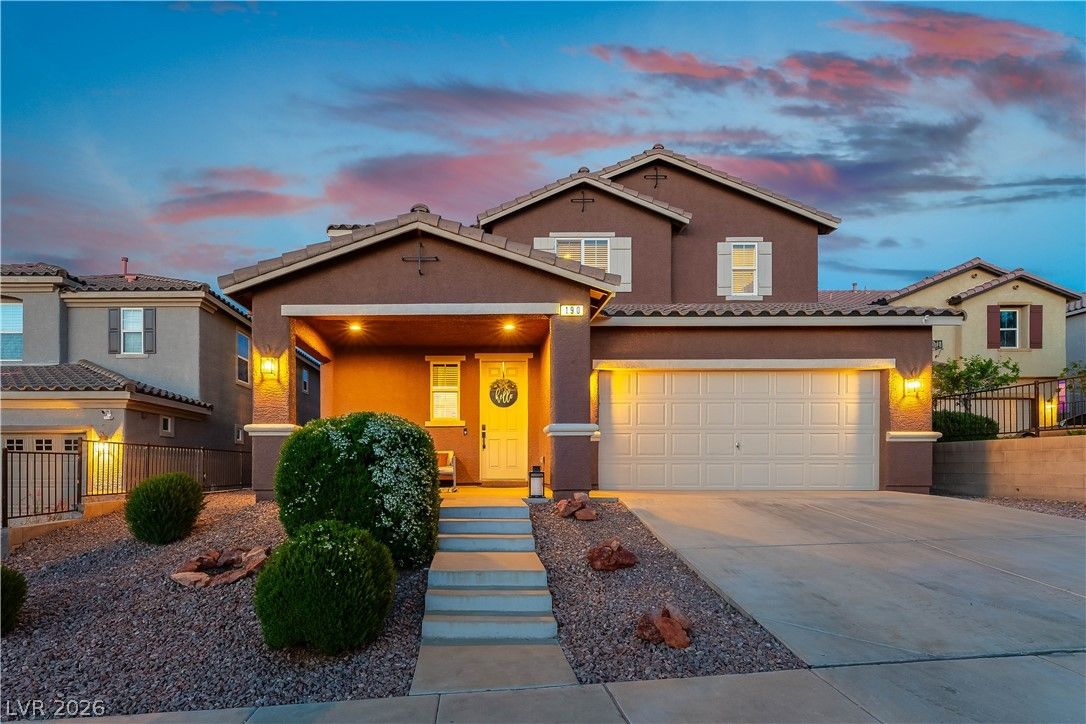
$650,0004 bd4 ba2,615 sqft$249/sqft0.38 mi63 daysSold 2026-08-05
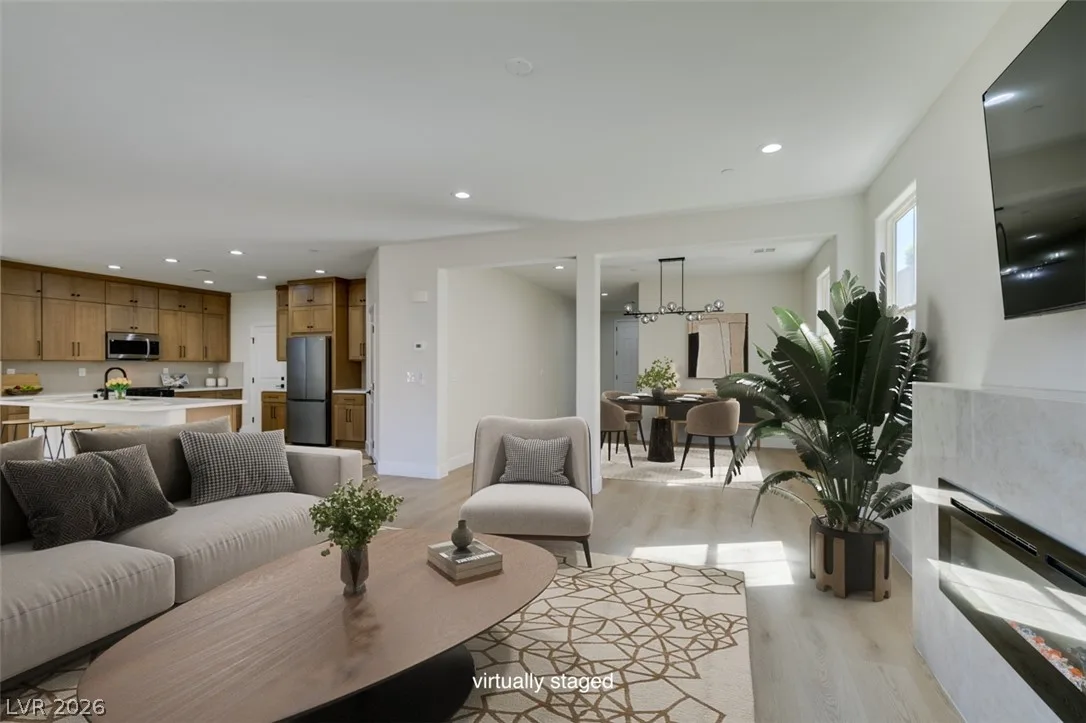
197 Sicily Hills CourtActive
$649,8883 bd3 ba2,429 sqft$268/sqft0.40 mi13 days
Nearest comparable sales and listings
12 comparables · median price $614,944 · range $450,000 – $799,000 · median $/sq ft $267 · average $/sq ft $262
| Address | Status | Price | $/Sq Ft | Bd / Ba | Sq Ft | Sold / market time | Distance |
|---|---|---|---|---|---|---|---|
| 208 Palmetto Pointe Drive | Active | $724,900 | $269 | 3 / 3 | 2,692 | 25 days on market | 0.06 mi |
| 195 Falling Stones Court | Sold | $500,000 | $241 | 3 / 3 | 2,075 | Sold 2026-05-08 | 0.10 mi |
| 220 Palmetto Pointe Drive | Sold | $700,000 | $271 | 4 / 2 | 2,582 | Sold 2026-07-20 | 0.10 mi |
| 1074 Parkington Avenue | Active | $799,000 | $329 | 4 / 3 | 2,430 | 14 days on market | 0.11 mi |
| 188 Timeless View Court | Sold | $450,000 | $217 | 4 / 3 | 2,075 | Sold 2026-05-08 | 0.20 mi |
| 215 Sunset Shower Drive | Active | $670,000 | $306 | 3 / 3 | 2,186 | 0 days on market | 0.23 mi |
| 1070 Casady Hollow Avenue | Sold | $565,000 | $267 | 3 / 2 | 2,118 | Sold 2026-05-18 | 0.31 mi |
| 1116 Casady Hollow Avenue | Sold | $518,000 | $250 | 4 / 3 | 2,076 | Sold 2026-06-26 | 0.38 mi |
| 190 Tuscan Shadow Street | Sold | $650,000 | $249 | 4 / 4 | 2,615 | Sold 2026-08-05 | 0.38 mi |
| 197 Sicily Hills Court | Active | $649,888 | $268 | 3 / 3 | 2,429 | 13 days on market | 0.40 mi |
| 1109 Thunder Canyon Avenue | Sold | $580,000 | $296 | 3 / 2 | 1,959 | Sold 2026-06-02 | 0.40 mi |
| 197 Sicily Hills Court | Sold | $450,000 | $185 | 3 / 3 | 2,429 | Sold 2026-08-14 | 0.40 mi |


