
Comparable Sales Near 11150 Emory Oak Drive, Las Vegas, NV 89138
1st Realty · Comparable sales report · 1st.estate · October 21, 2026
Read the Summerlin neighborhood guide →
11150 Emory Oak Drive, Las Vegas, NV 89138
Status: Sold
$1,600,000 Sold Price
$561
$ / Sq Ft
2,852
Living Area
7,841 sqft
Lot Size
4
Beds
4
Baths
2018
Year Built
Search Parameters
Property Type
Status
Radius
Sold Within
Beds
Baths
Living Area (Sq Ft)
Lot Size (Sq Ft)
This comp search reflects your current search parameters — adjust the filters above as needed for a more accurate estimate.
Estimated Value
—
Average $/Sqft
—
Check one or more comps below to calculate an estimate.
Nearest 10 of 22 comparable sales and listings within 1 mile of this home. Use the filters above and press Search to refine.
$1,610,0005 bd5 ba3,102 sqft$519/sqft0.06 mi41 daysSold 2026-07-02
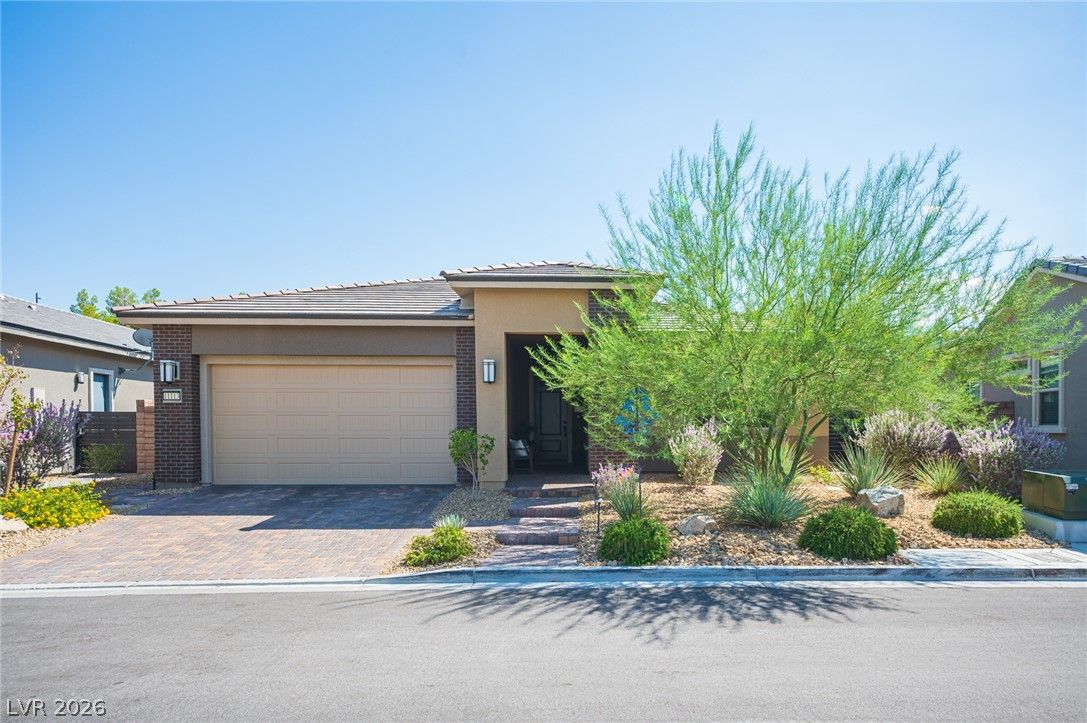
$1,075,0003 bd3 ba2,292 sqft$469/sqft0.07 mi41 days
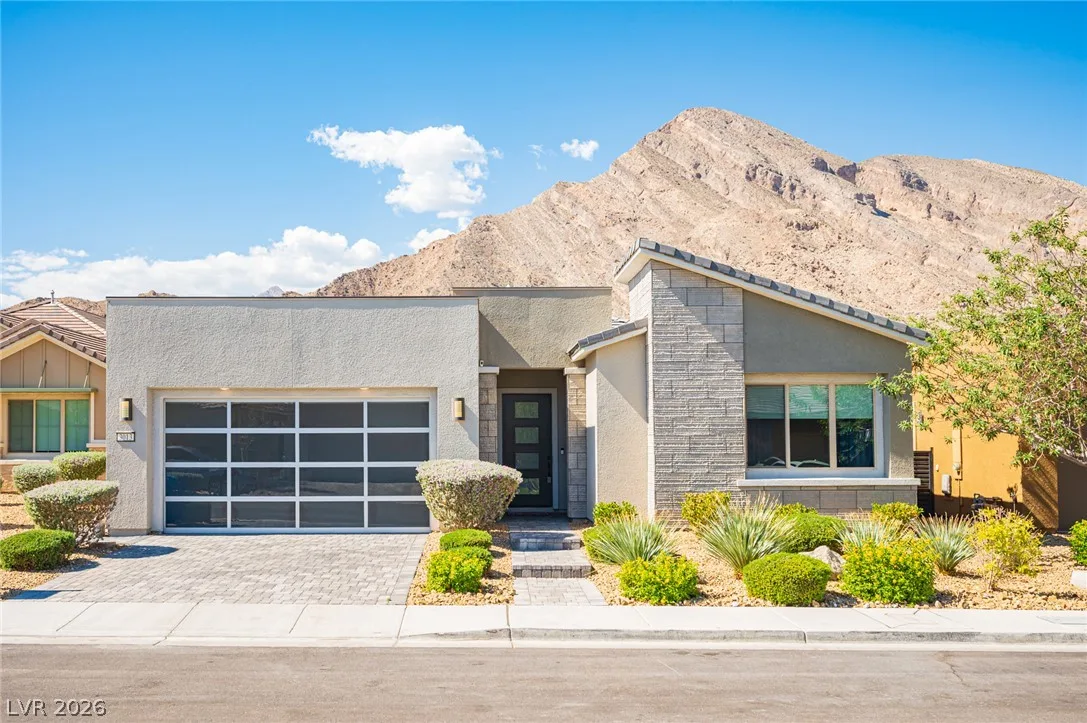
$1,550,0003 bd3 ba2,452 sqft$632/sqft0.12 mi8 days
$1,350,0003 bd3 ba2,183 sqft$618/sqft0.19 mi1 daysSold 2026-04-24
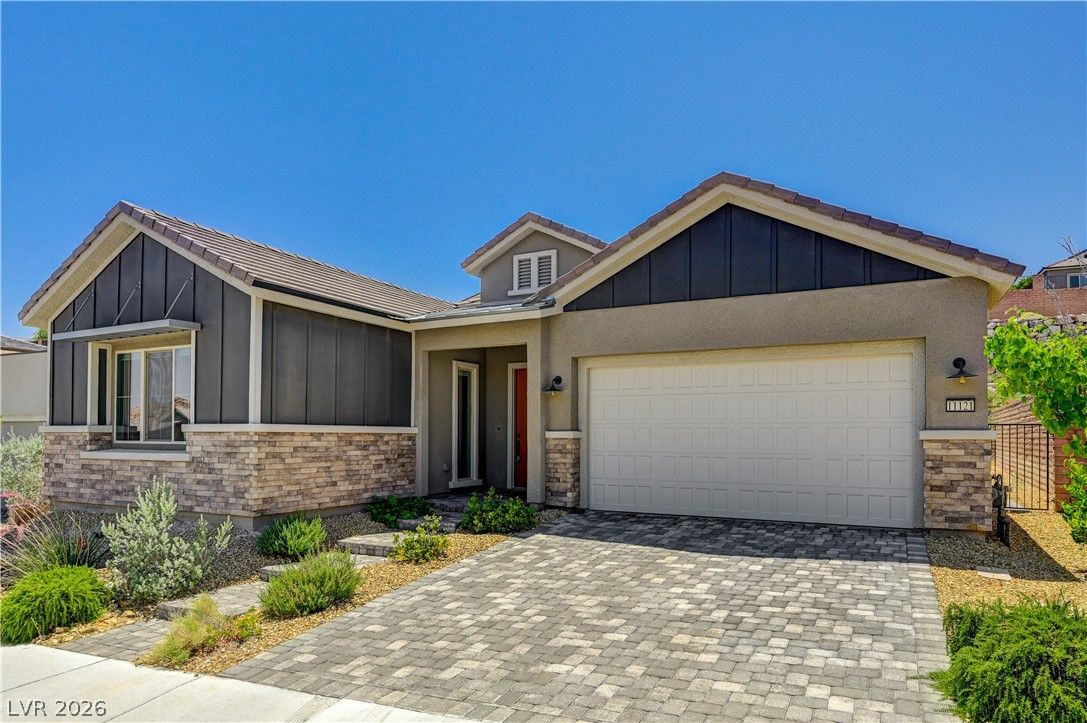
$970,0003 bd3 ba2,183 sqft$444/sqft0.20 mi36 daysSold 2026-07-01
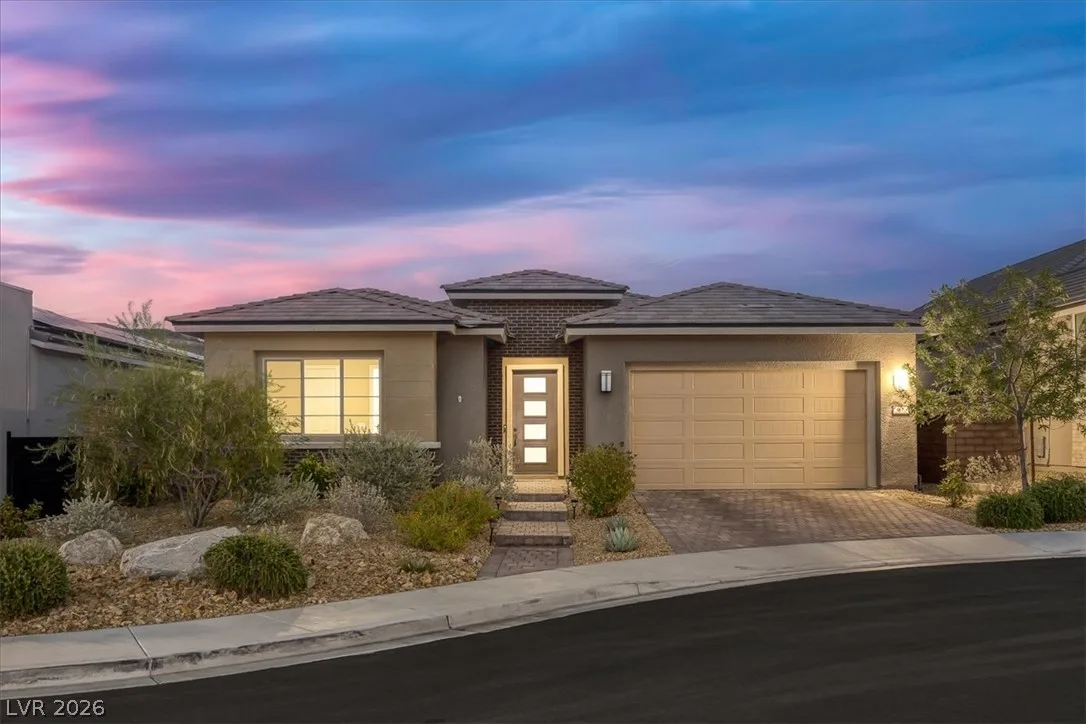
$1,200,0003 bd3 ba2,452 sqft$489/sqft0.28 mi0 days
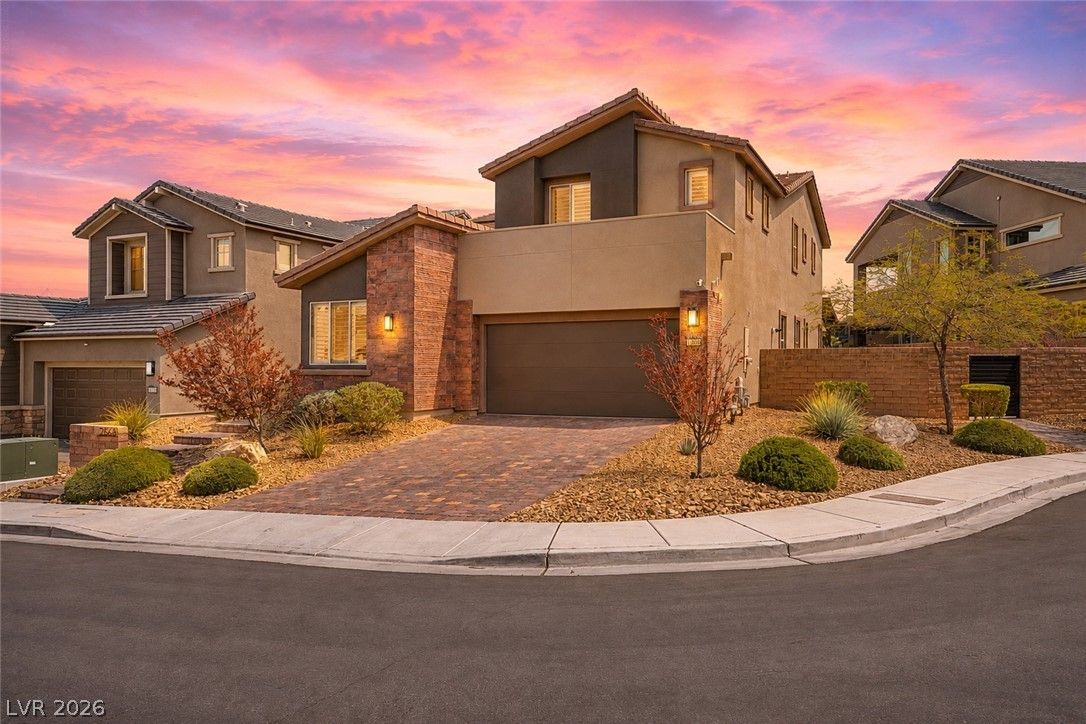
2568 Iron Crest LaneActive
$899,9005 bd4 ba3,059 sqft$294/sqft0.32 mi55 days
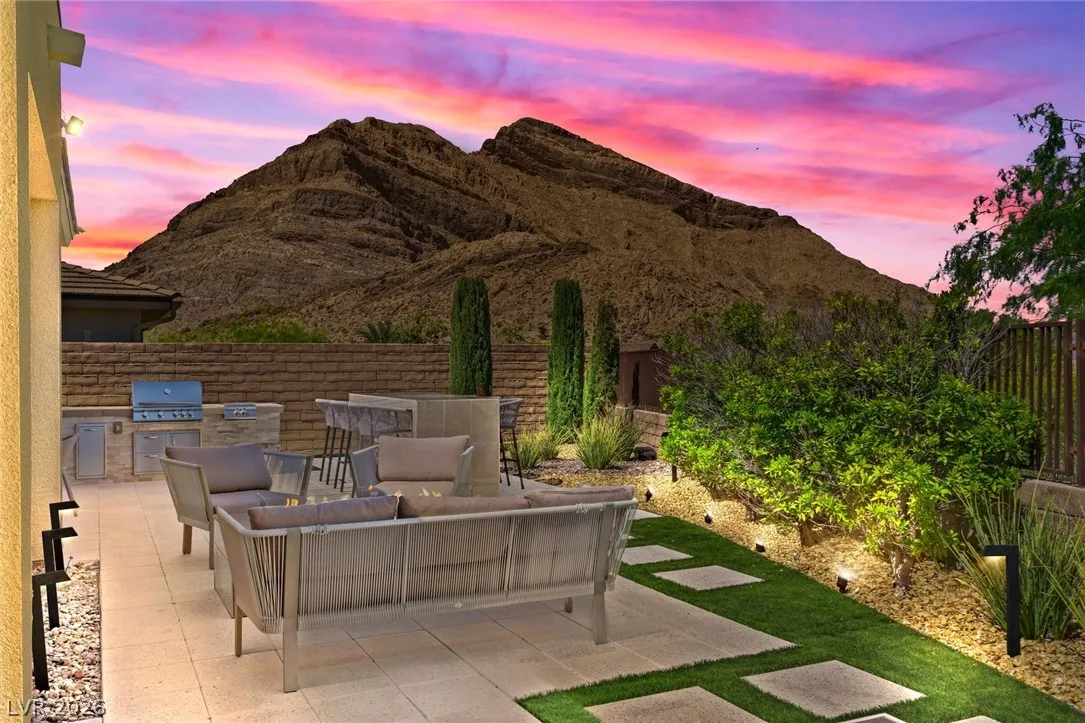
3060 Full Lotus DriveActive
$1,275,0003 bd3 ba2,452 sqft$520/sqft0.32 mi0 days
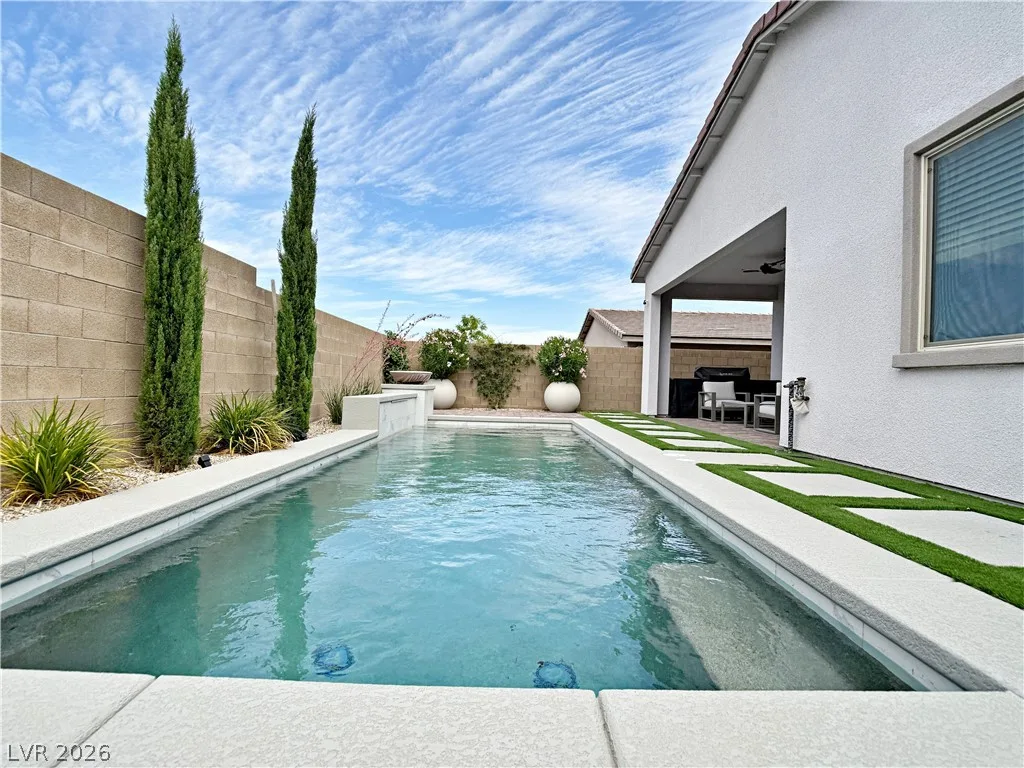
$1,049,0004 bd4 ba2,300 sqft$456/sqft0.69 mi0 days
$1,070,0003 bd3 ba2,148 sqft$498/sqft0.70 mi82 daysSold 2026-05-12
Nearest comparable sales and listings
12 comparables · median price $1,072,500 · range $899,900 – $1,610,000 · median $/sq ft $479 · average $/sq ft $481
| Address | Status | Price | $/Sq Ft | Bd / Ba | Sq Ft | Sold / market time | Distance |
|---|---|---|---|---|---|---|---|
| 11180 Torch Cactus Drive | Sold | $1,610,000 | $519 | 5 / 5 | 3,102 | Sold 2026-07-02 | 0.06 mi |
| 11113 Black Fire Opal Drive | Active | $1,075,000 | $469 | 3 / 3 | 2,292 | 41 days on market | 0.07 mi |
| 3013 Sierra Juniper Court | Active | $1,550,000 | $632 | 3 / 3 | 2,452 | 8 days on market | 0.12 mi |
| 3071 Mount Oak Court | Sold | $1,350,000 | $618 | 3 / 3 | 2,183 | Sold 2026-04-24 | 0.19 mi |
| 11121 Red Yucca Drive | Sold | $970,000 | $444 | 3 / 3 | 2,183 | Sold 2026-07-01 | 0.20 mi |
| 3070 Spring Solstice Court | Active | $1,200,000 | $489 | 3 / 3 | 2,452 | 0 days on market | 0.28 mi |
| 2568 Iron Crest Lane | Active | $899,900 | $294 | 5 / 4 | 3,059 | 55 days on market | 0.32 mi |
| 3060 Full Lotus Drive | Active | $1,275,000 | $520 | 3 / 3 | 2,452 | 0 days on market | 0.32 mi |
| 11622 Peregrine Point Court | Active | $1,049,000 | $456 | 4 / 4 | 2,300 | 0 days on market | 0.69 mi |
| 11593 Peregrine Point Court | Sold | $1,070,000 | $498 | 3 / 3 | 2,148 | Sold 2026-05-12 | 0.70 mi |
| 2194 Pigeon Hawk Street | Sold | $985,000 | $422 | 4 / 3 | 2,335 | Sold 2026-04-30 | 0.71 mi |
| 11605 Falcon Gorge Avenue | Active | $900,000 | $407 | 4 / 3 | 2,212 | 71 days on market | 0.74 mi |


