
Comparable Sales Near 3113 PORT SIDE Drive, Las Vegas, NV 89117
1st Realty · Comparable sales report · 1st.estate · October 20, 2026
Read the Spring Valley neighborhood guide →
3113 PORT SIDE Drive, Las Vegas, NV 89117
Status: Sold
$2,995 Sold Price
$1
$ / Sq Ft
3,031
Living Area
6,970 sqft
Lot Size
4
Beds
3
Baths
1986
Year Built
Search Parameters
Property Type
Status
Radius
Sold Within
Beds
Baths
Living Area (Sq Ft)
Lot Size (Sq Ft)
This comp search reflects your current search parameters — adjust the filters above as needed for a more accurate estimate.
Estimated Value
—
Average $/Sqft
—
Check one or more comps below to calculate an estimate.
Nearest 10 of 41 comparable sales and listings within 1 mile of this home. Use the filters above and press Search to refine.

9105 Safeport Cove CourtActive
$564,9984 bd3 ba2,401 sqft$235/sqft0.21 mi96 days
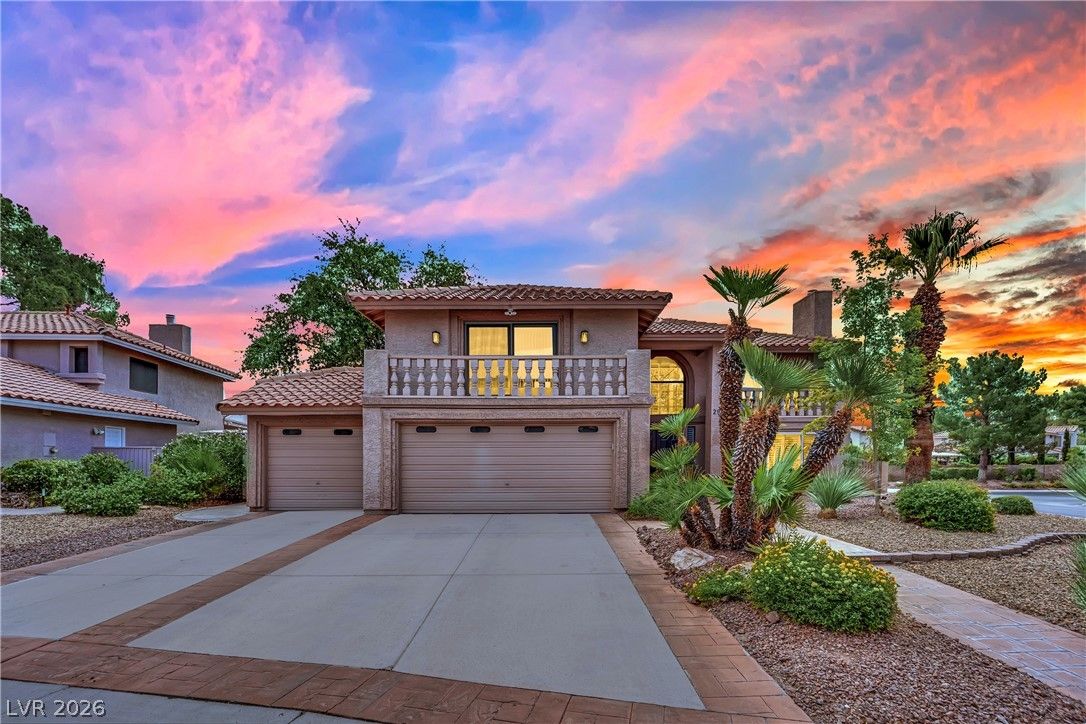
$674,0003 bd3 ba3,031 sqft$222/sqft0.25 mi2 daysSold 2026-08-20

9109 Shelter Cove CourtActive
$649,9994 bd3 ba2,401 sqft$271/sqft0.28 mi40 days
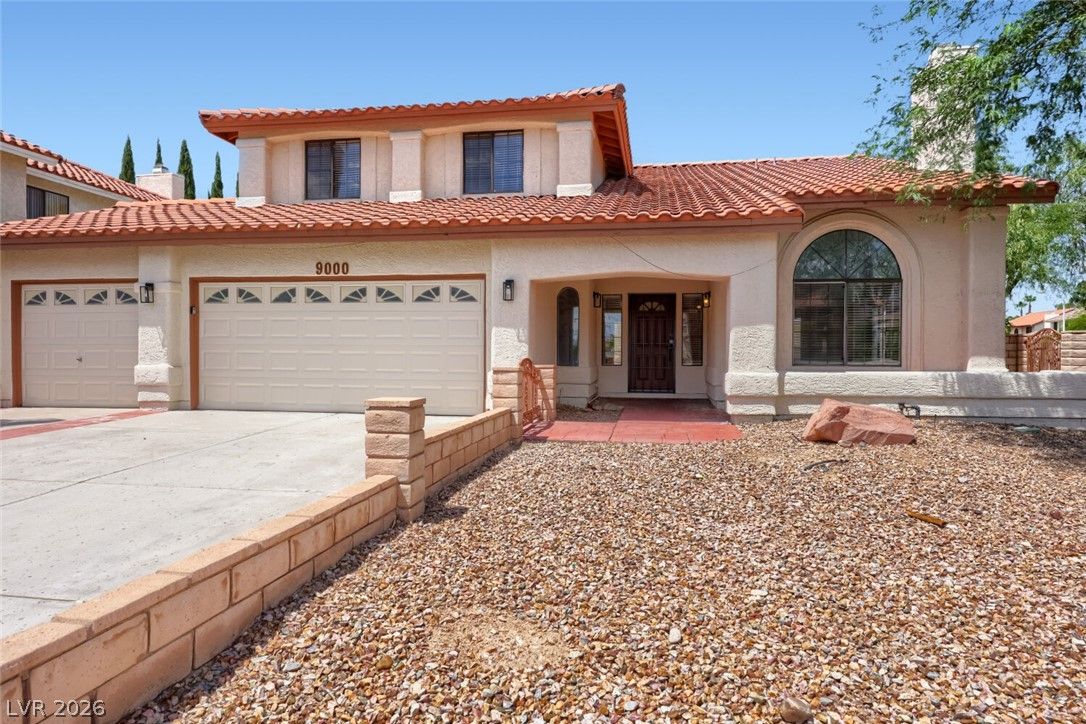
9000 Feather River CourtUnder Contract
$509,9004 bd3 ba2,358 sqft$216/sqft0.29 mi86 days
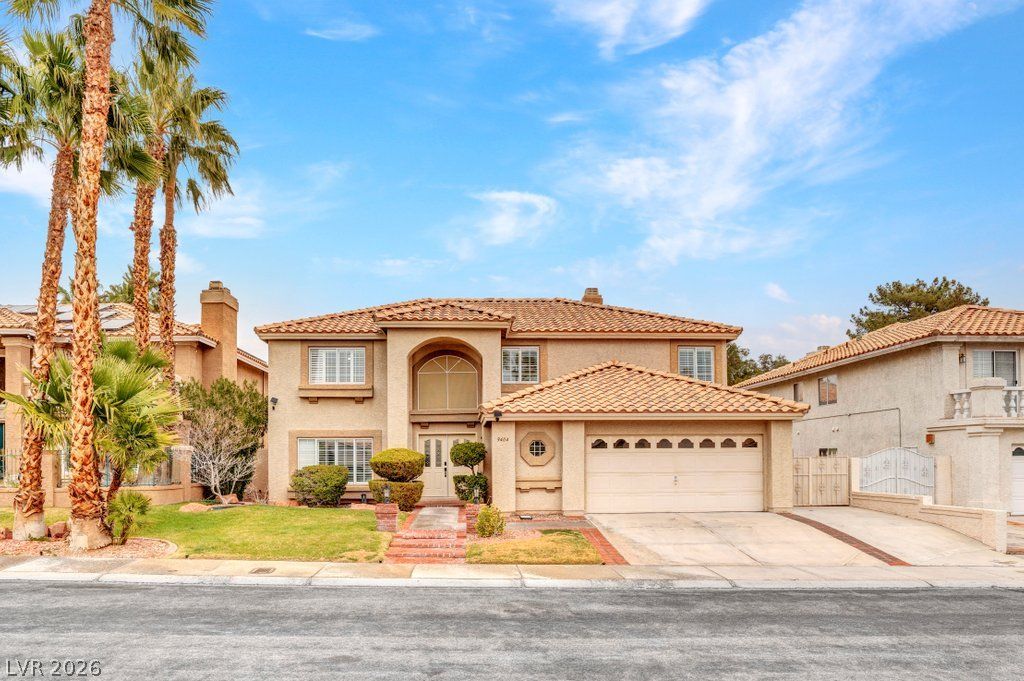
9404 Low Tide CourtActive
$795,0005 bd3 ba2,974 sqft$267/sqft0.30 mi0 days

9024 Feather River CourtActive
$599,0004 bd3 ba2,358 sqft$254/sqft0.30 mi46 days
$685,0005 bd3 ba3,557 sqft$193/sqft0.31 mi31 daysSold 2026-06-04
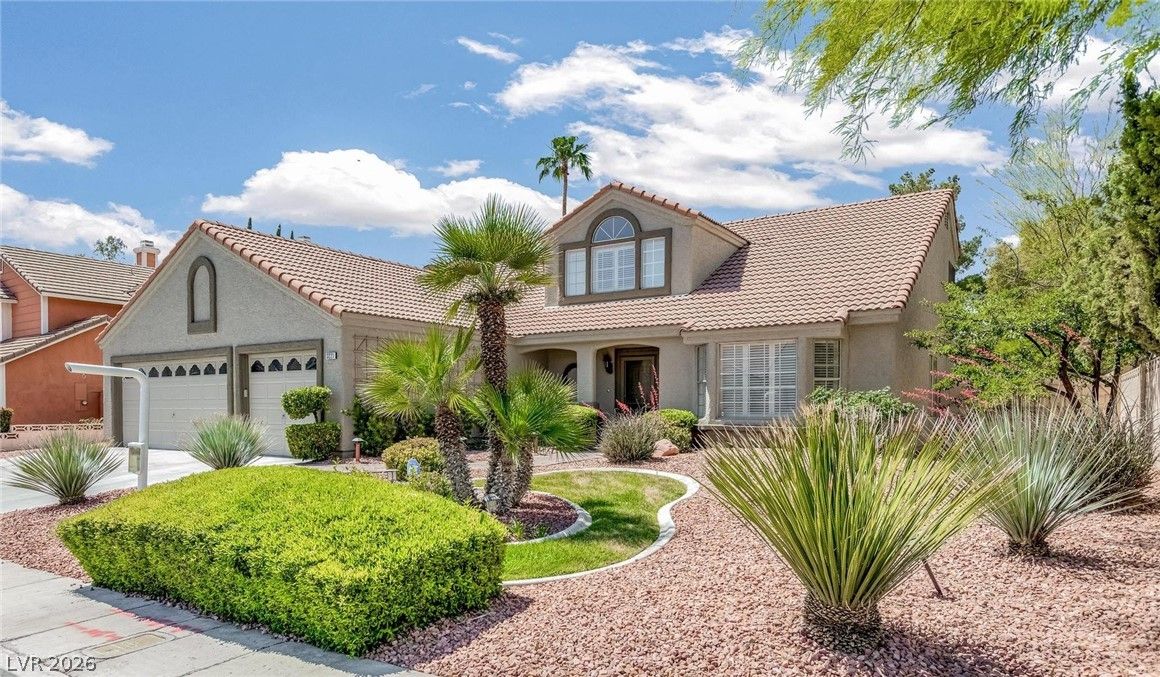
$649,0003 bd3 ba2,532 sqft$256/sqft0.31 mi110 daysSold 2026-08-25
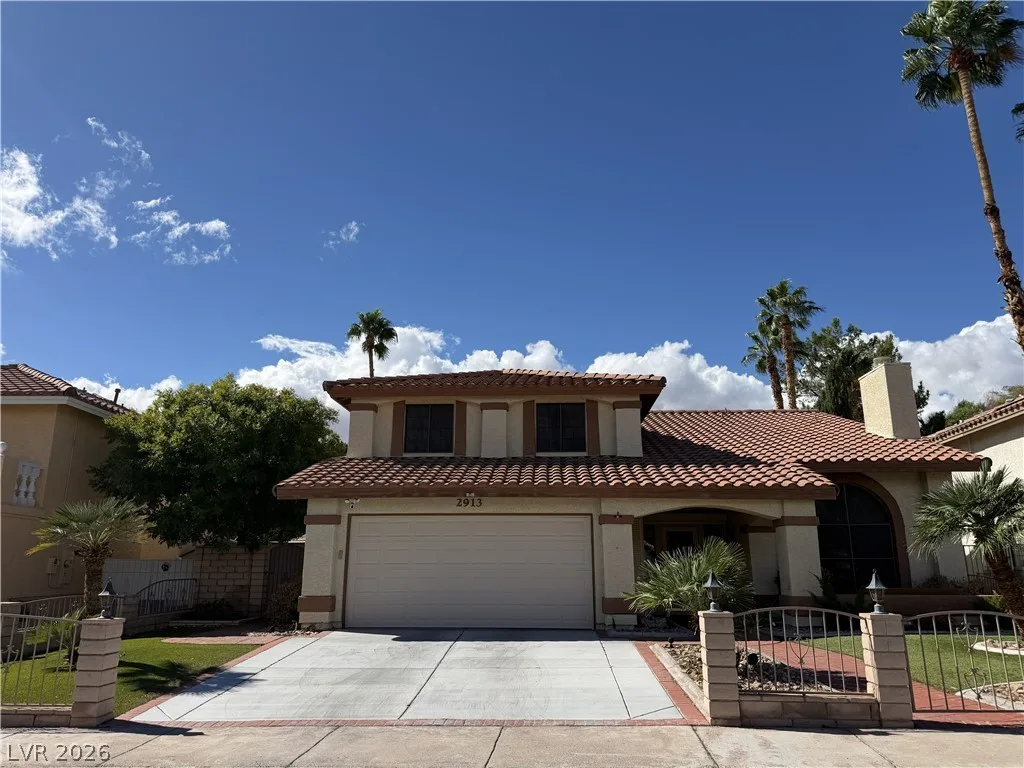
2913 Pleasant Lake DriveActive
$529,9004 bd3 ba2,358 sqft$225/sqft0.32 mi3 days
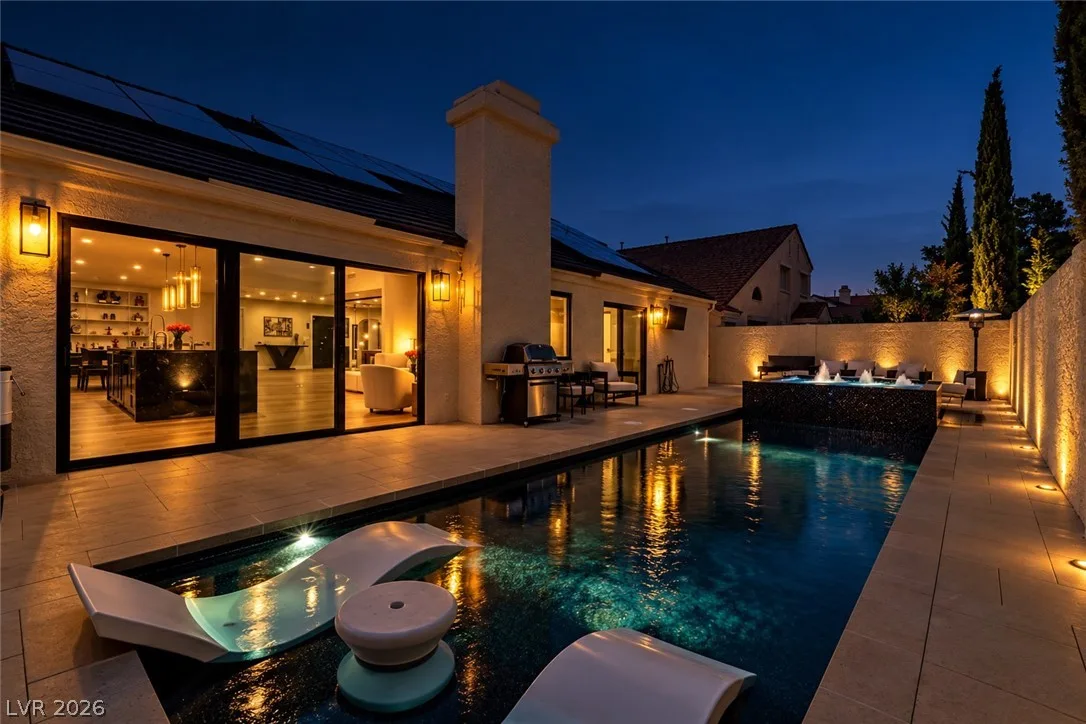
2824 Shannon River DriveActive
$974,8883 bd2 ba2,317 sqft$421/sqft0.36 mi4 days
Nearest comparable sales and listings
12 comparables · median price $662,000 · range $509,900 – $974,888 · median $/sq ft $247 · average $/sq ft $255
| Address | Status | Price | $/Sq Ft | Bd / Ba | Sq Ft | Sold / market time | Distance |
|---|---|---|---|---|---|---|---|
| 9105 Safeport Cove Court | Active | $564,998 | $235 | 4 / 3 | 2,401 | 96 days on market | 0.21 mi |
| 2936 Pleasant Lake Drive | Sold | $674,000 | $222 | 3 / 3 | 3,031 | Sold 2026-08-20 | 0.25 mi |
| 9109 Shelter Cove Court | Active | $649,999 | $271 | 4 / 3 | 2,401 | 40 days on market | 0.28 mi |
| 9000 Feather River Court | Under Contract | $509,900 | $216 | 4 / 3 | 2,358 | 86 days on market | 0.29 mi |
| 9404 Low Tide Court | Active | $795,000 | $267 | 5 / 3 | 2,974 | 0 days on market | 0.30 mi |
| 9024 Feather River Court | Active | $599,000 | $254 | 4 / 3 | 2,358 | 46 days on market | 0.30 mi |
| 9312 Angelfish Drive | Sold | $685,000 | $193 | 5 / 3 | 3,557 | Sold 2026-06-04 | 0.31 mi |
| 3221 Grey Dolphin Drive | Sold | $649,000 | $256 | 3 / 3 | 2,532 | Sold 2026-08-25 | 0.31 mi |
| 2913 Pleasant Lake Drive | Active | $529,900 | $225 | 4 / 3 | 2,358 | 3 days on market | 0.32 mi |
| 2824 Shannon River Drive | Active | $974,888 | $421 | 3 / 2 | 2,317 | 4 days on market | 0.36 mi |
| 3100 Stern Drive | Sold | $725,000 | $244 | 5 / 3 | 2,974 | Sold 2026-08-07 | 0.39 mi |
| 3009 Periscope Court | Active | $745,000 | $251 | 5 / 3 | 2,974 | 10 days on market | 0.40 mi |


