
Comparable Sales Near 479 Sweet Springs Street, Henderson, NV 89015
1st Realty · Comparable sales report · 1st.estate · October 21, 2026
Read the Henderson area guide →
479 Sweet Springs Street, Henderson, NV 89015
Status: Sold
$460,000 Sold Price
$289
$ / Sq Ft
1,594
Living Area
7,405 sqft
Lot Size
3
Beds
3
Baths
2004
Year Built
Search Parameters
Property Type
Status
Radius
Sold Within
Beds
Baths
Living Area (Sq Ft)
Lot Size (Sq Ft)
This comp search reflects your current search parameters — adjust the filters above as needed for a more accurate estimate.
Estimated Value
—
Average $/Sqft
—
Check one or more comps below to calculate an estimate.
Nearest 10 of 43 comparable sales and listings within 1 mile of this home. Use the filters above and press Search to refine.
$490,0003 bd2 ba1,578 sqft$311/sqft0.04 mi28 daysSold 2026-05-29
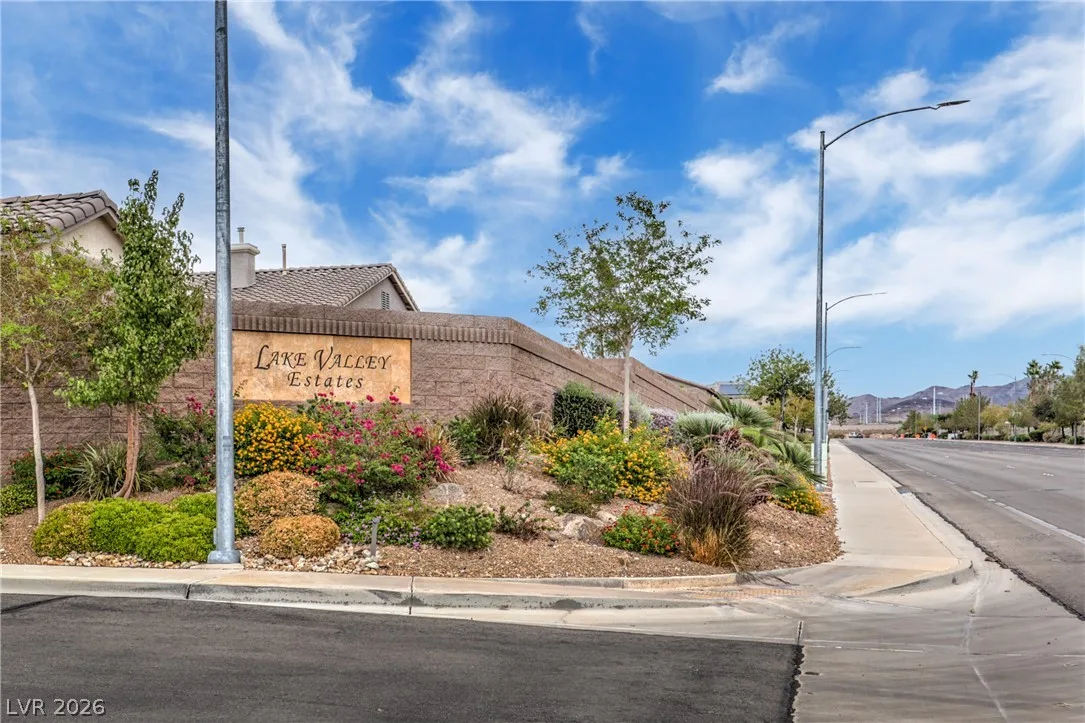
1035 New Creek AvenueActive
$590,0003 bd3 ba1,832 sqft$322/sqft0.08 mi3 days
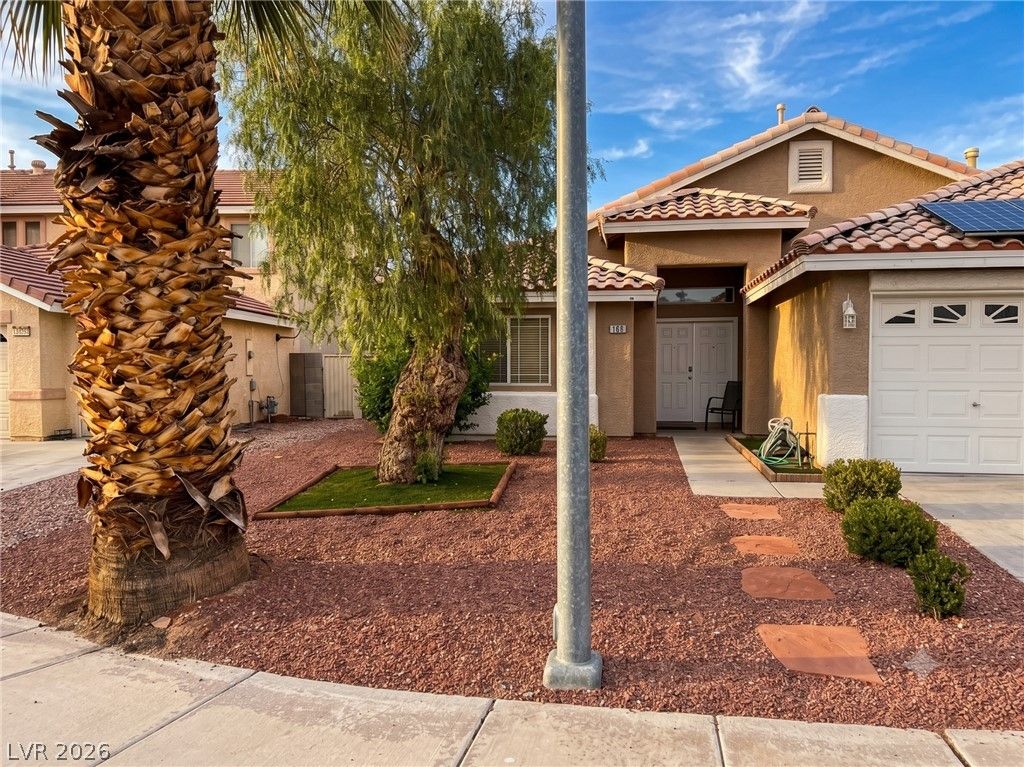
$455,0004 bd2 ba1,878 sqft$242/sqft0.24 mi13 daysSold 2026-10-07
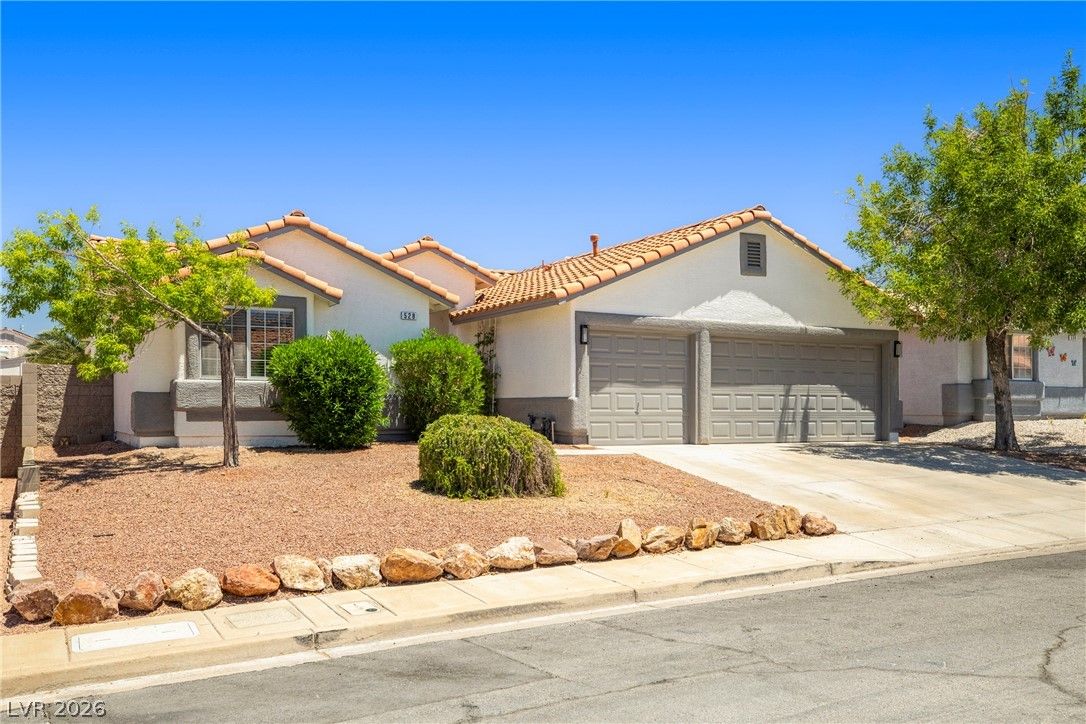
$430,0003 bd2 ba1,592 sqft$270/sqft0.31 mi19 daysSold 2026-08-03
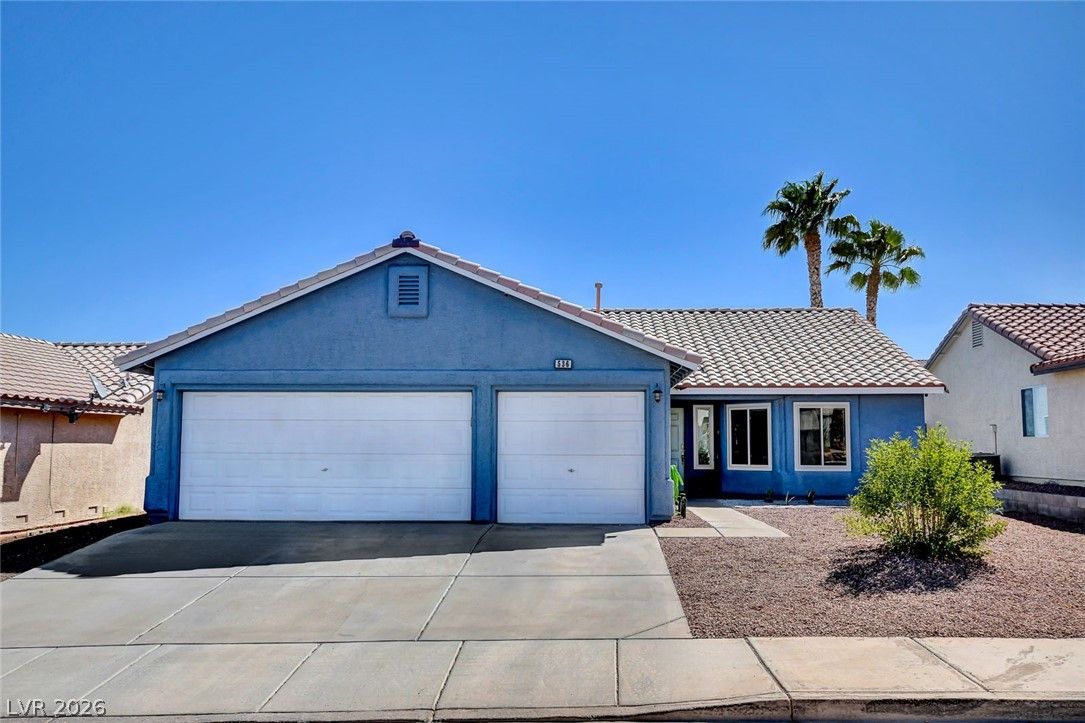
536 Sol De Sandia StreetUnder Contract
$398,0003 bd2 ba1,308 sqft$304/sqft0.34 mi37 days
$449,0003 bd2 ba1,496 sqft$300/sqft0.35 mi2 daysSold 2026-05-29
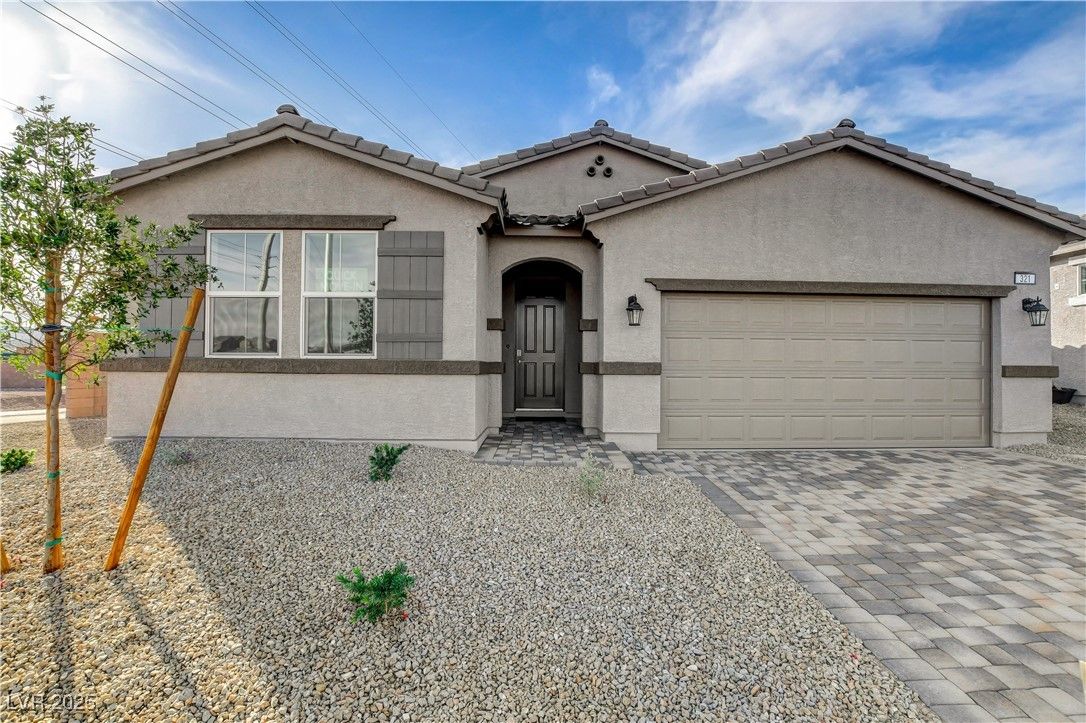
$499,9902 bd2 ba1,551 sqft$322/sqft0.37 mi263 daysSold 2026-08-24
$499,9903 bd2 ba1,551 sqft$322/sqft0.39 mi196 daysSold 2026-06-24
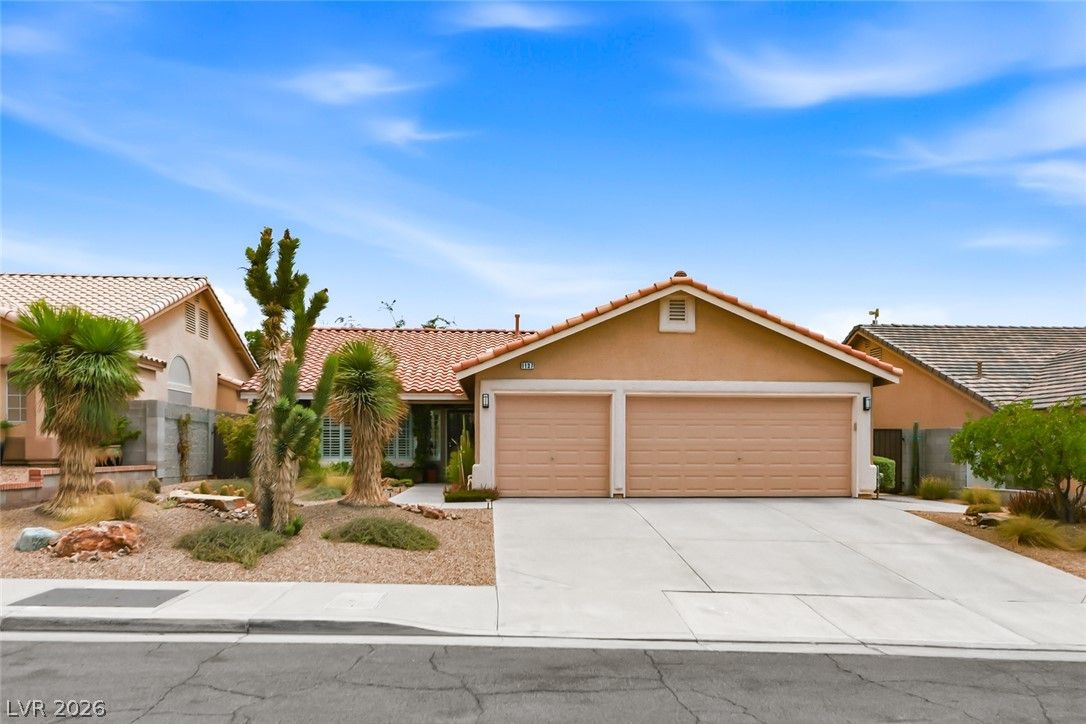
$429,9873 bd2 ba1,308 sqft$329/sqft0.39 mi4 daysSold 2026-07-30
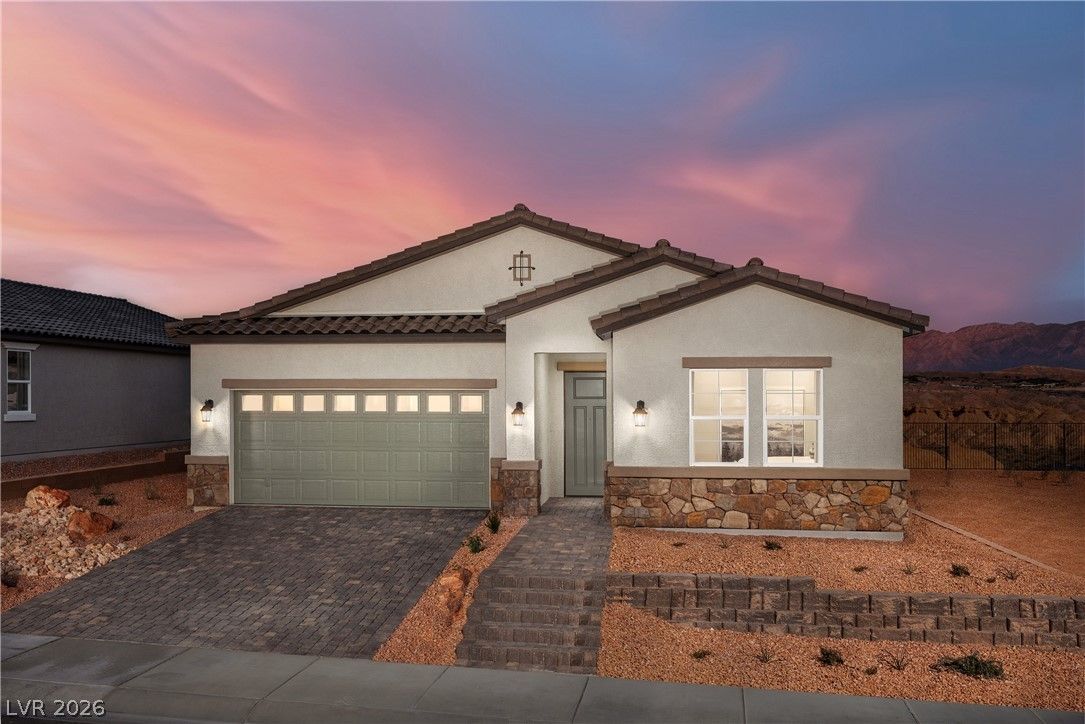
334 Golden Hollow CourtActive
$544,9903 bd2 ba1,755 sqft$311/sqft0.40 mi105 days
Nearest comparable sales and listings
12 comparables · median price $462,500 · range $398,000 – $590,000 · median $/sq ft $307 · average $/sq ft $298
| Address | Status | Price | $/Sq Ft | Bd / Ba | Sq Ft | Sold / market time | Distance |
|---|---|---|---|---|---|---|---|
| 1016 New Creek Avenue | Sold | $490,000 | $311 | 3 / 2 | 1,578 | Sold 2026-05-29 | 0.04 mi |
| 1035 New Creek Avenue | Active | $590,000 | $322 | 3 / 3 | 1,832 | 3 days on market | 0.08 mi |
| 1008 Shoemaker Avenue | Sold | $455,000 | $242 | 4 / 2 | 1,878 | Sold 2026-10-07 | 0.24 mi |
| 528 Don Tomas Court | Sold | $430,000 | $270 | 3 / 2 | 1,592 | Sold 2026-08-03 | 0.31 mi |
| 536 Sol De Sandia Street | Under Contract | $398,000 | $304 | 3 / 2 | 1,308 | 37 days on market | 0.34 mi |
| 572 Broomspun Street | Sold | $449,000 | $300 | 3 / 2 | 1,496 | Sold 2026-05-29 | 0.35 mi |
| 321 Blossom Wind Street | Sold | $499,990 | $322 | 2 / 2 | 1,551 | Sold 2026-08-24 | 0.37 mi |
| 329 Blossom Wind Street | Sold | $499,990 | $322 | 3 / 2 | 1,551 | Sold 2026-06-24 | 0.39 mi |
| 1137 Pincay Drive | Sold | $429,987 | $329 | 3 / 2 | 1,308 | Sold 2026-07-30 | 0.39 mi |
| 334 Golden Hollow Court | Active | $544,990 | $311 | 3 / 2 | 1,755 | 105 days on market | 0.40 mi |
| 541 Trocadero Street | Sold | $450,000 | $283 | 3 / 2 | 1,592 | Sold 2026-08-18 | 0.42 mi |
| 1120 Devon Downs Avenue | Sold | $470,000 | $259 | 4 / 2 | 1,815 | Sold 2026-05-26 | 0.44 mi |


