
Comparable Sales Near 2332 Thornwood Castle Drive, Laughlin, NV 89029
1st Realty · Comparable sales report · 1st.estate · October 21, 2026
Read the Laughlin area guide →
2332 Thornwood Castle Drive, Laughlin, NV 89029
Status: Sold
$329,000 Sold Price
$206
$ / Sq Ft
1,600
Living Area
8,276 sqft
Lot Size
3
Beds
2
Baths
2007
Year Built
Search Parameters
Property Type
Status
Radius
Sold Within
Beds
Baths
Living Area (Sq Ft)
Lot Size (Sq Ft)
This comp search reflects your current search parameters — adjust the filters above as needed for a more accurate estimate.
Estimated Value
—
Average $/Sqft
—
Check one or more comps below to calculate an estimate.
Nearest 10 of 23 comparable sales and listings within 1 mile of this home. Use the filters above and press Search to refine.
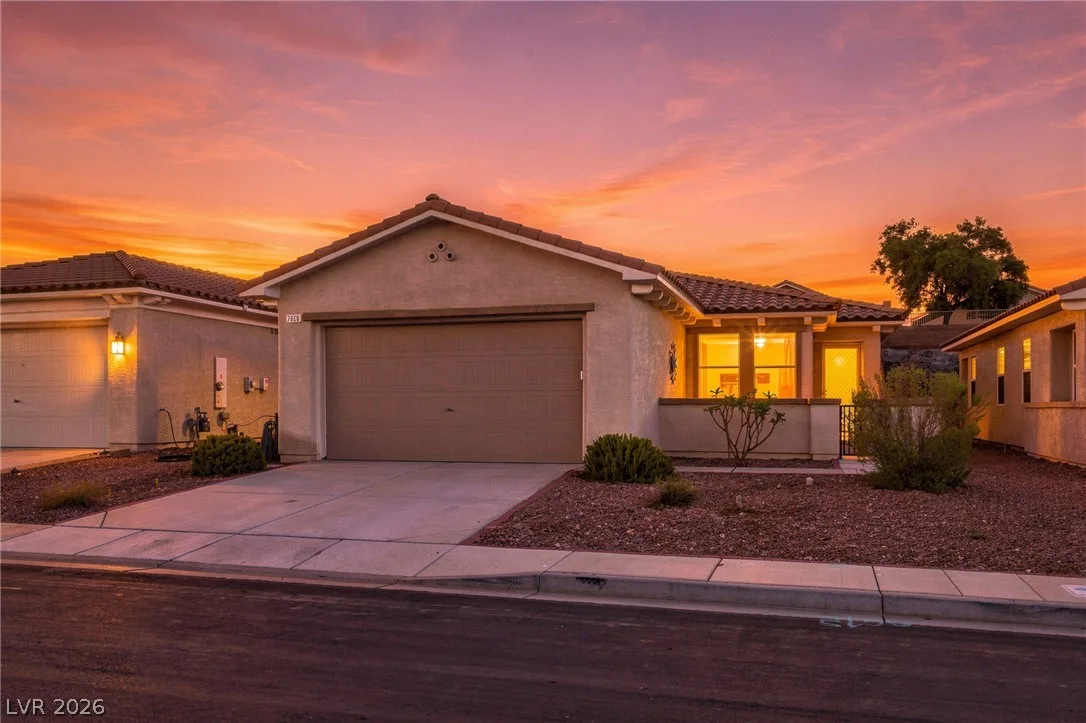
$359,9003 bd2 ba1,606 sqft$224/sqft0.12 mi1 days

$440,0003 bd2 ba1,595 sqft$276/sqft0.19 mi0 days

2681 Benton Cove StreetActive
$432,9993 bd3 ba1,947 sqft$222/sqft0.24 mi0 days
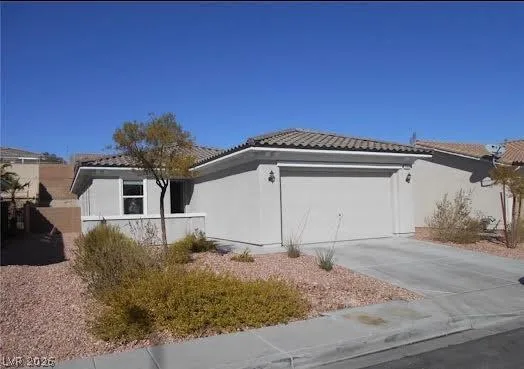
2146 Dillons Cove DriveActive
$374,9003 bd2 ba1,776 sqft$211/sqft0.24 mi0 days
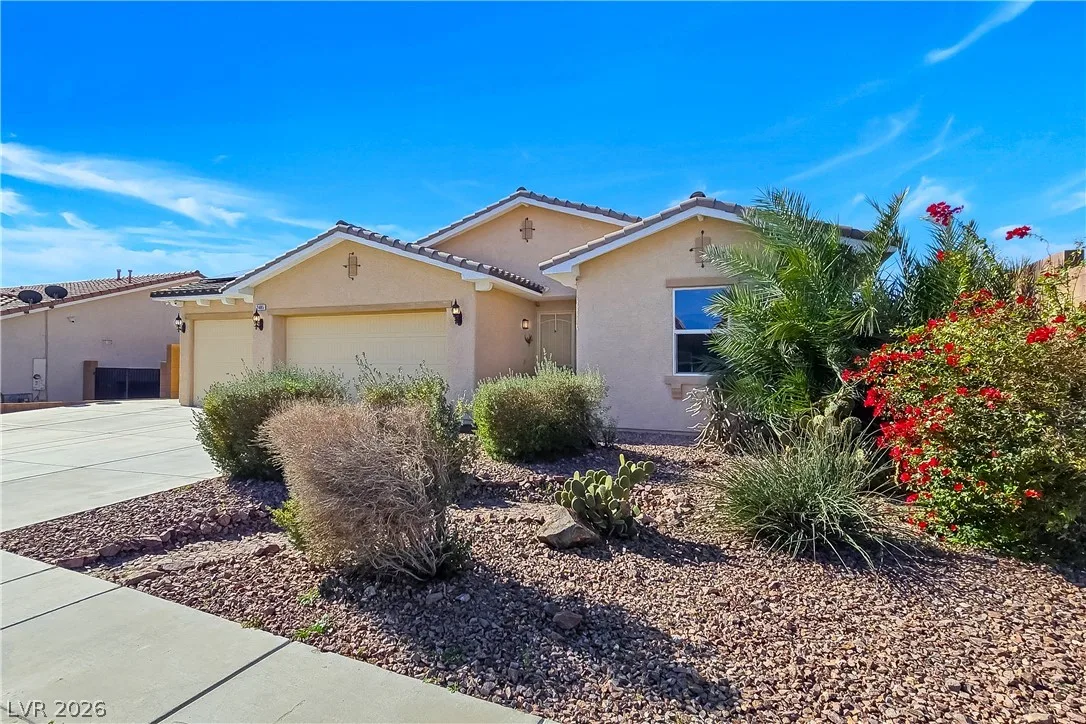
2485 Morrow Ridge PlaceActive
$419,9003 bd2 ba1,806 sqft$233/sqft0.28 mi0 days
$360,0003 bd2 ba1,949 sqft$185/sqft0.29 mi3 daysSold 2026-05-15
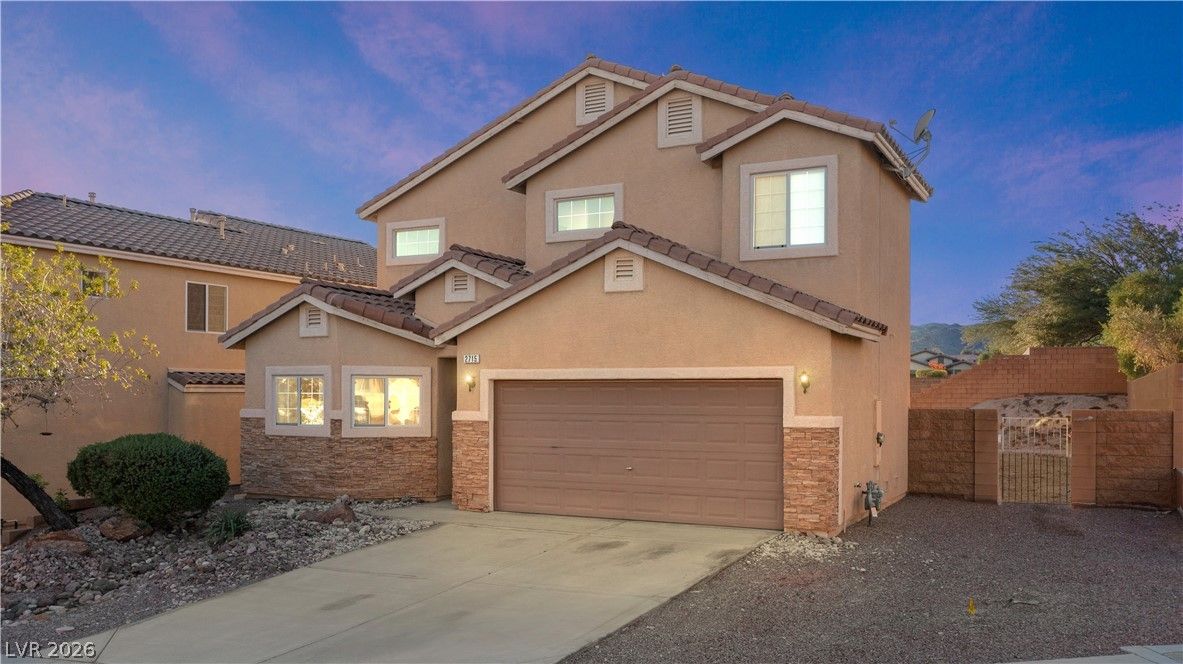
$348,9004 bd3 ba1,947 sqft$179/sqft0.31 mi28 days
$372,0004 bd2 ba1,760 sqft$211/sqft0.31 mi97 daysSold 2026-07-02
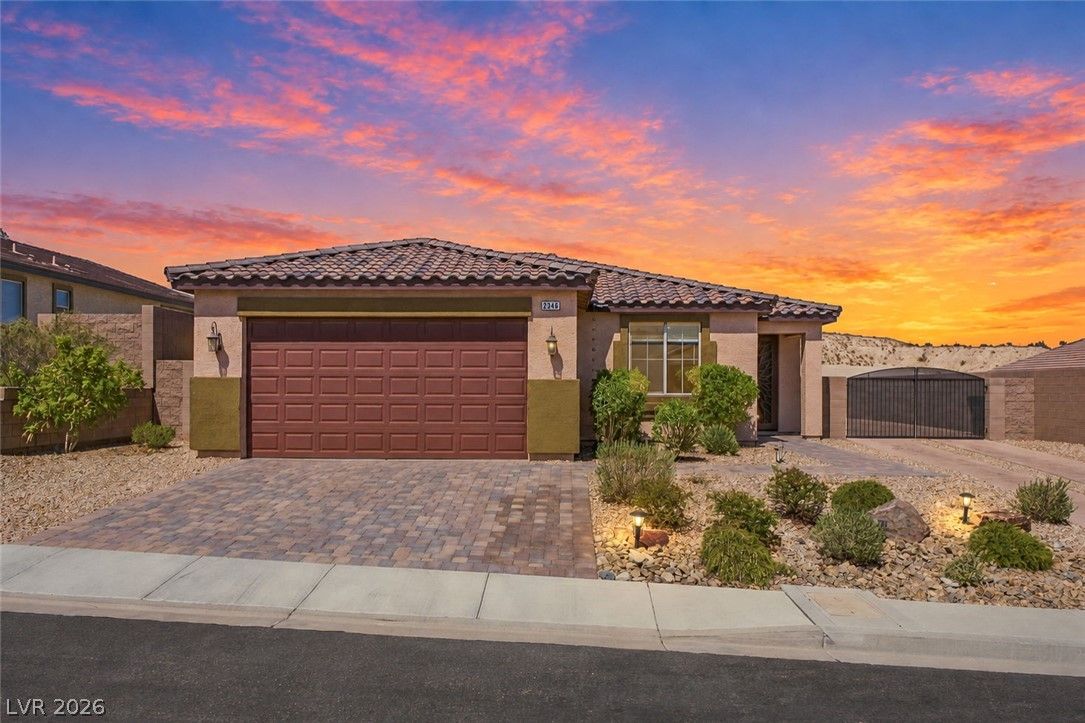
$399,9003 bd2 ba1,834 sqft$218/sqft0.32 mi16 days
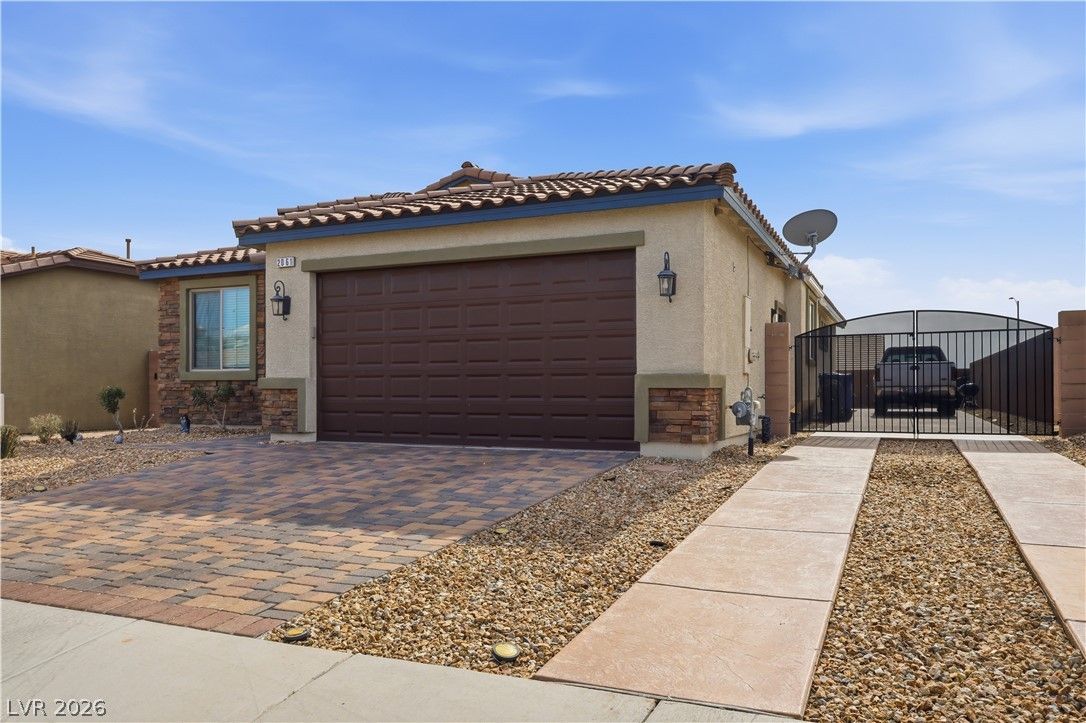
$369,0004 bd2 ba1,760 sqft$210/sqft0.33 mi149 daysSold 2026-09-08
Nearest comparable sales and listings
12 comparables · median price $370,500 · range $279,000 – $440,000 · median $/sq ft $211 · average $/sq ft $209
| Address | Status | Price | $/Sq Ft | Bd / Ba | Sq Ft | Sold / market time | Distance |
|---|---|---|---|---|---|---|---|
| 2356 Cookies Crossing Court | Active | $359,900 | $224 | 3 / 2 | 1,606 | 1 days on market | 0.12 mi |
| 2307 Brookfield Bay Avenue | Active | $440,000 | $276 | 3 / 2 | 1,595 | 0 days on market | 0.19 mi |
| 2681 Benton Cove Street | Active | $432,999 | $222 | 3 / 3 | 1,947 | 0 days on market | 0.24 mi |
| 2146 Dillons Cove Drive | Active | $374,900 | $211 | 3 / 2 | 1,776 | 0 days on market | 0.24 mi |
| 2485 Morrow Ridge Place | Active | $419,900 | $233 | 3 / 2 | 1,806 | 0 days on market | 0.28 mi |
| 2823 Rippling Springs Street | Sold | $360,000 | $185 | 3 / 2 | 1,949 | Sold 2026-05-15 | 0.29 mi |
| 2715 Brinkley Manor Street | Active | $348,900 | $179 | 4 / 3 | 1,947 | 28 days on market | 0.31 mi |
| 2081 Hunt Woods Court | Sold | $372,000 | $211 | 4 / 2 | 1,760 | Sold 2026-07-02 | 0.31 mi |
| 2346 Brookings Harbor Drive | Active | $399,900 | $218 | 3 / 2 | 1,834 | 16 days on market | 0.32 mi |
| 2061 Hunt Woods Court | Sold | $369,000 | $210 | 4 / 2 | 1,760 | Sold 2026-09-08 | 0.33 mi |
| 3021 Paseo Canyon Lane | Active | $279,000 | $147 | 4 / 3 | 1,896 | 49 days on market | 0.34 mi |
| 2772 Brinkley Manor Street | Sold | $358,000 | $188 | 4 / 3 | 1,906 | Sold 2026-05-14 | 0.35 mi |


