
Comparable Sales Near 1109 Pincay Drive, Henderson, NV 89015
1st Realty · Comparable sales report · 1st.estate · October 20, 2026
Read the Henderson area guide →
1109 Pincay Drive, Henderson, NV 89015
Status: Sold
$569,000 Sold Price
$234
$ / Sq Ft
2,436
Living Area
6,098 sqft
Lot Size
4
Beds
3
Baths
1997
Year Built
Search Parameters
Property Type
Status
Radius
Sold Within
Beds
Baths
Living Area (Sq Ft)
Lot Size (Sq Ft)
This comp search reflects your current search parameters — adjust the filters above as needed for a more accurate estimate.
Estimated Value
—
Average $/Sqft
—
Check one or more comps below to calculate an estimate.
Nearest 10 of 40 comparable sales and listings within 1 mile of this home. Use the filters above and press Search to refine.
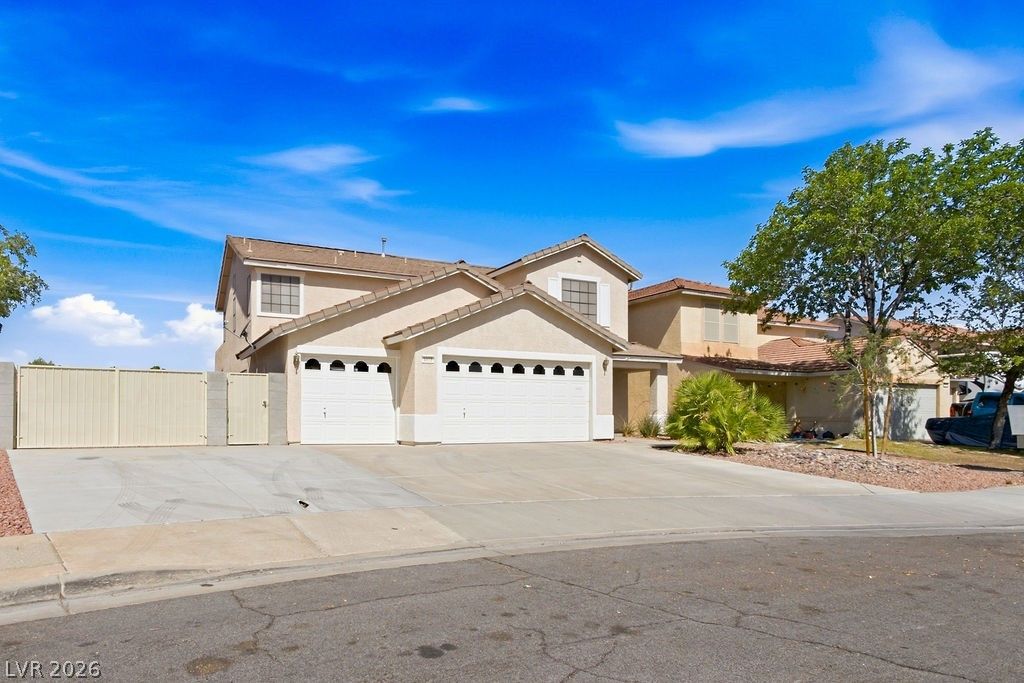
$545,5005 bd3 ba2,436 sqft$224/sqft0.09 mi38 daysSold 2026-08-24
559 Duran StreetSold
$545,0003 bd2 ba2,110 sqft$258/sqft0.11 mi1 daysSold 2026-05-06
551 Duran StreetSold
$447,5004 bd3 ba2,266 sqft$197/sqft0.13 mi76 daysSold 2026-05-22
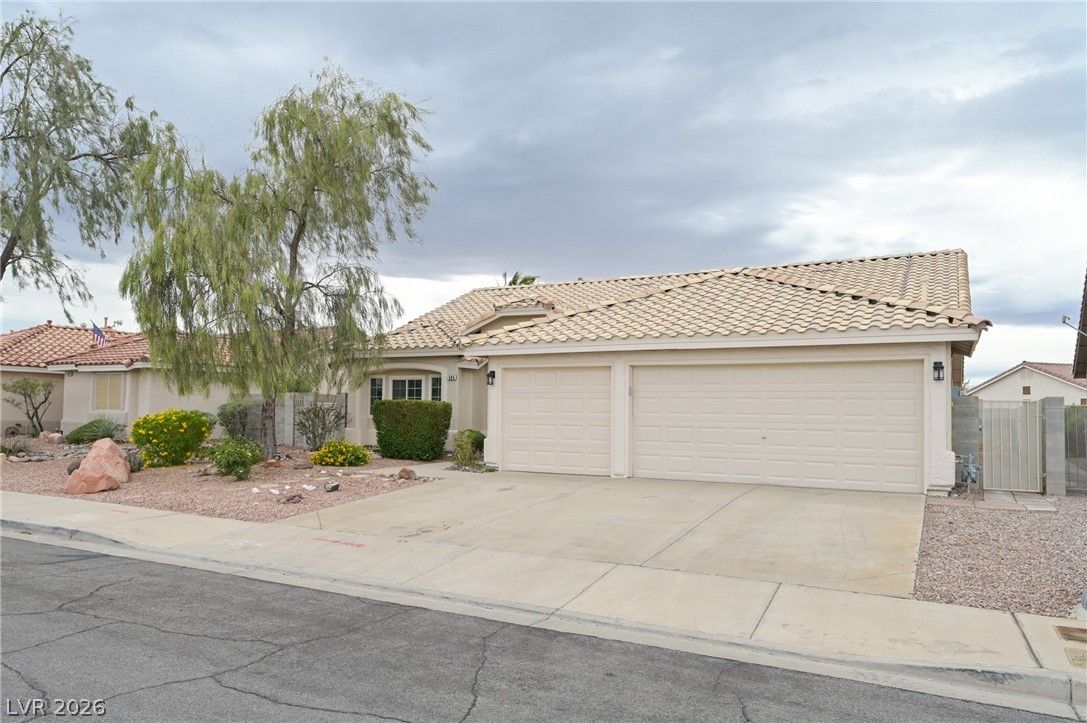
$440,0004 bd2 ba2,110 sqft$209/sqft0.17 mi15 daysSold 2026-06-12
527 Duran StreetSold
$590,0004 bd2 ba2,110 sqft$280/sqft0.17 mi32 daysSold 2026-07-10
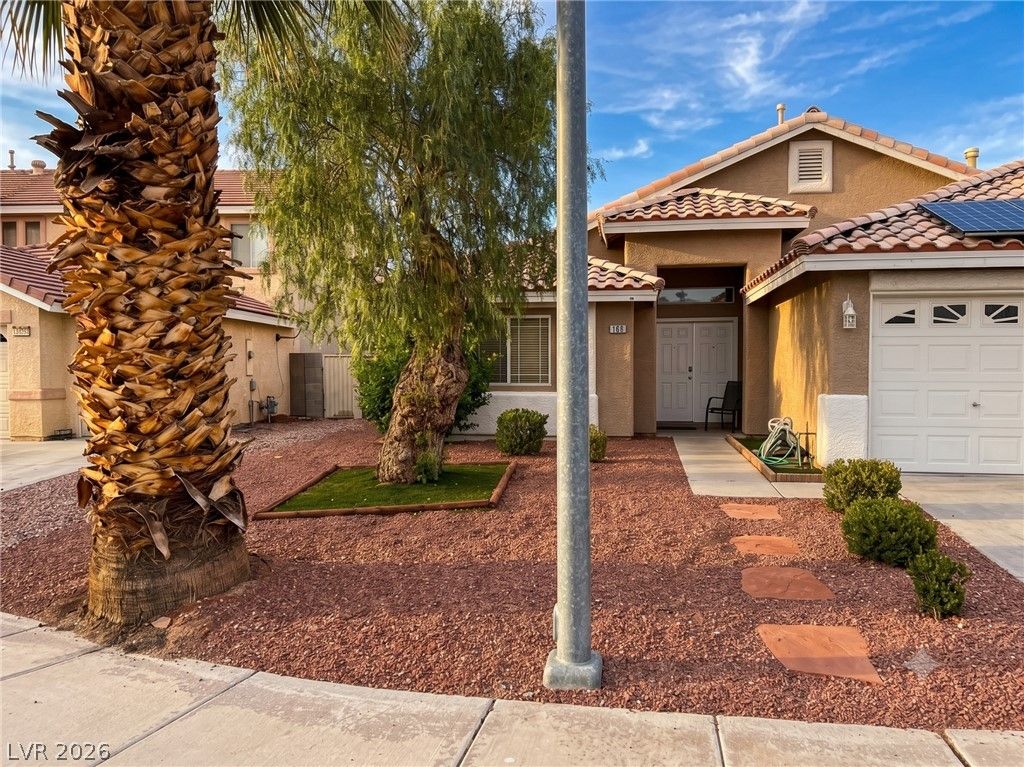
$455,0004 bd2 ba1,878 sqft$242/sqft0.20 mi13 daysSold 2026-10-07
$575,0003 bd3 ba2,435 sqft$236/sqft0.24 mi24 daysSold 2026-06-25
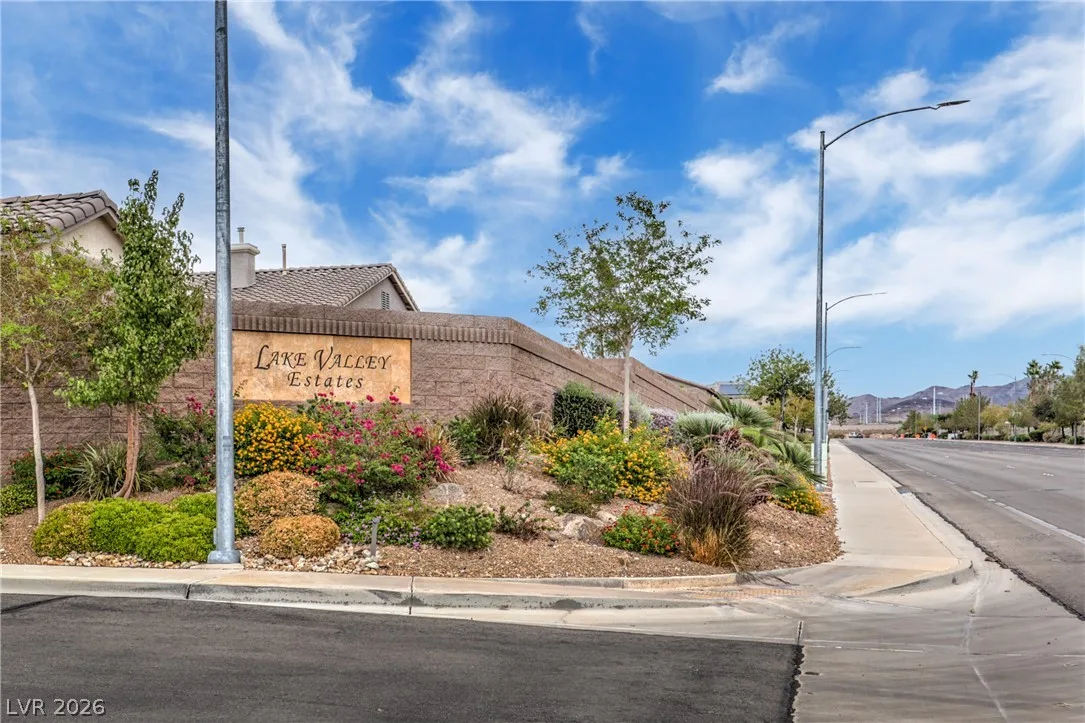
1035 New Creek AvenueActive
$590,0003 bd3 ba1,832 sqft$322/sqft0.28 mi3 days
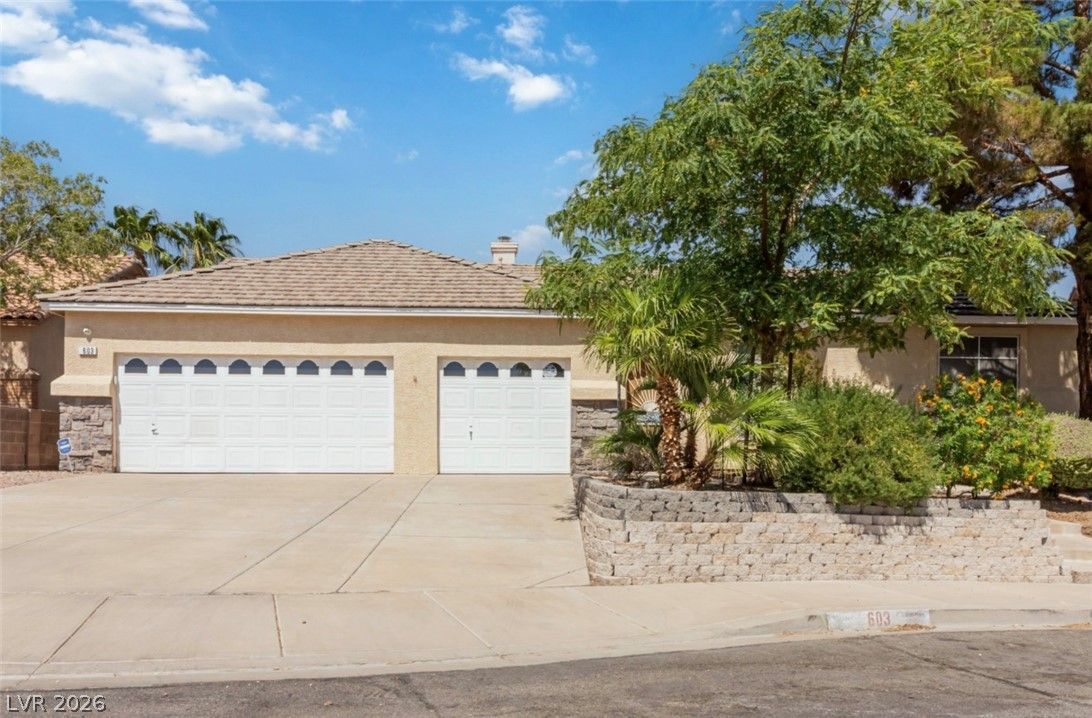
603 Braverwood DriveUnder Contract
$499,0004 bd3 ba2,544 sqft$196/sqft0.30 mi70 days
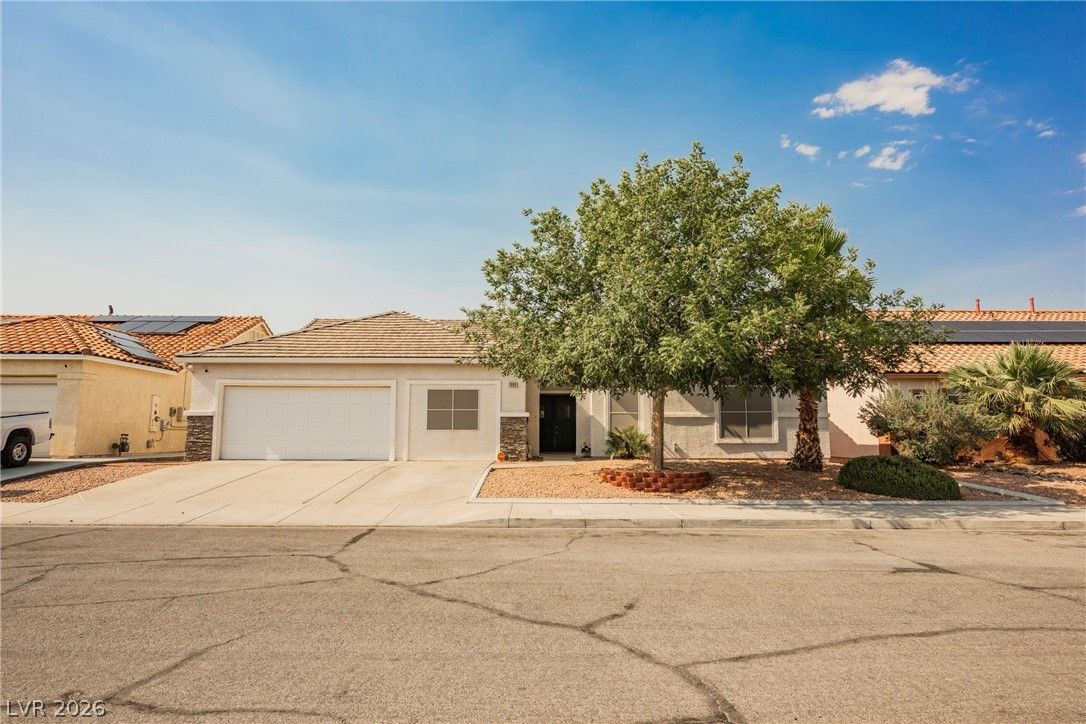
$539,0005 bd3 ba2,744 sqft$196/sqft0.32 mi174 daysSold 2026-09-14
Nearest comparable sales and listings
12 comparables · median price $542,000 · range $440,000 – $590,000 · median $/sq ft $234 · average $/sq ft $236
| Address | Status | Price | $/Sq Ft | Bd / Ba | Sq Ft | Sold / market time | Distance |
|---|---|---|---|---|---|---|---|
| 1073 Gallant Fox Avenue | Sold | $545,500 | $224 | 5 / 3 | 2,436 | Sold 2026-08-24 | 0.09 mi |
| 559 Duran Street | Sold | $545,000 | $258 | 3 / 2 | 2,110 | Sold 2026-05-06 | 0.11 mi |
| 551 Duran Street | Sold | $447,500 | $197 | 4 / 3 | 2,266 | Sold 2026-05-22 | 0.13 mi |
| 505 Bet Twice Street | Sold | $440,000 | $209 | 4 / 2 | 2,110 | Sold 2026-06-12 | 0.17 mi |
| 527 Duran Street | Sold | $590,000 | $280 | 4 / 2 | 2,110 | Sold 2026-07-10 | 0.17 mi |
| 1008 Shoemaker Avenue | Sold | $455,000 | $242 | 4 / 2 | 1,878 | Sold 2026-10-07 | 0.20 mi |
| 1040 Island Falls Avenue | Sold | $575,000 | $236 | 3 / 3 | 2,435 | Sold 2026-06-25 | 0.24 mi |
| 1035 New Creek Avenue | Active | $590,000 | $322 | 3 / 3 | 1,832 | 3 days on market | 0.28 mi |
| 603 Braverwood Drive | Under Contract | $499,000 | $196 | 4 / 3 | 2,544 | 70 days on market | 0.30 mi |
| 1008 Beaver Crest Terrace | Sold | $539,000 | $196 | 5 / 3 | 2,744 | Sold 2026-09-14 | 0.32 mi |
| 994 River Walk Court | Active | $549,900 | $245 | 4 / 3 | 2,246 | 1 days on market | 0.34 mi |
| 1004 Beaver Crest Terrace | Sold | $490,000 | $232 | 4 / 2 | 2,115 | Sold 2026-08-03 | 0.34 mi |


