
Comparable Sales Near 2409 Indigo Valley Street, Las Vegas, NV 89134
1st Realty · Comparable sales report · 1st.estate · October 21, 2026
Read the Sun City Summerlin neighborhood guide →
2409 Indigo Valley Street, Las Vegas, NV 89134
Status: Sold
$457,000 Sold Price
$336
$ / Sq Ft
1,360
Living Area
6,970 sqft
Lot Size
2
Beds
2
Baths
1995
Year Built
Search Parameters
Property Type
Status
Radius
Sold Within
Beds
Baths
Living Area (Sq Ft)
Lot Size (Sq Ft)
This comp search reflects your current search parameters — adjust the filters above as needed for a more accurate estimate.
Estimated Value
—
Average $/Sqft
—
Check one or more comps below to calculate an estimate.
Nearest 10 of 84 comparable sales and listings within 1 mile of this home. Use the filters above and press Search to refine.
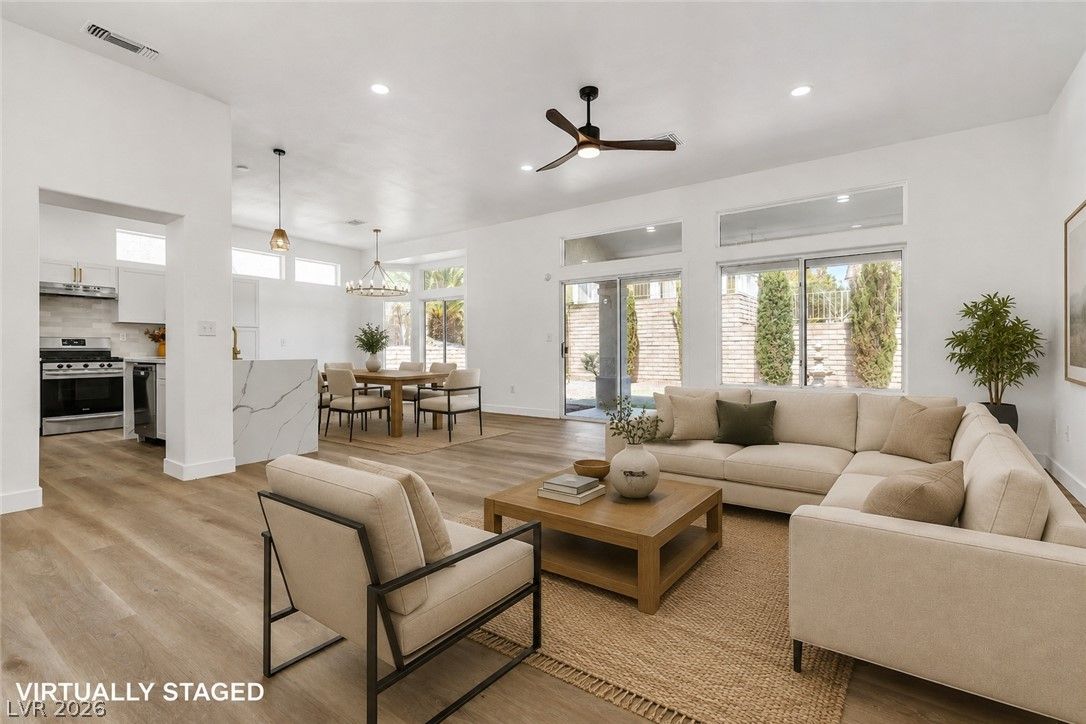
10636 Argents Hill DriveActive
$499,4002 bd2 ba1,533 sqft$326/sqft0.09 mi69 days
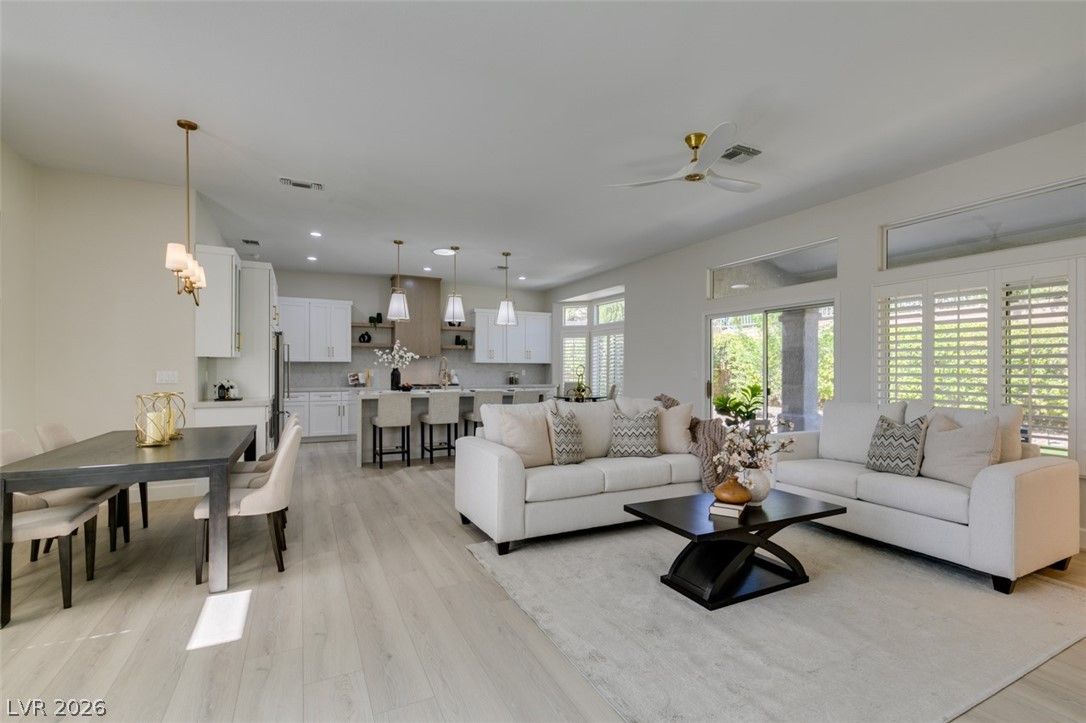
$600,0002 bd2 ba1,533 sqft$391/sqft0.16 mi113 daysSold 2026-08-07
$407,0002 bd2 ba1,699 sqft$240/sqft0.19 mi84 daysSold 2026-06-22
$358,0002 bd2 ba1,287 sqft$278/sqft0.19 mi13 daysSold 2026-07-20
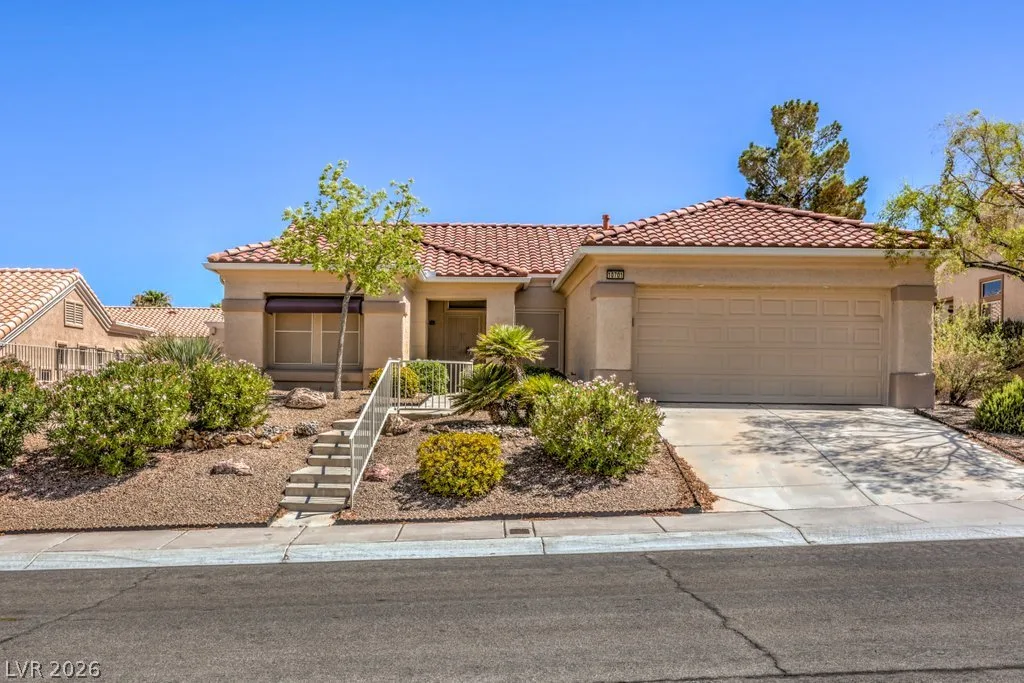
10701 Sky Meadows AvenueActive
$415,0002 bd2 ba1,520 sqft$273/sqft0.20 mi0 days

$429,0002 bd2 ba1,360 sqft$315/sqft0.21 mi48 days
$455,0002 bd2 ba1,533 sqft$297/sqft0.22 mi42 daysSold 2026-05-01
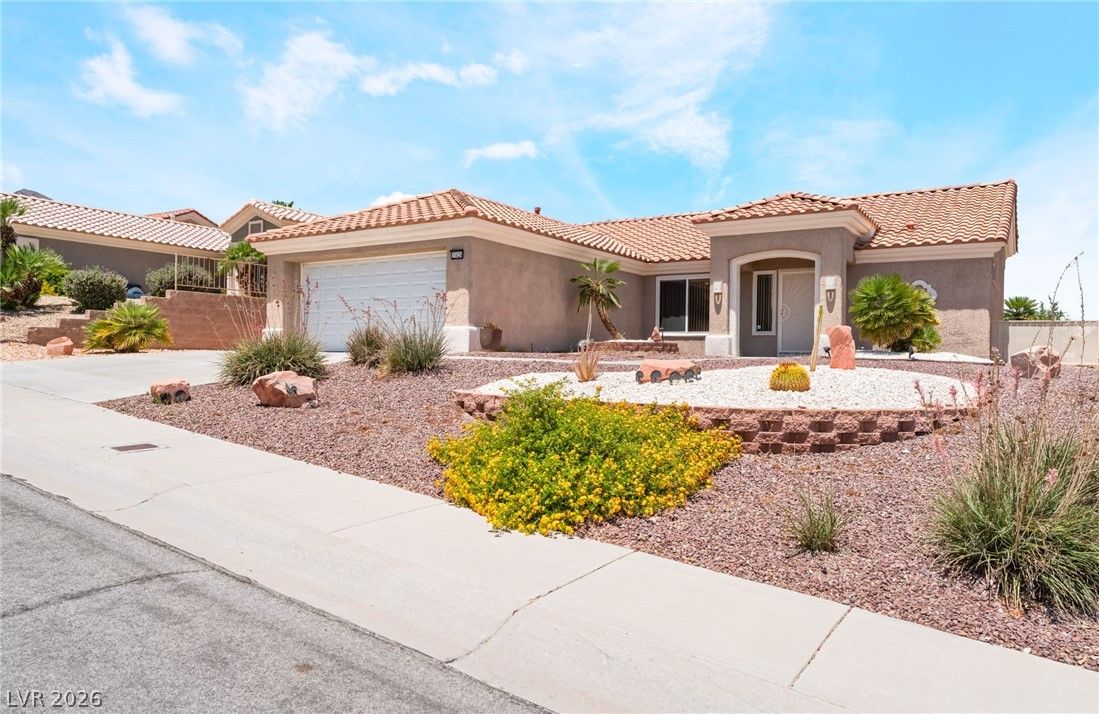
10424 Marymont PlaceActive
$435,0002 bd2 ba1,402 sqft$310/sqft0.26 mi48 days

$450,0002 bd2 ba1,520 sqft$296/sqft0.27 mi17 daysSold 2026-09-30
$482,2502 bd2 ba1,402 sqft$344/sqft0.31 mi46 daysSold 2026-04-24
Nearest comparable sales and listings
12 comparables · median price $443,250 · range $358,000 – $625,000 · median $/sq ft $304 · average $/sq ft $312
| Address | Status | Price | $/Sq Ft | Bd / Ba | Sq Ft | Sold / market time | Distance |
|---|---|---|---|---|---|---|---|
| 10636 Argents Hill Drive | Active | $499,400 | $326 | 2 / 2 | 1,533 | 69 days on market | 0.09 mi |
| 10724 Argents Hill Drive | Sold | $600,000 | $391 | 2 / 2 | 1,533 | Sold 2026-08-07 | 0.16 mi |
| 10641 Sky Meadows Avenue | Sold | $407,000 | $240 | 2 / 2 | 1,699 | Sold 2026-06-22 | 0.19 mi |
| 10736 Argents Hill Drive | Sold | $358,000 | $278 | 2 / 2 | 1,287 | Sold 2026-07-20 | 0.19 mi |
| 10701 Sky Meadows Avenue | Active | $415,000 | $273 | 2 / 2 | 1,520 | 0 days on market | 0.20 mi |
| 10700 Grand Cypress Avenue | Active | $429,000 | $315 | 2 / 2 | 1,360 | 48 days on market | 0.21 mi |
| 2601 Hope Forest Drive | Sold | $455,000 | $297 | 2 / 2 | 1,533 | Sold 2026-05-01 | 0.22 mi |
| 10424 Marymont Place | Active | $435,000 | $310 | 2 / 2 | 1,402 | 48 days on market | 0.26 mi |
| 10721 Grand Cypress Avenue | Sold | $450,000 | $296 | 2 / 2 | 1,520 | Sold 2026-09-30 | 0.27 mi |
| 10412 Trenton Place | Sold | $482,250 | $344 | 2 / 2 | 1,402 | Sold 2026-04-24 | 0.31 mi |
| 2629 Hanging Rock Drive | Sold | $436,500 | $262 | 2 / 2 | 1,668 | Sold 2026-07-30 | 0.32 mi |
| 2413 Rockford Street | Active | $625,000 | $408 | 2 / 2 | 1,533 | 58 days on market | 0.33 mi |


