
Comparable Sales Near 802 Warwick Castle Drive, Las Vegas, NV 89178
1st Realty · Comparable sales report · 1st.estate · October 21, 2026
Read the Rhodes Ranch neighborhood guide →
802 Warwick Castle Drive, Las Vegas, NV 89178
Status: Sold
$2,350 Sold Price
$1
$ / Sq Ft
2,322
Living Area
4,356 sqft
Lot Size
4
Beds
3
Baths
2005
Year Built
Search Parameters
Property Type
Status
Radius
Sold Within
Beds
Baths
Living Area (Sq Ft)
Lot Size (Sq Ft)
This comp search reflects your current search parameters — adjust the filters above as needed for a more accurate estimate.
Estimated Value
—
Average $/Sqft
—
Check one or more comps below to calculate an estimate.
Nearest 10 of 64 comparable sales and listings within 1 mile of this home. Use the filters above and press Search to refine.
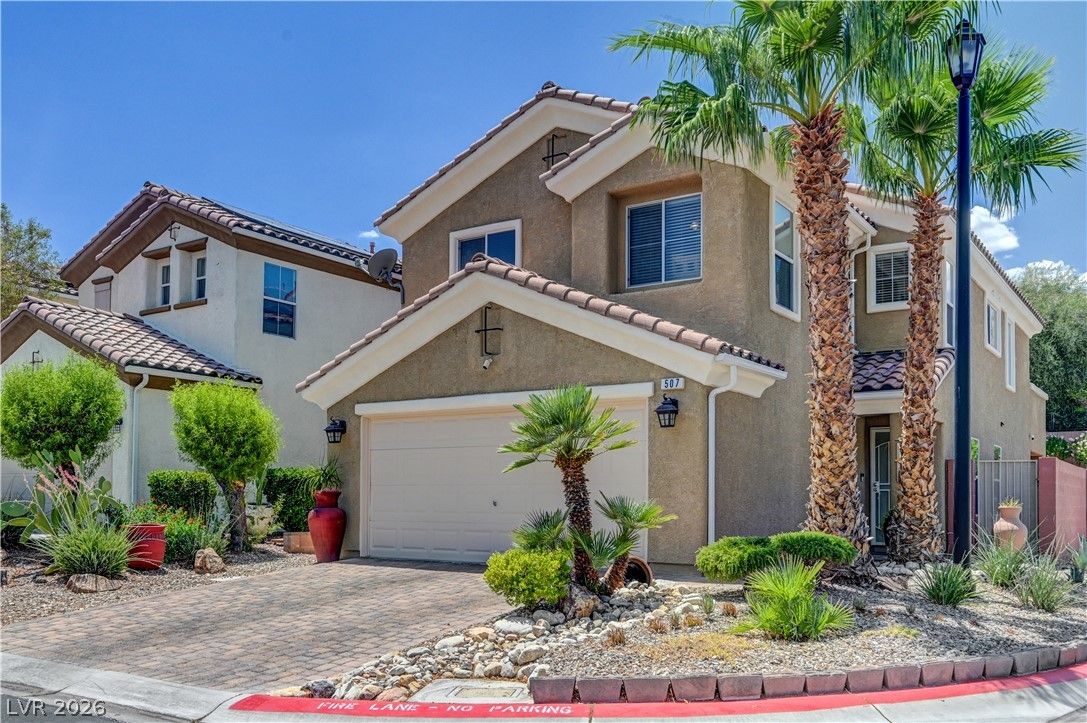
507 Teedale CourtActive
$459,9994 bd3 ba2,034 sqft$226/sqft0.14 mi80 days
$480,0003 bd3 ba2,492 sqft$193/sqft0.22 mi59 daysSold 2026-05-06
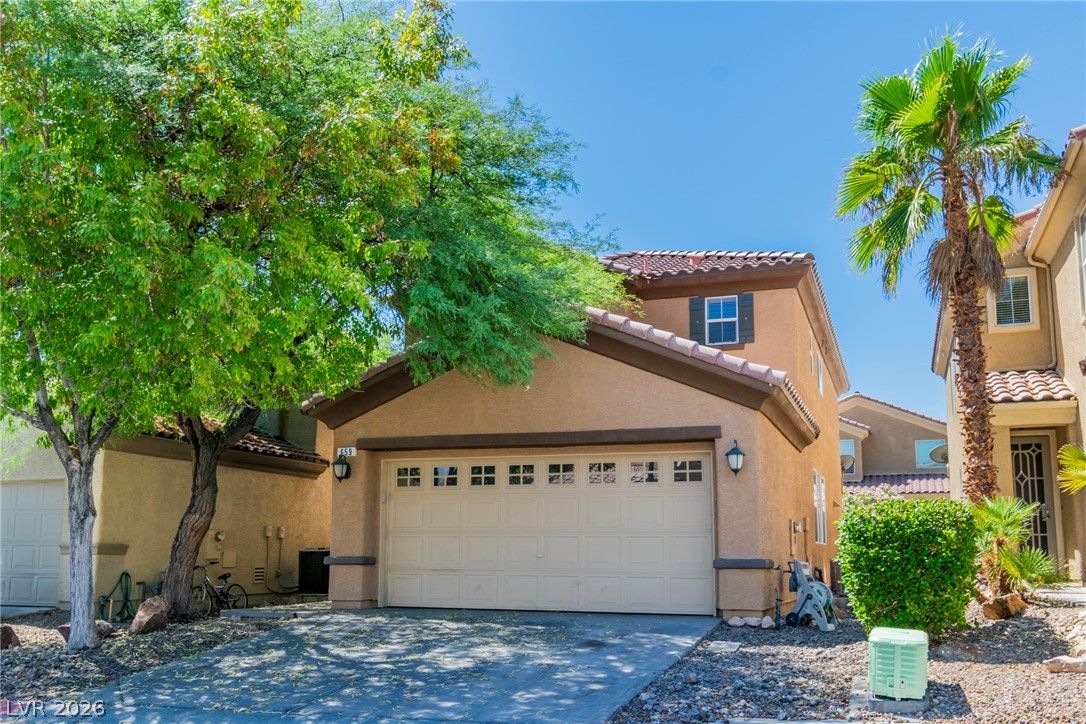
659 Quayside CourtActive
$479,0003 bd3 ba2,000 sqft$240/sqft0.23 mi0 days
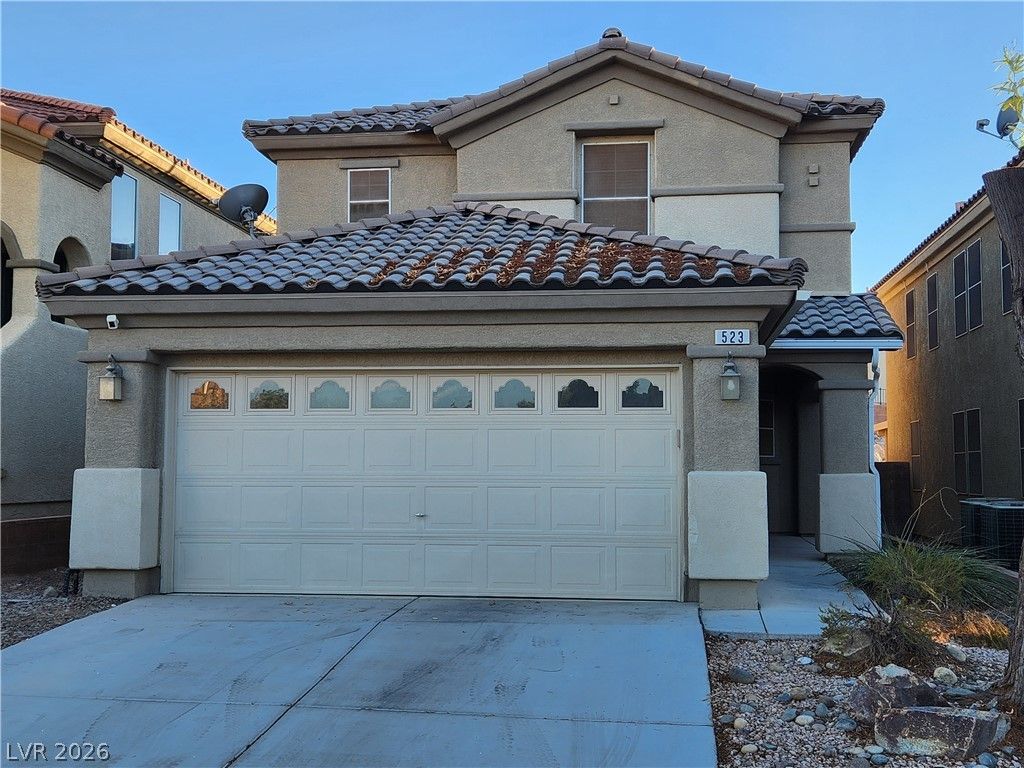
523 Redruth DriveActive
$478,0003 bd3 ba2,000 sqft$239/sqft0.24 mi32 days
$535,0003 bd2 ba1,850 sqft$289/sqft0.27 mi15 daysSold 2026-05-08
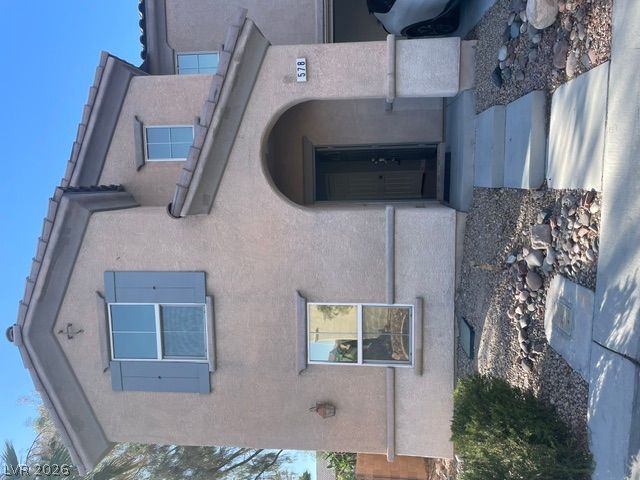
578 Haunts Walk AveActive
$430,0003 bd3 ba1,891 sqft$227/sqft0.33 mi20 days
$565,0005 bd3 ba2,767 sqft$204/sqft0.39 mi12 daysSold 2026-06-01
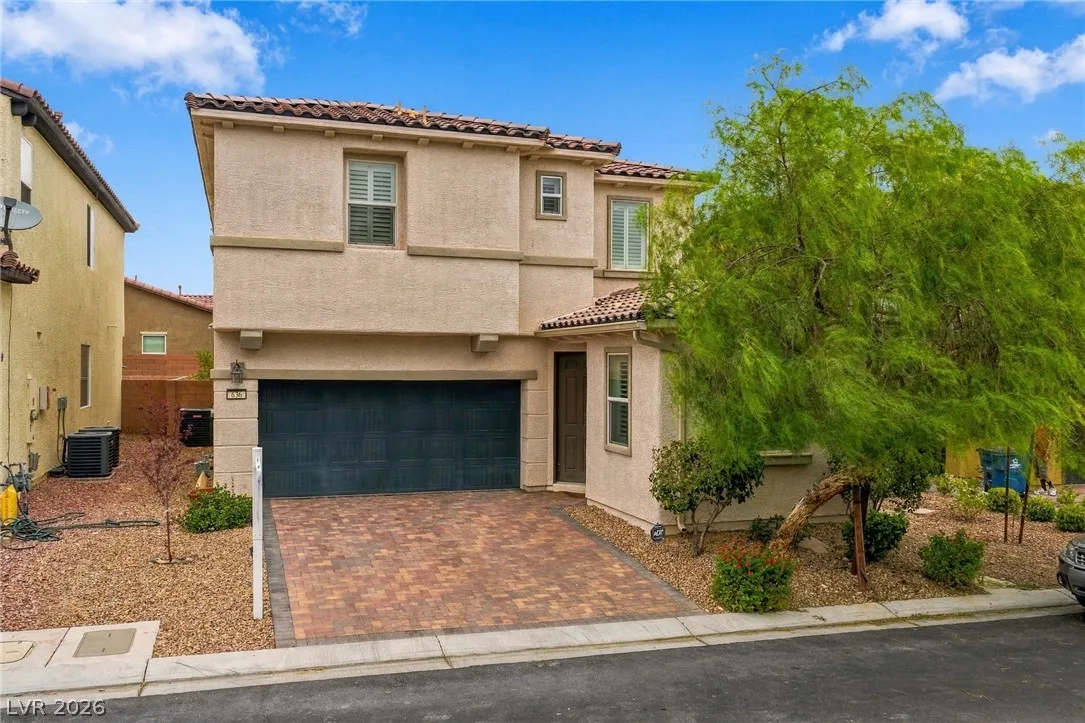
636 Crying Bird AvenueActive
$499,9984 bd3 ba2,332 sqft$214/sqft0.44 mi0 days
$509,0004 bd3 ba2,328 sqft$219/sqft0.45 mi11 daysSold 2026-06-01
$540,0004 bd3 ba2,328 sqft$232/sqft0.45 mi16 daysSold 2026-07-02
Nearest comparable sales and listings
12 comparables · median price $504,499 · range $430,000 – $565,000 · median $/sq ft $230 · average $/sq ft $232
| Address | Status | Price | $/Sq Ft | Bd / Ba | Sq Ft | Sold / market time | Distance |
|---|---|---|---|---|---|---|---|
| 507 Teedale Court | Active | $459,999 | $226 | 4 / 3 | 2,034 | 80 days on market | 0.14 mi |
| 436 Merseyside Drive | Sold | $480,000 | $193 | 3 / 3 | 2,492 | Sold 2026-05-06 | 0.22 mi |
| 659 Quayside Court | Active | $479,000 | $240 | 3 / 3 | 2,000 | 0 days on market | 0.23 mi |
| 523 Redruth Drive | Active | $478,000 | $239 | 3 / 3 | 2,000 | 32 days on market | 0.24 mi |
| 778 Star Apple Lane | Sold | $535,000 | $289 | 3 / 2 | 1,850 | Sold 2026-05-08 | 0.27 mi |
| 578 Haunts Walk Ave | Active | $430,000 | $227 | 3 / 3 | 1,891 | 20 days on market | 0.33 mi |
| 9990 Bleeding Heart Avenue | Sold | $565,000 | $204 | 5 / 3 | 2,767 | Sold 2026-06-01 | 0.39 mi |
| 636 Crying Bird Avenue | Active | $499,998 | $214 | 4 / 3 | 2,332 | 0 days on market | 0.44 mi |
| 8624 Earl Creek Street | Sold | $509,000 | $219 | 4 / 3 | 2,328 | Sold 2026-06-01 | 0.45 mi |
| 8623 Reynolds Spring Street | Sold | $540,000 | $232 | 4 / 3 | 2,328 | Sold 2026-07-02 | 0.45 mi |
| 8169 Hafner Street | Active | $555,000 | $238 | 3 / 3 | 2,328 | 47 days on market | 0.48 mi |
| 576 Crying Bird Avenue | Sold | $527,500 | $263 | 3 / 3 | 2,004 | Sold 2026-05-28 | 0.48 mi |


