
Comparable Sales Near 2073 Hocus Pocus Place, Henderson, NV 89002
1st Realty · Comparable sales report · 1st.estate · October 21, 2026
Read the Henderson area guide →
2073 Hocus Pocus Place, Henderson, NV 89002
Status: Sold
$499,990 Sold Price
$208
$ / Sq Ft
2,405
Living Area
3,920 sqft
Lot Size
5
Beds
3
Baths
2012
Year Built
Search Parameters
Property Type
Status
Radius
Sold Within
Beds
Baths
Living Area (Sq Ft)
Lot Size (Sq Ft)
This comp search reflects your current search parameters — adjust the filters above as needed for a more accurate estimate.
Estimated Value
—
Average $/Sqft
—
Check one or more comps below to calculate an estimate.
Nearest 10 of 23 comparable sales and listings within 1 mile of this home. Use the filters above and press Search to refine.
$525,0004 bd3 ba2,574 sqft$204/sqft0.32 mi19 daysSold 2026-06-03
664 Sunrise LakeSold
$470,0005 bd3 ba2,260 sqft$208/sqft0.32 mi14 daysSold 2026-06-30
$460,0005 bd3 ba2,260 sqft$204/sqft0.34 mi51 daysSold 2026-07-22
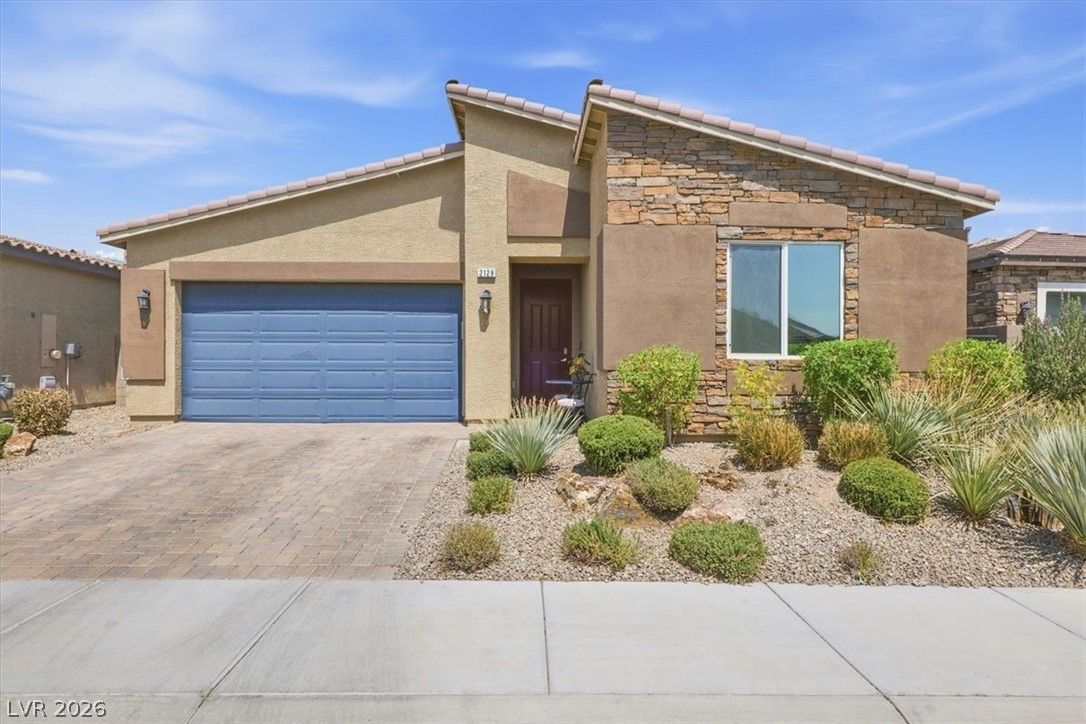
2128 Del Aqua AvenueActive
$525,0004 bd3 ba2,035 sqft$258/sqft0.35 mi0 days
$561,0004 bd4 ba2,617 sqft$214/sqft0.37 mi85 daysSold 2026-04-27
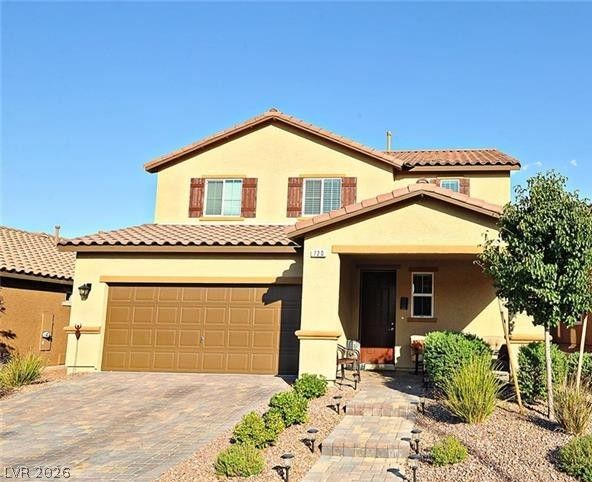
720 Nerka DriveActive
$499,0004 bd4 ba2,617 sqft$191/sqft0.40 mi57 days
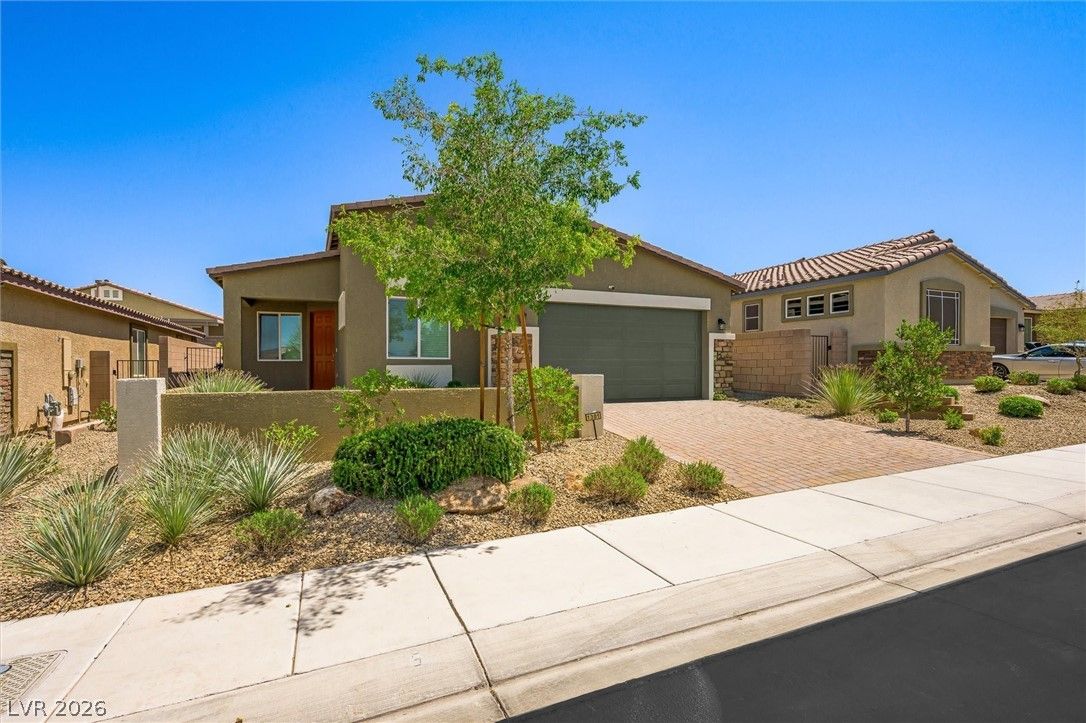
$489,8804 bd2 ba1,824 sqft$269/sqft0.40 mi35 daysSold 2026-07-24
$474,0005 bd3 ba2,460 sqft$193/sqft0.43 mi91 daysSold 2026-07-10
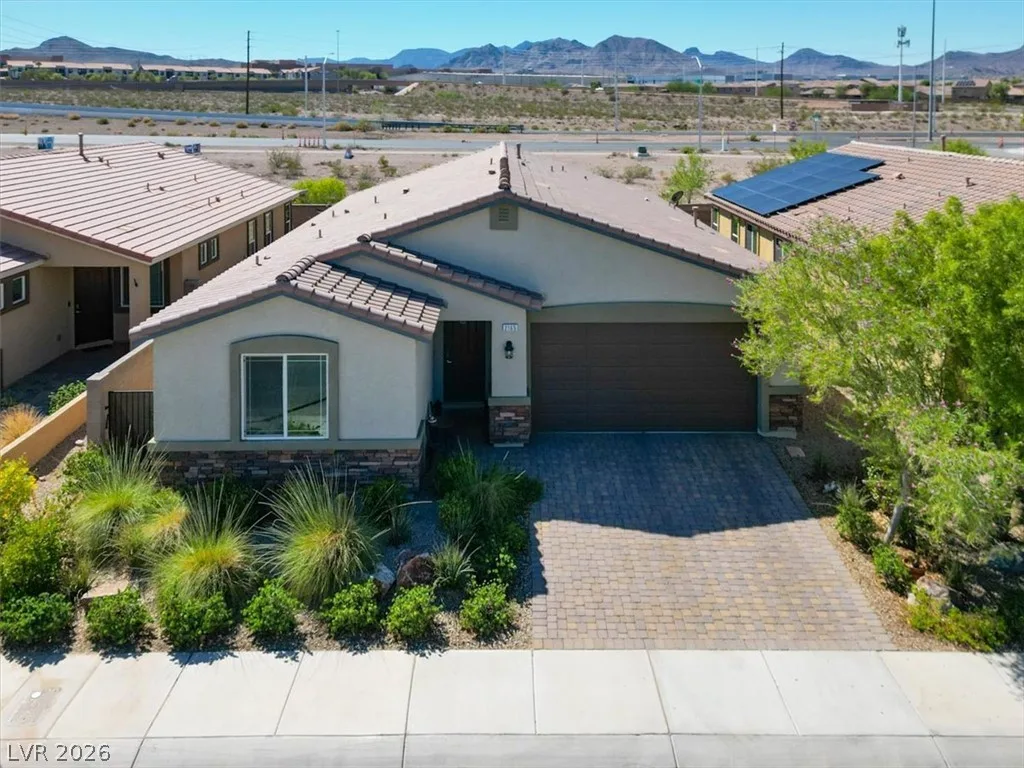
$550,0004 bd3 ba2,035 sqft$270/sqft0.45 mi2 days
$405,0005 bd3 ba2,260 sqft$179/sqft0.52 mi111 daysSold 2026-07-17
Nearest comparable sales and listings
12 comparables · median price $494,440 · range $405,000 – $561,000 · median $/sq ft $206 · average $/sq ft $216
| Address | Status | Price | $/Sq Ft | Bd / Ba | Sq Ft | Sold / market time | Distance |
|---|---|---|---|---|---|---|---|
| 694 Bollons Island Street | Sold | $525,000 | $204 | 4 / 3 | 2,574 | Sold 2026-06-03 | 0.32 mi |
| 664 Sunrise Lake | Sold | $470,000 | $208 | 5 / 3 | 2,260 | Sold 2026-06-30 | 0.32 mi |
| 1028 Roaring River Avenue | Sold | $460,000 | $204 | 5 / 3 | 2,260 | Sold 2026-07-22 | 0.34 mi |
| 2128 Del Aqua Avenue | Active | $525,000 | $258 | 4 / 3 | 2,035 | 0 days on market | 0.35 mi |
| 689 Silver Pearl Street | Sold | $561,000 | $214 | 4 / 4 | 2,617 | Sold 2026-04-27 | 0.37 mi |
| 720 Nerka Drive | Active | $499,000 | $191 | 4 / 4 | 2,617 | 57 days on market | 0.40 mi |
| 1301 Luna Del Oro Lane | Sold | $489,880 | $269 | 4 / 2 | 1,824 | Sold 2026-07-24 | 0.40 mi |
| 731 Gulf Pearl Drive | Sold | $474,000 | $193 | 5 / 3 | 2,460 | Sold 2026-07-10 | 0.43 mi |
| 2165 Rio Rancho Pointe Place | Active | $550,000 | $270 | 4 / 3 | 2,035 | 2 days on market | 0.45 mi |
| 540 Big Lake Street | Sold | $405,000 | $179 | 5 / 3 | 2,260 | Sold 2026-07-17 | 0.52 mi |
| 891 Harbor Avenue | Active | $469,900 | $223 | 5 / 3 | 2,104 | 1 days on market | 0.54 mi |
| 2221 Mundare Drive | Active | $545,000 | $185 | 5 / 3 | 2,943 | 18 days on market | 0.54 mi |


