
Comparable Sales Near 689 Brandy Hill Place, Henderson, NV 89052
1st Realty · Comparable sales report · 1st.estate · October 21, 2026
Read the Henderson area guide →
689 Brandy Hill Place, Henderson, NV 89052
Status: Sold
$695,000 Sold Price
$253
$ / Sq Ft
2,745
Living Area
7,841 sqft
Lot Size
5
Beds
3
Baths
2002
Year Built
Search Parameters
Property Type
Status
Radius
Sold Within
Beds
Baths
Living Area (Sq Ft)
Lot Size (Sq Ft)
This comp search reflects your current search parameters — adjust the filters above as needed for a more accurate estimate.
Estimated Value
—
Average $/Sqft
—
Check one or more comps below to calculate an estimate.
Nearest 10 of 34 comparable sales and listings within 1 mile of this home. Use the filters above and press Search to refine.
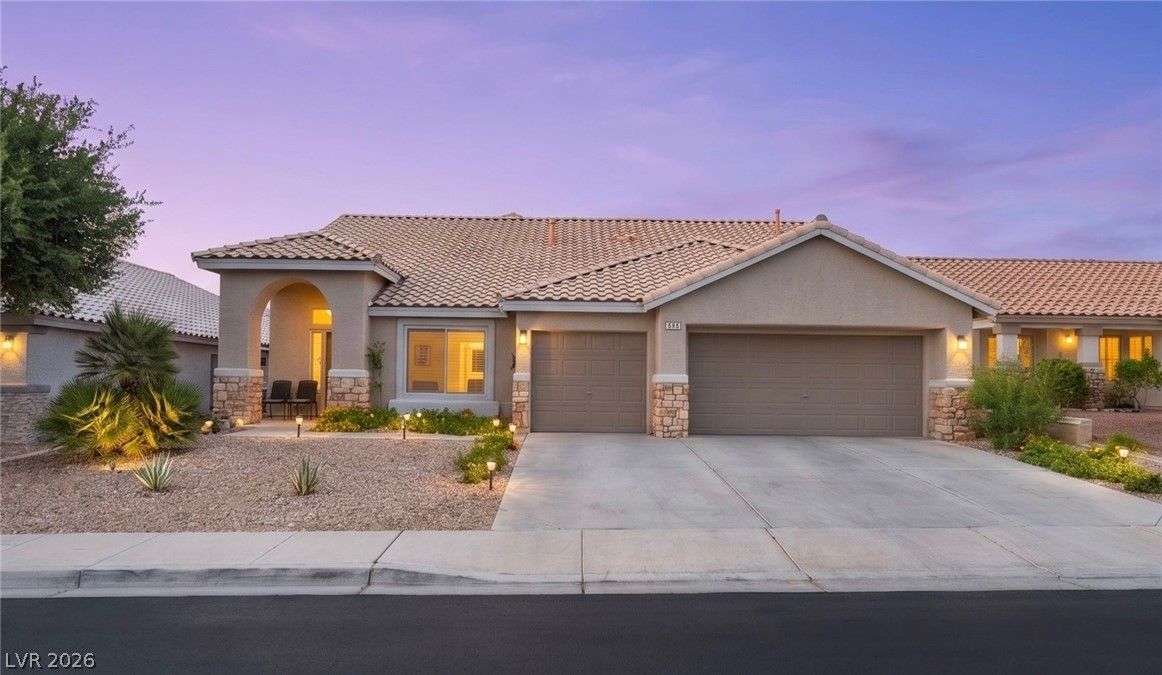
686 Pansy PlaceSold
$667,7504 bd2 ba2,101 sqft$318/sqft0.04 mi107 daysSold 2026-08-26
$716,0004 bd3 ba2,754 sqft$260/sqft0.14 mi45 daysSold 2026-06-22
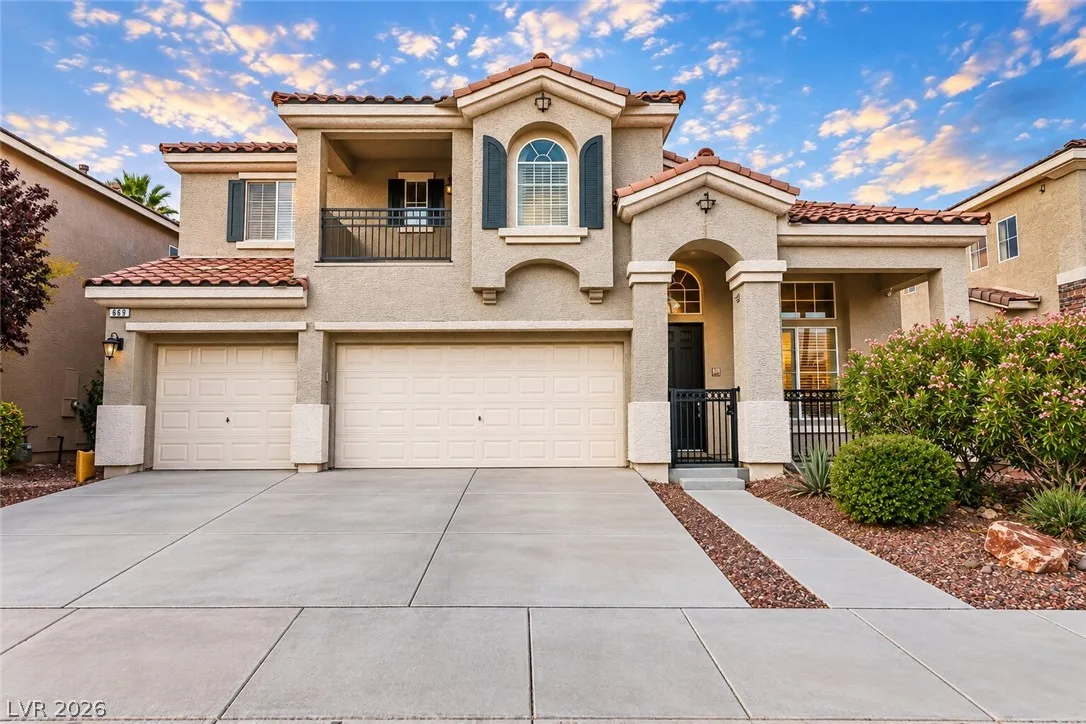
669 Doubleshot LaneActive
$749,8884 bd3 ba2,988 sqft$251/sqft0.27 mi9 days
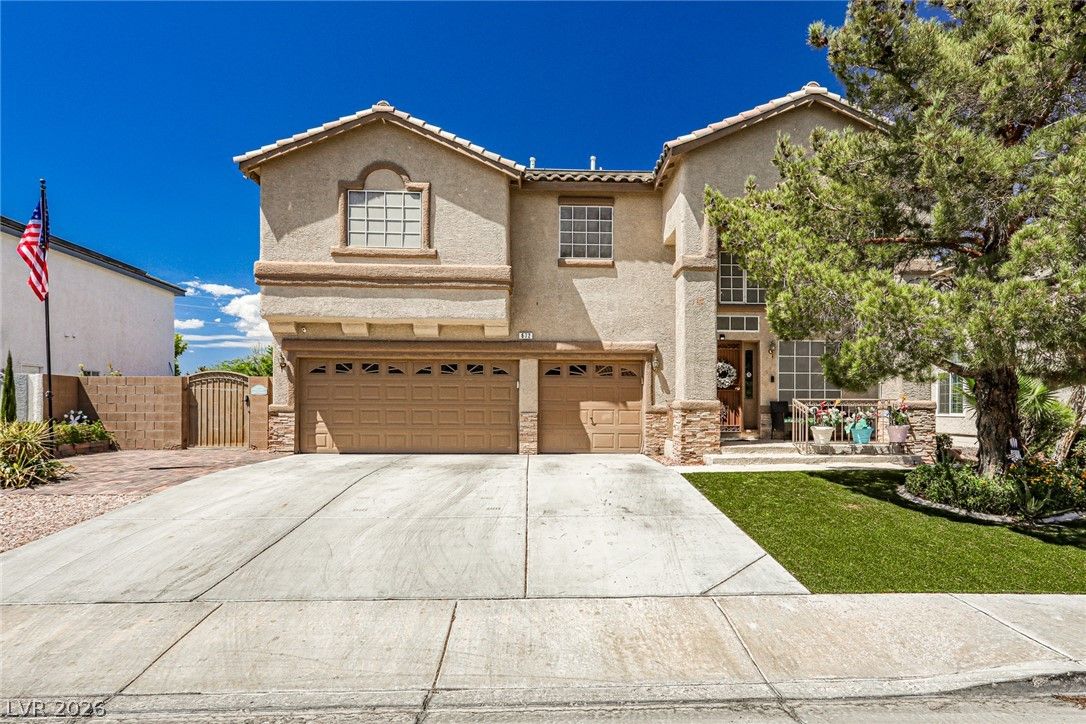
672 Kentons Run AvenueActive
$799,8884 bd3 ba2,746 sqft$291/sqft0.29 mi45 days

2746 Canarsy CourtActive
$595,0004 bd2 ba2,101 sqft$283/sqft0.38 mi77 days
$1,000,0004 bd3 ba3,077 sqft$325/sqft0.38 mi33 daysSold 2026-06-24
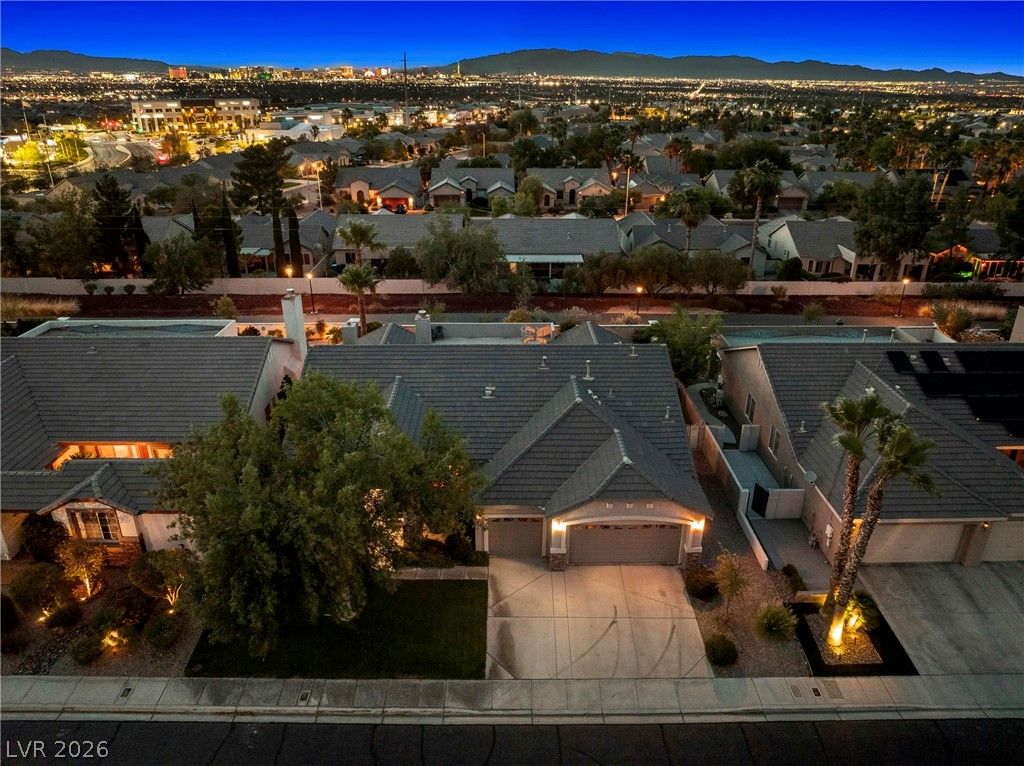
348 Quiet Harbor DriveUnder Contract
$850,0004 bd4 ba2,856 sqft$298/sqft0.50 mi36 days
$950,0004 bd4 ba2,606 sqft$365/sqft0.56 mi7 daysSold 2026-05-11
$705,0004 bd3 ba2,679 sqft$263/sqft0.59 mi31 daysSold 2026-06-30
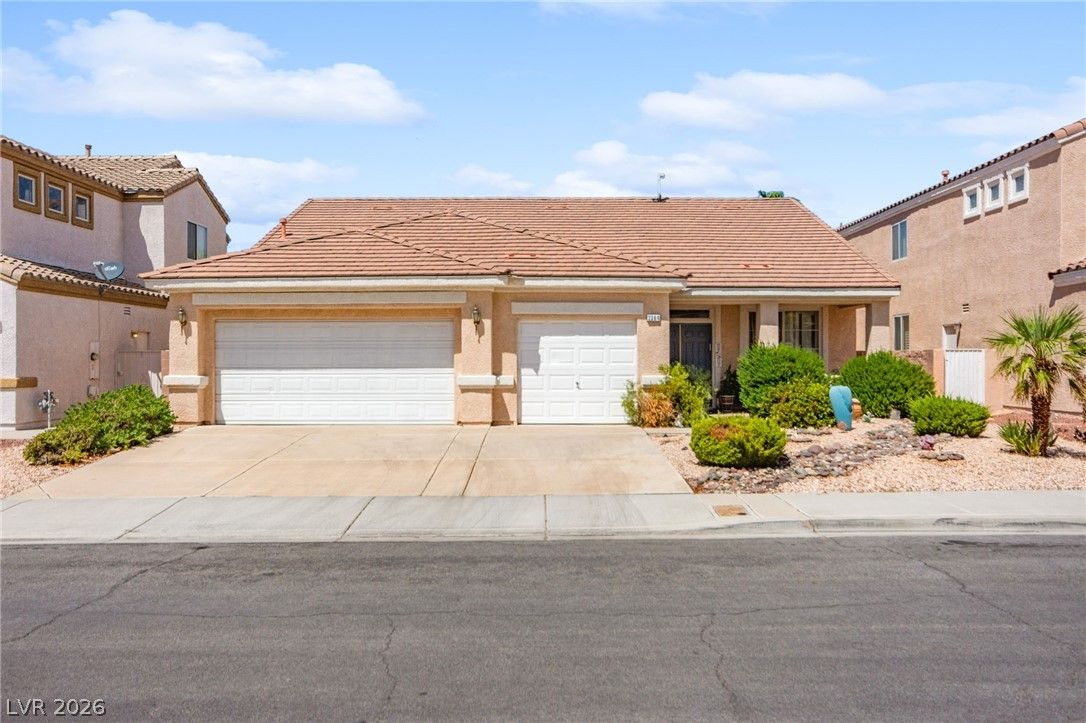
2364 Kenneth AvenueActive
$550,0004 bd2 ba2,084 sqft$264/sqft0.62 mi0 days
Nearest comparable sales and listings
12 comparables · median price $732,944 · range $550,000 – $1,000,000 · median $/sq ft $274 · average $/sq ft $282
| Address | Status | Price | $/Sq Ft | Bd / Ba | Sq Ft | Sold / market time | Distance |
|---|---|---|---|---|---|---|---|
| 686 Pansy Place | Sold | $667,750 | $318 | 4 / 2 | 2,101 | Sold 2026-08-26 | 0.04 mi |
| 2668 Bad Rock Circle | Sold | $716,000 | $260 | 4 / 3 | 2,754 | Sold 2026-06-22 | 0.14 mi |
| 669 Doubleshot Lane | Active | $749,888 | $251 | 4 / 3 | 2,988 | 9 days on market | 0.27 mi |
| 672 Kentons Run Avenue | Active | $799,888 | $291 | 4 / 3 | 2,746 | 45 days on market | 0.29 mi |
| 2746 Canarsy Court | Active | $595,000 | $283 | 4 / 2 | 2,101 | 77 days on market | 0.38 mi |
| 327 Quiet Harbor Drive | Sold | $1,000,000 | $325 | 4 / 3 | 3,077 | Sold 2026-06-24 | 0.38 mi |
| 348 Quiet Harbor Drive | Under Contract | $850,000 | $298 | 4 / 4 | 2,856 | 36 days on market | 0.50 mi |
| 2516 Silver Beach Drive | Sold | $950,000 | $365 | 4 / 4 | 2,606 | Sold 2026-05-11 | 0.56 mi |
| 741 Wildwood Beach Avenue | Sold | $705,000 | $263 | 4 / 3 | 2,679 | Sold 2026-06-30 | 0.59 mi |
| 2364 Kenneth Avenue | Active | $550,000 | $264 | 4 / 2 | 2,084 | 0 days on market | 0.62 mi |
| 2899 Evergold Drive | Sold | $799,000 | $245 | 5 / 4 | 3,255 | Sold 2026-07-10 | 0.62 mi |
| 2722 Bass Lake Street | Active | $650,000 | $215 | 5 / 3 | 3,017 | 37 days on market | 0.65 mi |


