
Comparable Sales Near 287 Mount Langley Street, Henderson, NV 89015
1st Realty · Comparable sales report · 1st.estate · October 21, 2026
Read the Henderson area guide →
287 Mount Langley Street, Henderson, NV 89015
Status: Sold
$2,600 Sold Price
$1
$ / Sq Ft
2,462
Living Area
6,534 sqft
Lot Size
3
Beds
3
Baths
2023
Year Built
Search Parameters
Property Type
Status
Radius
Sold Within
Beds
Baths
Living Area (Sq Ft)
Lot Size (Sq Ft)
This comp search reflects your current search parameters — adjust the filters above as needed for a more accurate estimate.
Estimated Value
—
Average $/Sqft
—
Check one or more comps below to calculate an estimate.
Nearest 10 of 16 comparable sales and listings within 1 mile of this home. Use the filters above and press Search to refine.
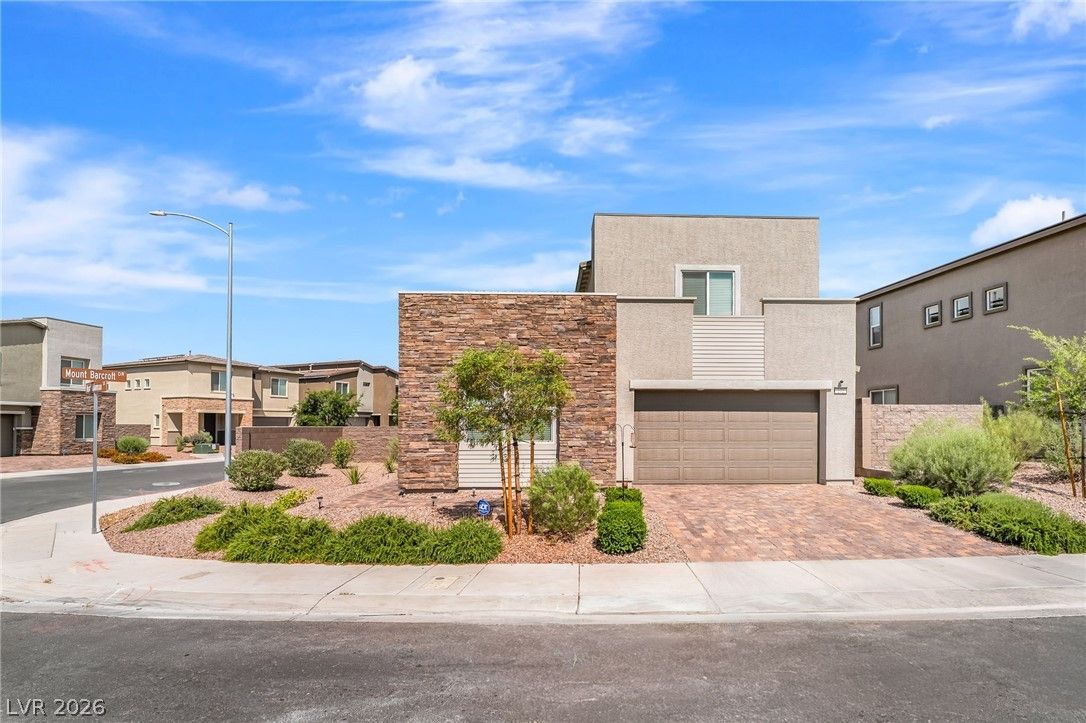
$605,0004 bd4 ba2,861 sqft$211/sqft0.11 mi14 daysSold 2026-08-07
$675,0004 bd3 ba2,431 sqft$278/sqft0.18 mi2 daysSold 2026-06-22
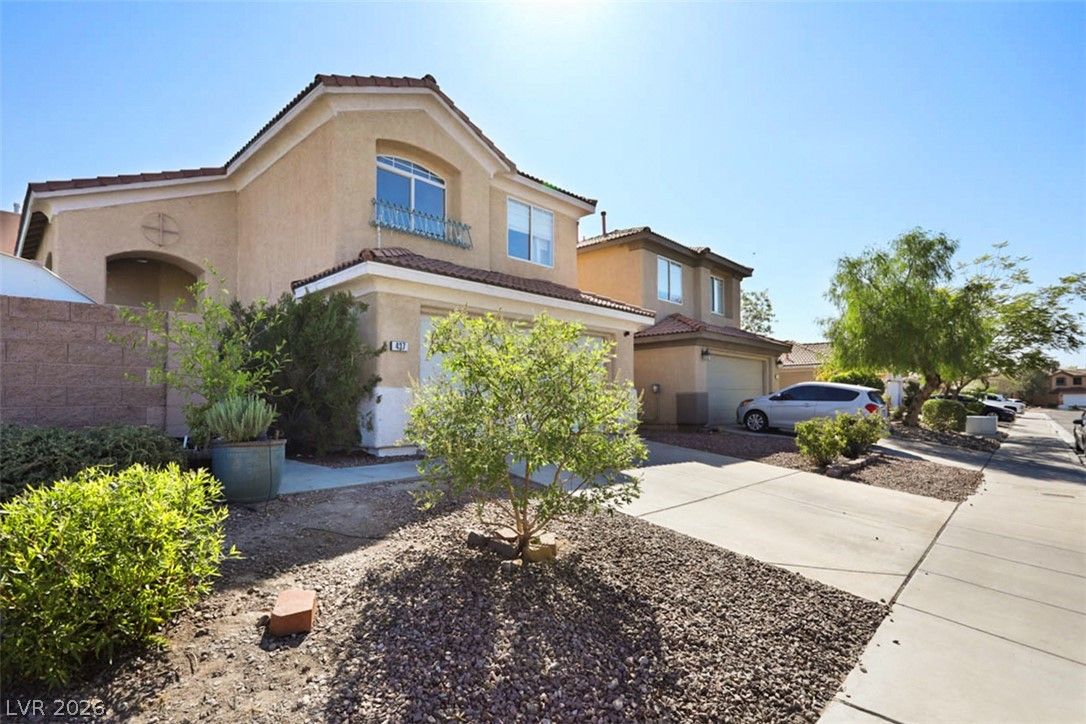
$450,0004 bd3 ba1,866 sqft$241/sqft0.48 mi15 daysSold 2026-10-05
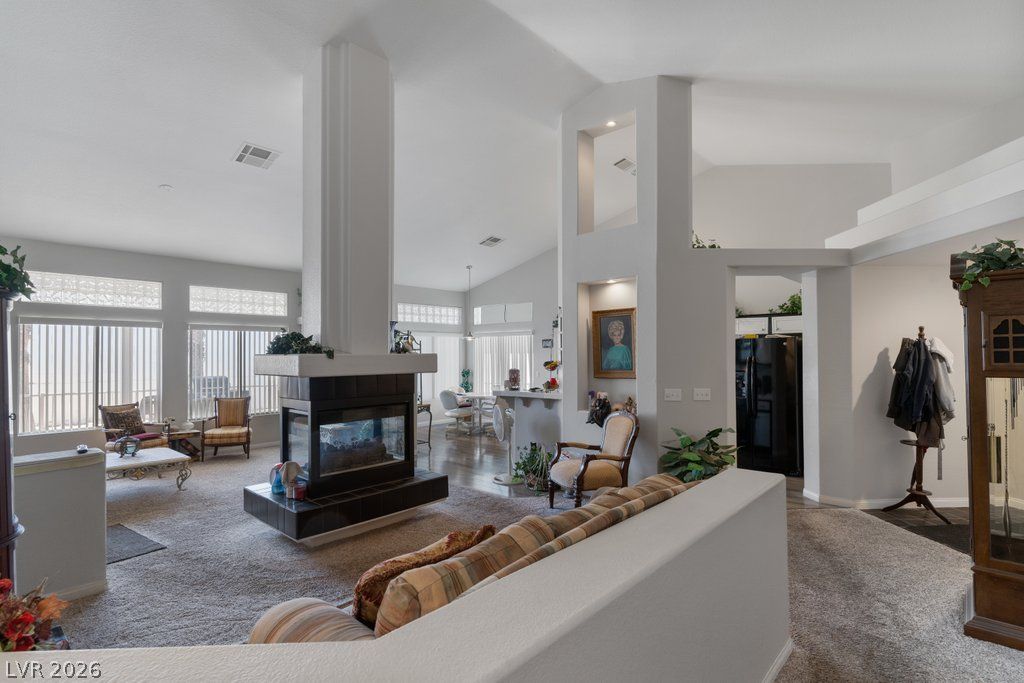
$425,0003 bd3 ba2,179 sqft$195/sqft0.51 mi75 days
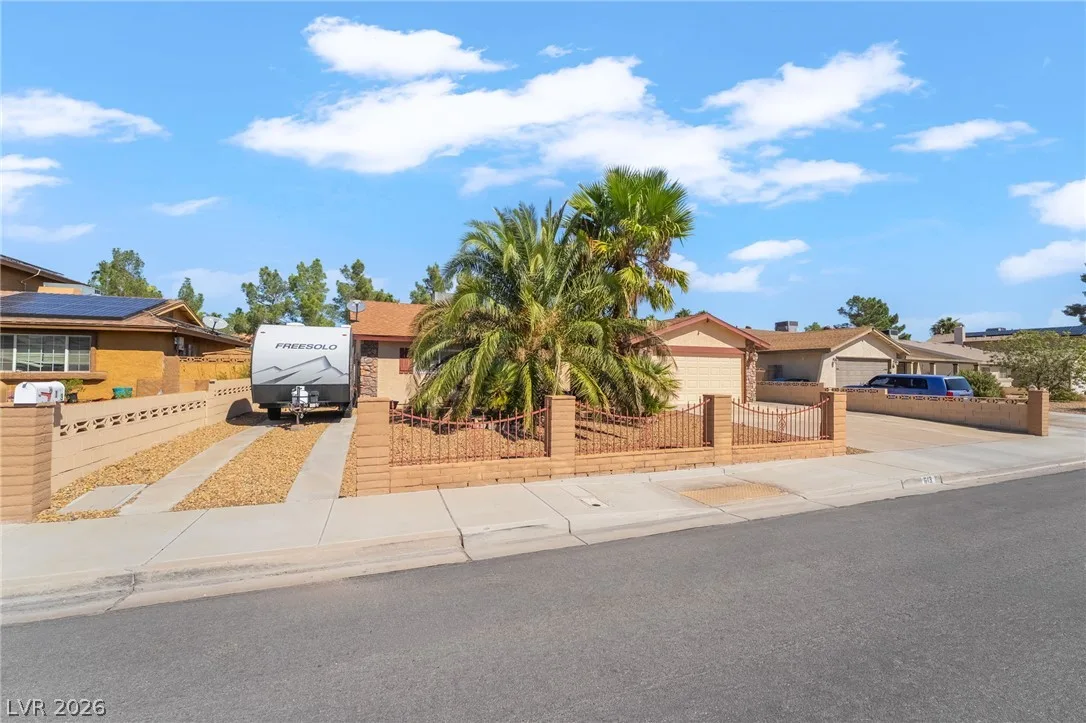
613 Valley View DriveActive
$480,0003 bd2 ba2,052 sqft$234/sqft0.60 mi0 days
$500,0003 bd4 ba1,855 sqft$270/sqft0.63 mi7 daysSold 2026-05-08
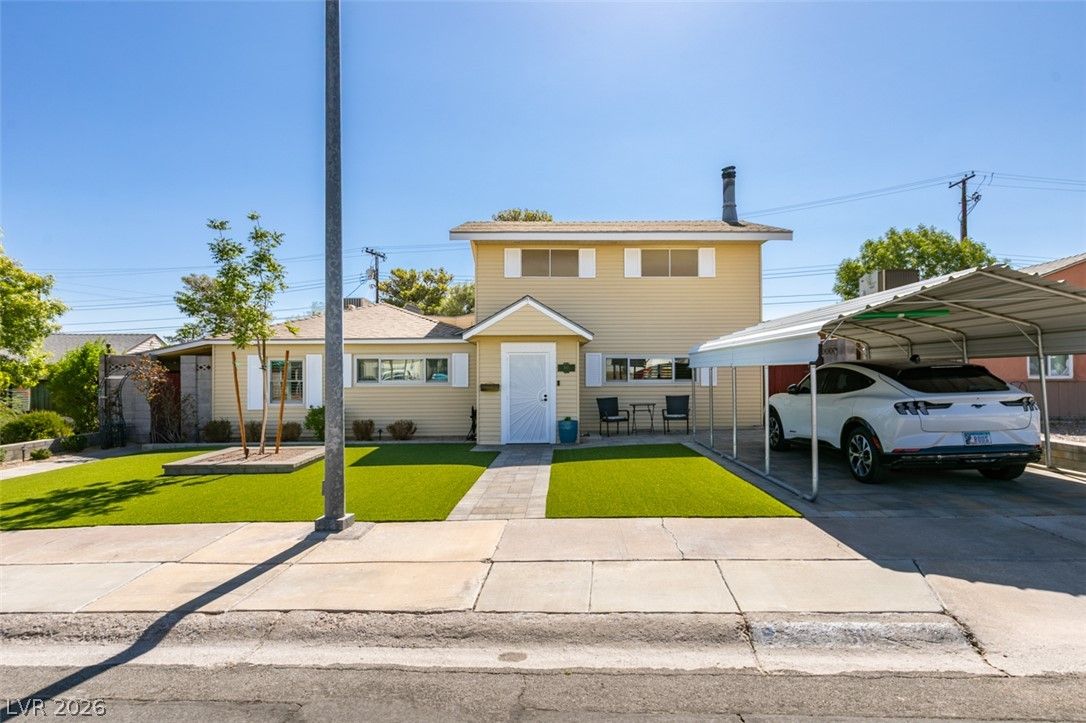
$390,0003 bd2 ba2,317 sqft$168/sqft0.63 mi18 daysSold 2026-10-07
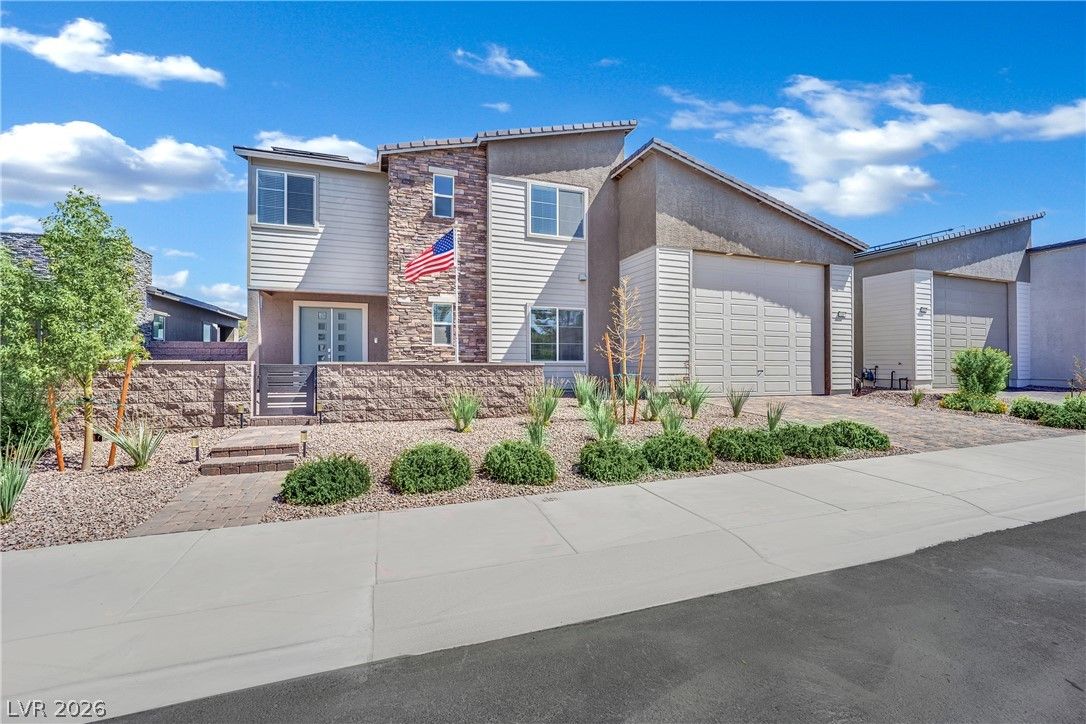
$825,0004 bd4 ba2,641 sqft$312/sqft0.70 mi9 days
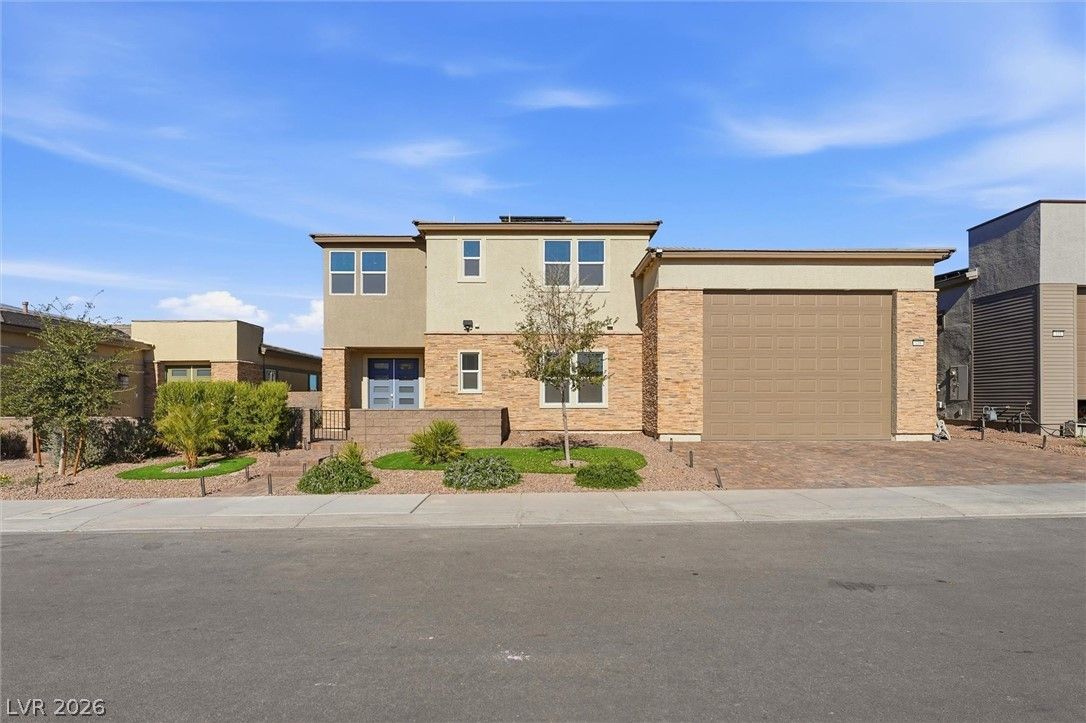
$775,0004 bd4 ba2,641 sqft$293/sqft0.72 mi56 days
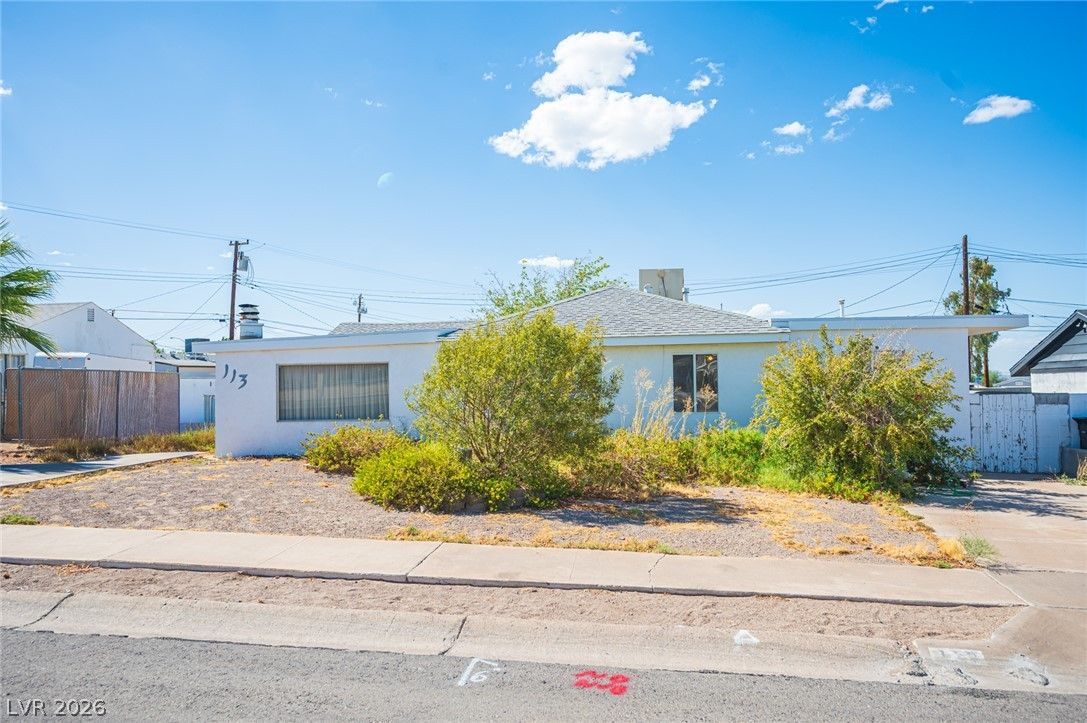
113 South Major AvenueActive
$350,0003 bd2 ba1,991 sqft$176/sqft0.81 mi27 days
Nearest comparable sales and listings
12 comparables · median price $466,000 · range $350,000 – $825,000 · median $/sq ft $238 · average $/sq ft $238
| Address | Status | Price | $/Sq Ft | Bd / Ba | Sq Ft | Sold / market time | Distance |
|---|---|---|---|---|---|---|---|
| 272 Mount Williamson Street | Sold | $605,000 | $211 | 4 / 4 | 2,861 | Sold 2026-08-07 | 0.11 mi |
| 226 Augusta Ridge Court | Sold | $675,000 | $278 | 4 / 3 | 2,431 | Sold 2026-06-22 | 0.18 mi |
| 437 Waterbrook Drive | Sold | $450,000 | $241 | 4 / 3 | 1,866 | Sold 2026-10-05 | 0.48 mi |
| 695 North Pearl Island Drive | Active | $425,000 | $195 | 3 / 3 | 2,179 | 75 days on market | 0.51 mi |
| 613 Valley View Drive | Active | $480,000 | $234 | 3 / 2 | 2,052 | 0 days on market | 0.60 mi |
| 625 Glenwood Lane | Sold | $500,000 | $270 | 3 / 4 | 1,855 | Sold 2026-05-08 | 0.63 mi |
| 661 Burton Street | Sold | $390,000 | $168 | 3 / 2 | 2,317 | Sold 2026-10-07 | 0.63 mi |
| 120 Barclay Heights Avenue | Active | $825,000 | $312 | 4 / 4 | 2,641 | 9 days on market | 0.70 mi |
| 116 Barclay Heights Avenue | Active | $775,000 | $293 | 4 / 4 | 2,641 | 56 days on market | 0.72 mi |
| 113 South Major Avenue | Active | $350,000 | $176 | 3 / 2 | 1,991 | 27 days on market | 0.81 mi |
| 684 Mineral Hill Lane | Sold | $452,000 | $242 | 3 / 2 | 1,867 | Sold 2026-09-08 | 0.85 mi |
| 785 Grape Vine Avenue | Sold | $440,000 | $233 | 3 / 3 | 1,890 | Sold 2026-04-30 | 0.91 mi |


