
Comparable Sales Near 5415 West Harmon Avenue 2087, Las Vegas, NV 89103
1st Realty · Comparable sales report · 1st.estate · October 20, 2026
Read the Spring Valley neighborhood guide →
5415 West Harmon Avenue 2087, Las Vegas, NV 89103
Status: Sold
$1,200 Sold Price
$2
$ / Sq Ft
723
Living Area
7,044 sqft
Lot Size
1
Beds
1
Baths
1996
Year Built
Search Parameters
Property Type
Status
Radius
Sold Within
Beds
Baths
Living Area (Sq Ft)
Lot Size (Sq Ft)
This comp search reflects your current search parameters — adjust the filters above as needed for a more accurate estimate.
Estimated Value
—
Average $/Sqft
—
Check one or more comps below to calculate an estimate.
Nearest 10 of 12 comparable sales and listings within 1 mile of this home. Use the filters above and press Search to refine.
$90,0001 bd1 ba700 sqft$129/sqft0.29 mi77 daysSold 2026-05-19
$140,0001 bd1 ba700 sqft$200/sqft0.42 mi96 daysSold 2026-06-08
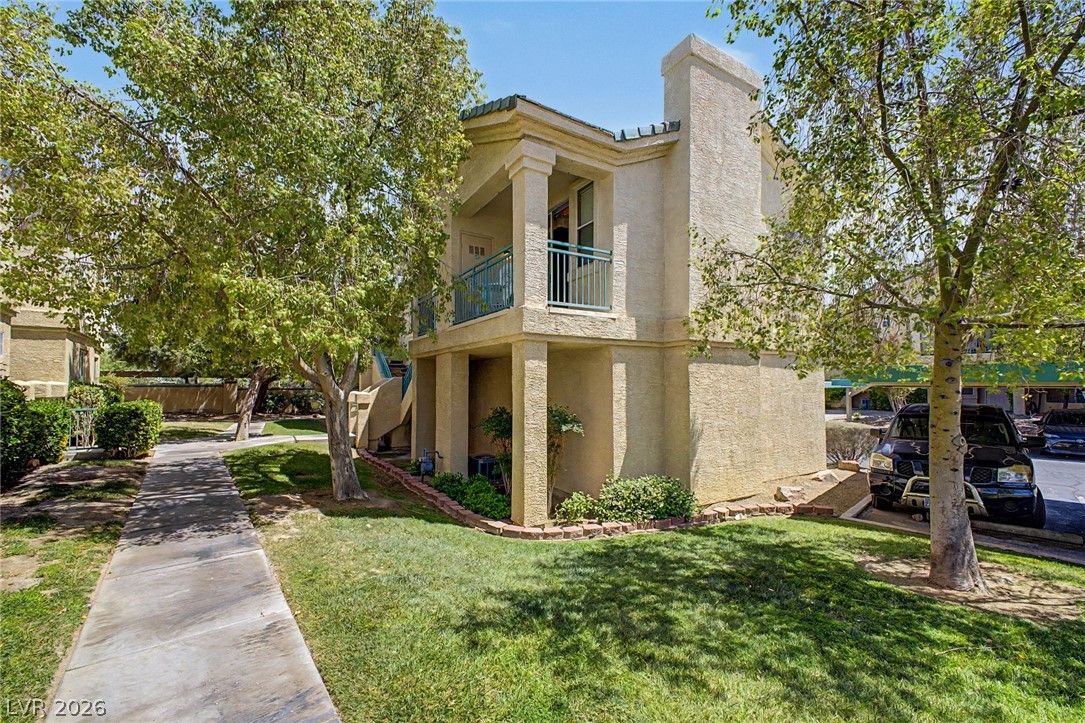
$220,0001 bd1 ba774 sqft$284/sqft0.46 mi96 days
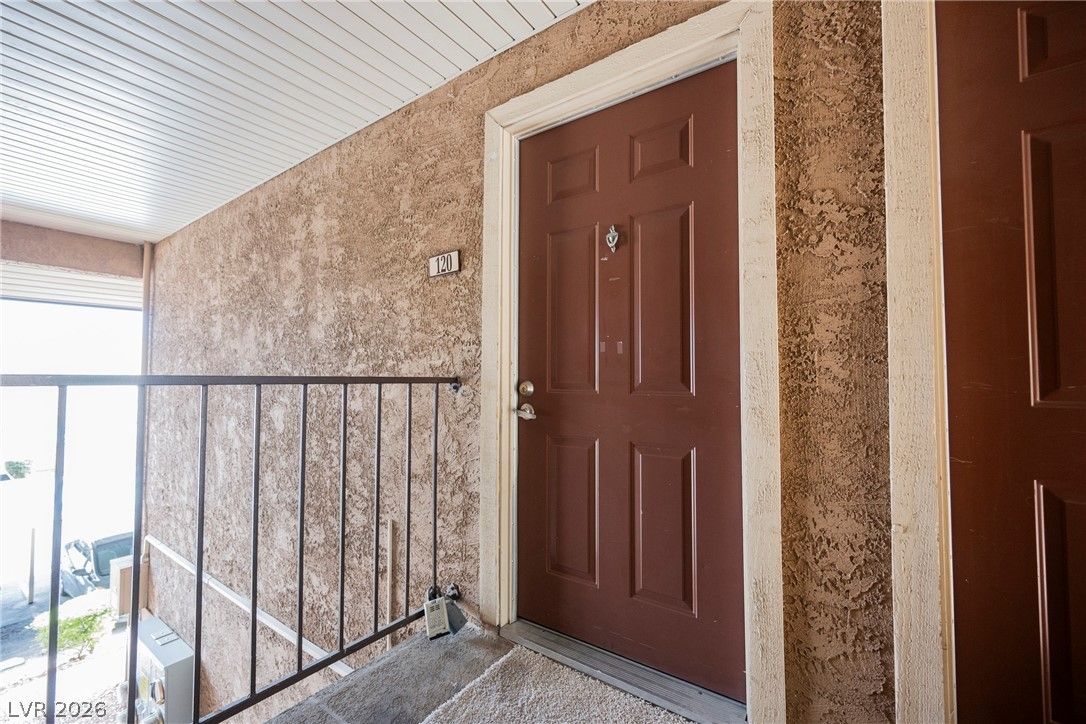
$149,9001 bd1 ba700 sqft$214/sqft0.46 mi68 days
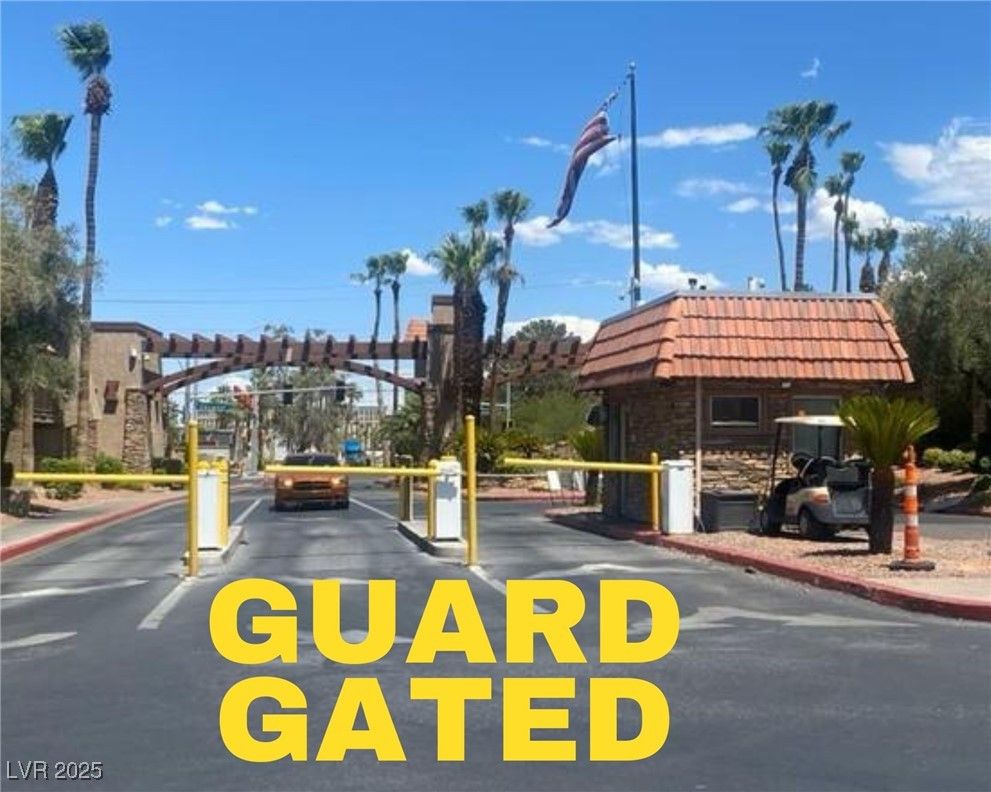
4981 River Glen Drive 63Active
$204,8881 bd1 ba700 sqft$293/sqft0.50 mi224 days
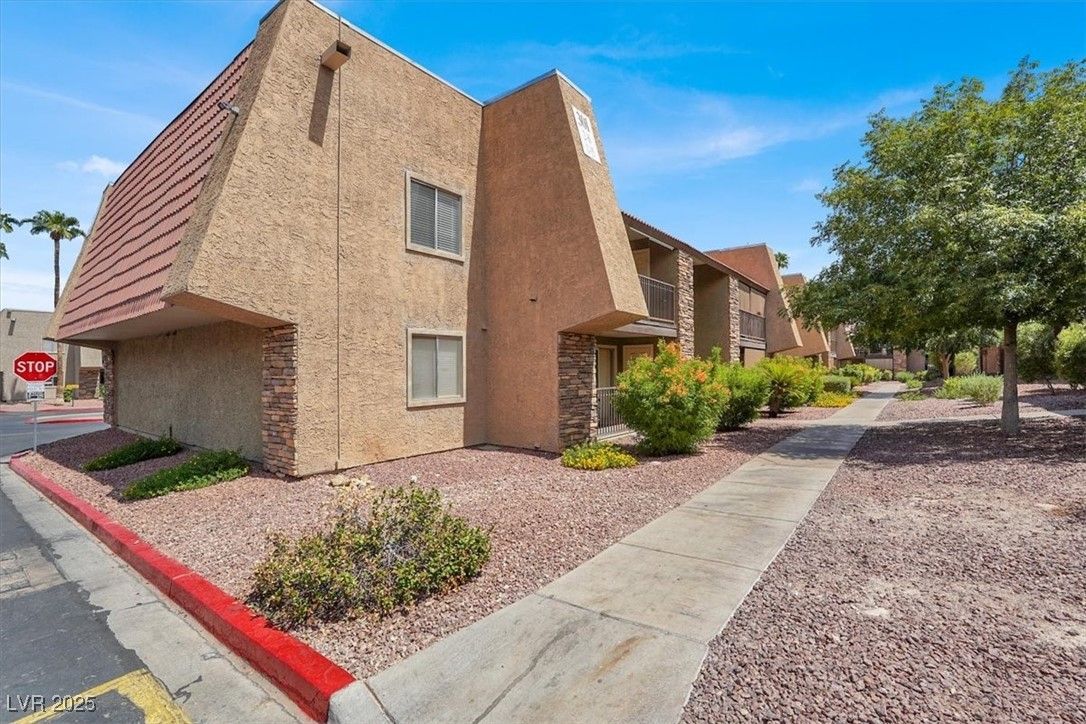
$132,5001 bd1 ba700 sqft$189/sqft0.50 mi317 daysSold 2026-08-20
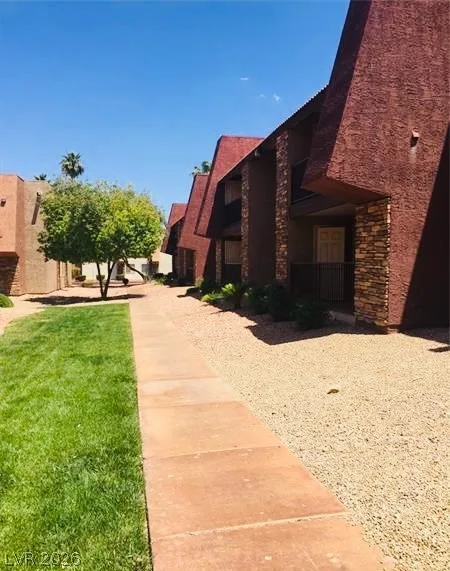
4941 River Glen Drive 7Active
$139,5001 bd1 ba700 sqft$199/sqft0.51 mi0 days
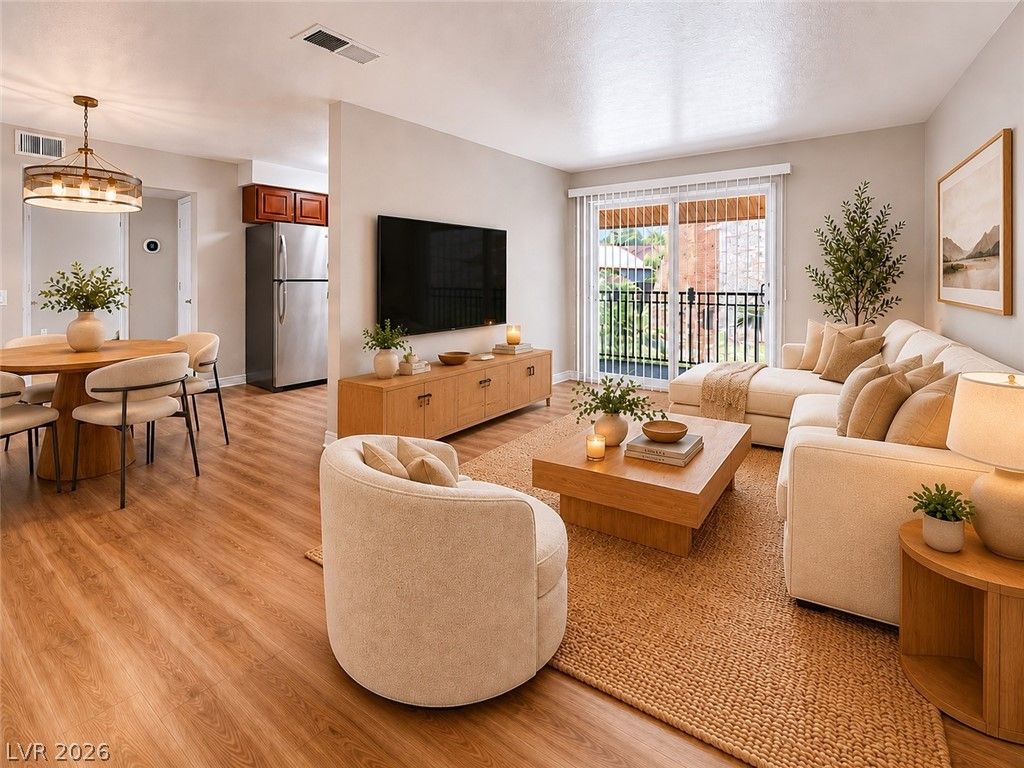
$157,5001 bd1 ba700 sqft$225/sqft0.51 mi46 daysSold 2026-08-18
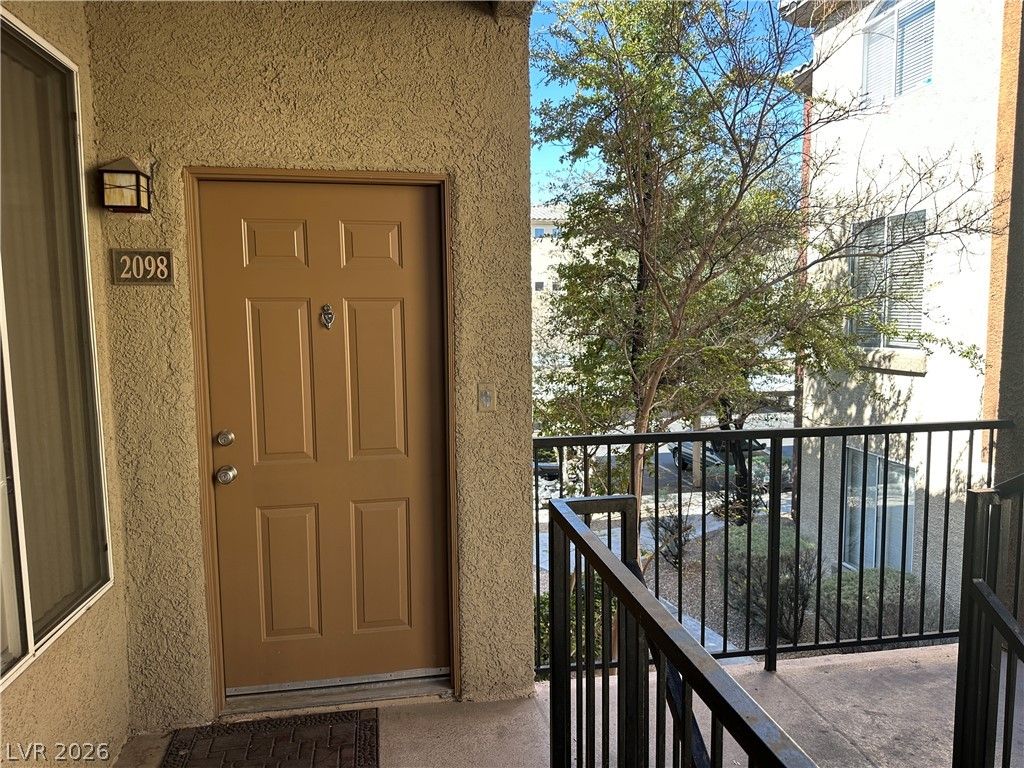
$179,0001 bd1 ba717 sqft$250/sqft0.55 mi177 days
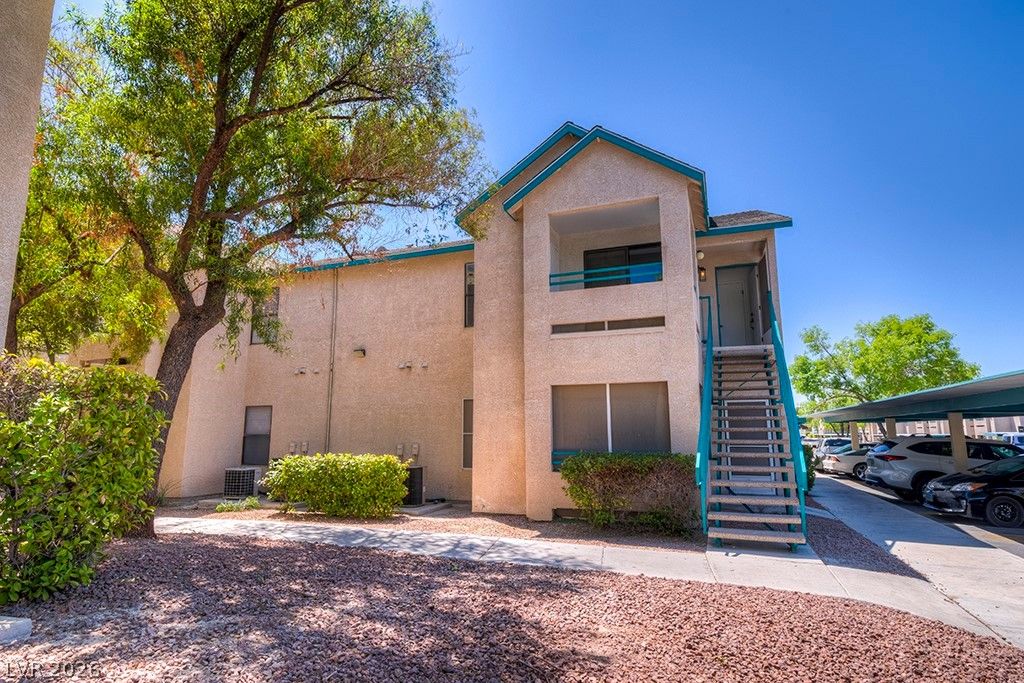
5121 Lindell Road 206Active
$200,0001 bd1 ba680 sqft$294/sqft0.62 mi0 days
Nearest comparable sales and listings
12 comparables · median price $153,700 · range $83,500 – $220,000 · median $/sq ft $220 · average $/sq ft $221
| Address | Status | Price | $/Sq Ft | Bd / Ba | Sq Ft | Sold / market time | Distance |
|---|---|---|---|---|---|---|---|
| 5295 Indian River Drive 312 | Sold | $90,000 | $129 | 1 / 1 | 700 | Sold 2026-05-19 | 0.29 mi |
| 5260 River Glen Drive 268 | Sold | $140,000 | $200 | 1 / 1 | 700 | Sold 2026-06-08 | 0.42 mi |
| 5155 West Tropicana Avenue 2164 | Active | $220,000 | $284 | 1 / 1 | 774 | 96 days on market | 0.46 mi |
| 4921 Indian River Drive 120 | Active | $149,900 | $214 | 1 / 1 | 700 | 68 days on market | 0.46 mi |
| 4981 River Glen Drive 63 | Active | $204,888 | $293 | 1 / 1 | 700 | 224 days on market | 0.50 mi |
| 4400 Sandy River Drive 2 | Sold | $132,500 | $189 | 1 / 1 | 700 | Sold 2026-08-20 | 0.50 mi |
| 4941 River Glen Drive 7 | Active | $139,500 | $199 | 1 / 1 | 700 | 0 days on market | 0.51 mi |
| 4941 River Glen Drive 10 | Sold | $157,500 | $225 | 1 / 1 | 700 | Sold 2026-08-18 | 0.51 mi |
| 4400 South Jones Boulevard 2098 | Active | $179,000 | $250 | 1 / 1 | 717 | 177 days on market | 0.55 mi |
| 5121 Lindell Road 206 | Active | $200,000 | $294 | 1 / 1 | 680 | 0 days on market | 0.62 mi |
| 5126 South Jones Boulevard 106 | Sold | $83,500 | $125 | 1 / 1 | 668 | Sold 2026-09-30 | 0.78 mi |
| 5055 West Hacienda Avenue 2212 | Sold | $170,000 | $248 | 1 / 1 | 685 | Sold 2026-09-25 | 0.87 mi |


