
Comparable Sales Near 763 North Arroyo Grande Boulevard, Henderson, NV 89014
1st Realty · Comparable sales report · 1st.estate · October 21, 2026
Read the Henderson area guide →
763 North Arroyo Grande Boulevard, Henderson, NV 89014
Status: Sold
$610,000 Sold Price
$313
$ / Sq Ft
1,951
Living Area
6,534 sqft
Lot Size
3
Beds
2
Baths
2015
Year Built
Search Parameters
Property Type
Status
Radius
Sold Within
Beds
Baths
Living Area (Sq Ft)
Lot Size (Sq Ft)
This comp search reflects your current search parameters — adjust the filters above as needed for a more accurate estimate.
Estimated Value
—
Average $/Sqft
—
Check one or more comps below to calculate an estimate.
Nearest 10 of 21 comparable sales and listings within 1 mile of this home. Use the filters above and press Search to refine.
$700,0004 bd3 ba2,433 sqft$288/sqft0.08 mi40 daysSold 2026-05-15
$570,0004 bd3 ba2,433 sqft$234/sqft0.09 mi126 daysSold 2026-07-06
$470,0003 bd2 ba1,942 sqft$242/sqft0.34 mi131 daysSold 2026-07-14
$420,0003 bd2 ba1,488 sqft$282/sqft0.48 mi7 daysSold 2026-06-17
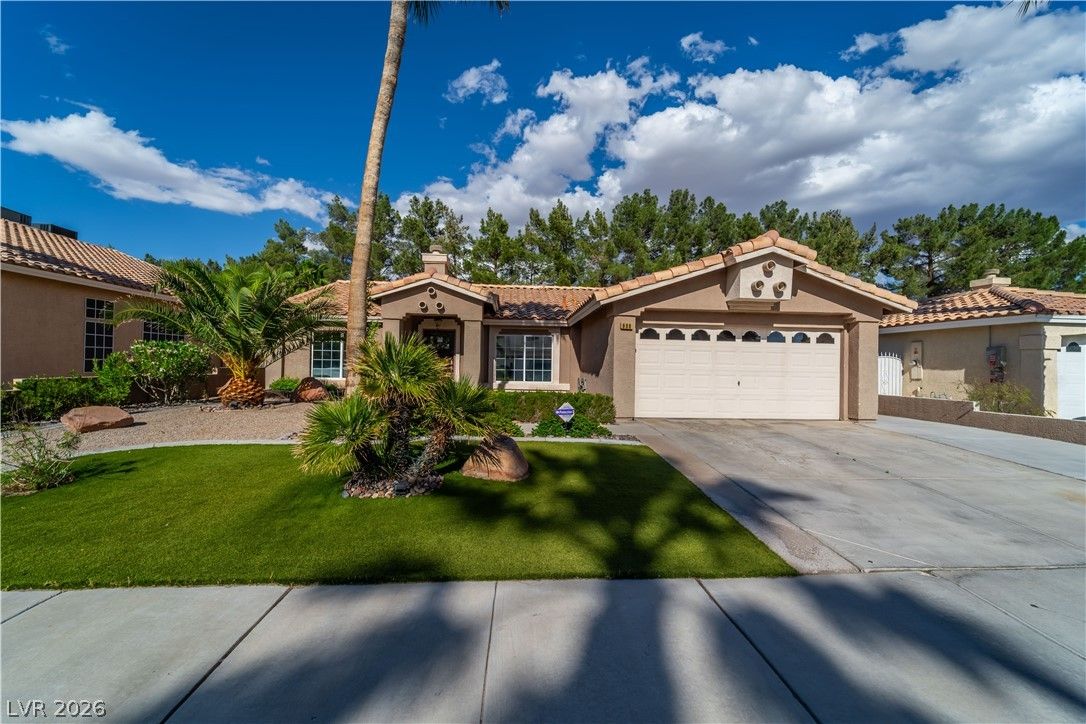
$455,0003 bd2 ba1,693 sqft$269/sqft0.52 mi106 daysSold 2026-08-27
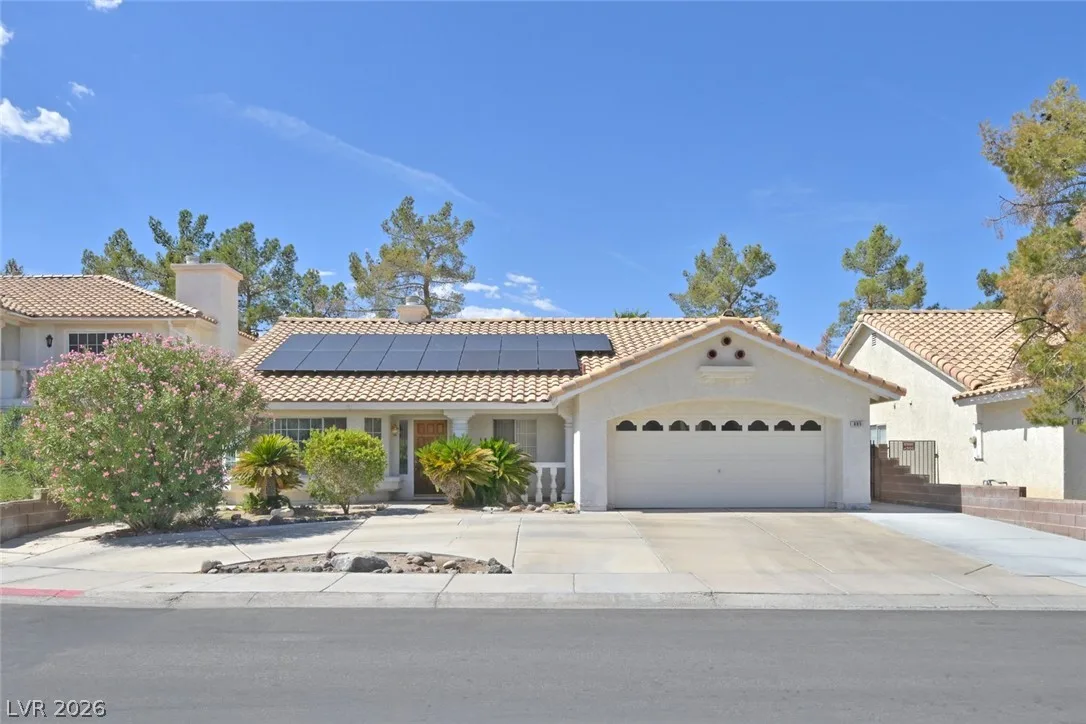
805 Stillwater LaneActive
$435,0003 bd2 ba1,942 sqft$224/sqft0.53 mi22 days
$430,0004 bd3 ba1,829 sqft$235/sqft0.53 mi8 daysSold 2026-04-28

551 British CourtPending
$435,0003 bd3 ba1,974 sqft$220/sqft0.54 mi85 days
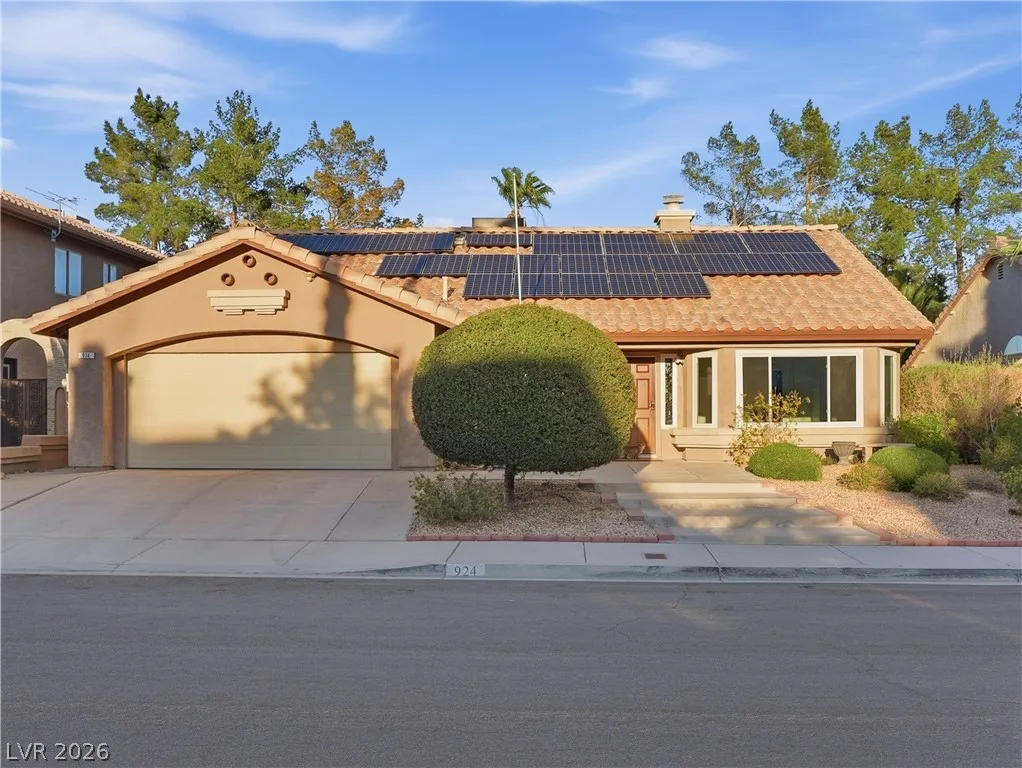
924 Sitting Bull DriveActive
$469,0003 bd2 ba1,942 sqft$242/sqft0.55 mi58 days

547 British CourtActive
$574,0004 bd3 ba2,196 sqft$261/sqft0.56 mi200 days
Nearest comparable sales and listings
12 comparables · median price $452,450 · range $390,000 – $700,000 · median $/sq ft $238 · average $/sq ft $243
| Address | Status | Price | $/Sq Ft | Bd / Ba | Sq Ft | Sold / market time | Distance |
|---|---|---|---|---|---|---|---|
| 1633 Blue Cliffs Avenue | Sold | $700,000 | $288 | 4 / 3 | 2,433 | Sold 2026-05-15 | 0.08 mi |
| 1634 Singing Sands Avenue | Sold | $570,000 | $234 | 4 / 3 | 2,433 | Sold 2026-07-06 | 0.09 mi |
| 1536 Pony Ranch Circle | Sold | $470,000 | $242 | 3 / 2 | 1,942 | Sold 2026-07-14 | 0.34 mi |
| 1619 Guilford Drive | Sold | $420,000 | $282 | 3 / 2 | 1,488 | Sold 2026-06-17 | 0.48 mi |
| 906 Sitting Bull Drive | Sold | $455,000 | $269 | 3 / 2 | 1,693 | Sold 2026-08-27 | 0.52 mi |
| 805 Stillwater Lane | Active | $435,000 | $224 | 3 / 2 | 1,942 | 22 days on market | 0.53 mi |
| 930 Plantation Acres Street | Sold | $430,000 | $235 | 4 / 3 | 1,829 | Sold 2026-04-28 | 0.53 mi |
| 551 British Court | Pending | $435,000 | $220 | 3 / 3 | 1,974 | 85 days on market | 0.54 mi |
| 924 Sitting Bull Drive | Active | $469,000 | $242 | 3 / 2 | 1,942 | 58 days on market | 0.55 mi |
| 547 British Court | Active | $574,000 | $261 | 4 / 3 | 2,196 | 200 days on market | 0.56 mi |
| 1402 Rim Fire Circle | Active | $449,900 | $232 | 4 / 3 | 1,943 | 16 days on market | 0.60 mi |
| 934 Derringer Lane | Sold | $390,000 | $183 | 4 / 3 | 2,133 | Sold 2026-06-05 | 0.62 mi |


