
Comparable Sales Near 2885 Red Springs Drive, Las Vegas, NV 89135
1st Realty · Comparable sales report · 1st.estate · October 20, 2026
Read the Summerlin neighborhood guide →
2885 Red Springs Drive, Las Vegas, NV 89135
Status: Sold
$1,450,000 Sold Price
$578
$ / Sq Ft
2,508
Living Area
6,970 sqft
Lot Size
3
Beds
4
Baths
2000
Year Built
Search Parameters
Property Type
Status
Radius
Sold Within
Beds
Baths
Living Area (Sq Ft)
Lot Size (Sq Ft)
This comp search reflects your current search parameters — adjust the filters above as needed for a more accurate estimate.
Estimated Value
—
Average $/Sqft
—
Check one or more comps below to calculate an estimate.
Nearest 10 of 21 comparable sales and listings within 1 mile of this home. Use the filters above and press Search to refine.
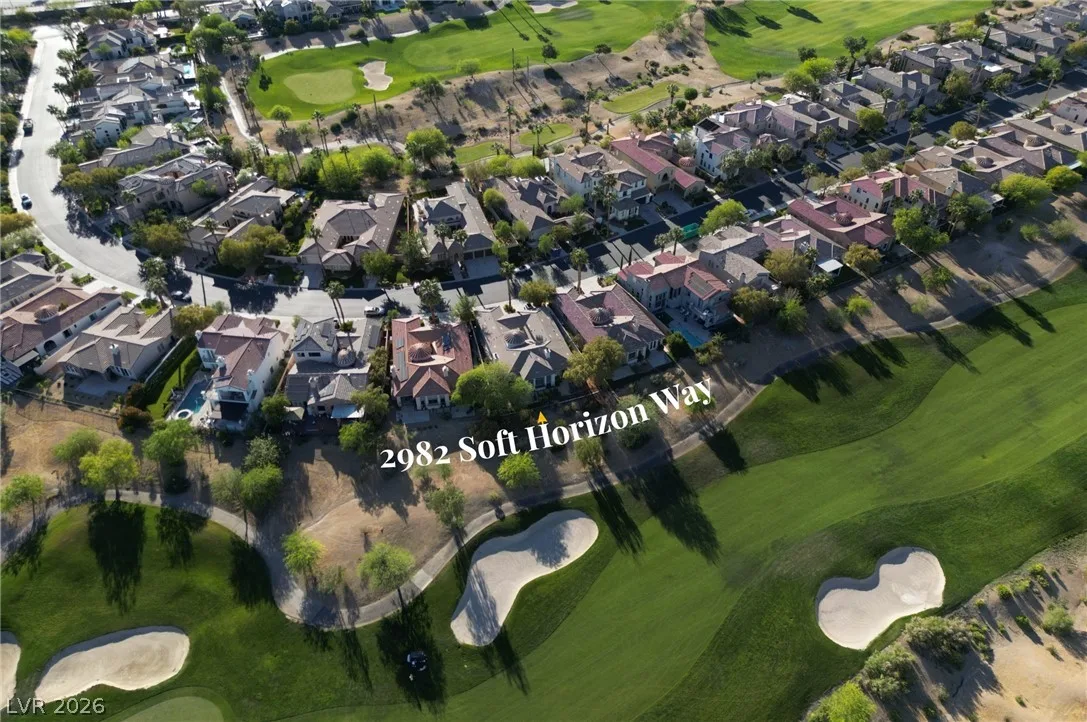
2982 Soft Horizon WayActive
$1,750,0003 bd4 ba2,508 sqft$698/sqft0.14 mi0 days
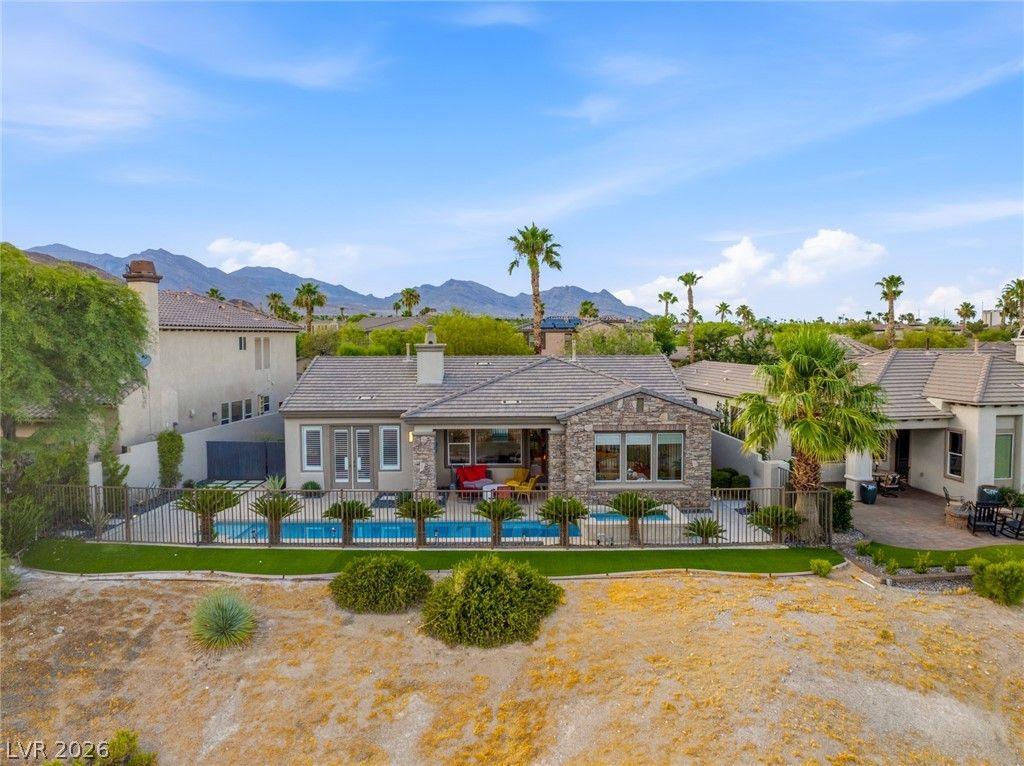
$1,300,0003 bd3 ba2,160 sqft$602/sqft0.22 mi18 daysSold 2026-09-11
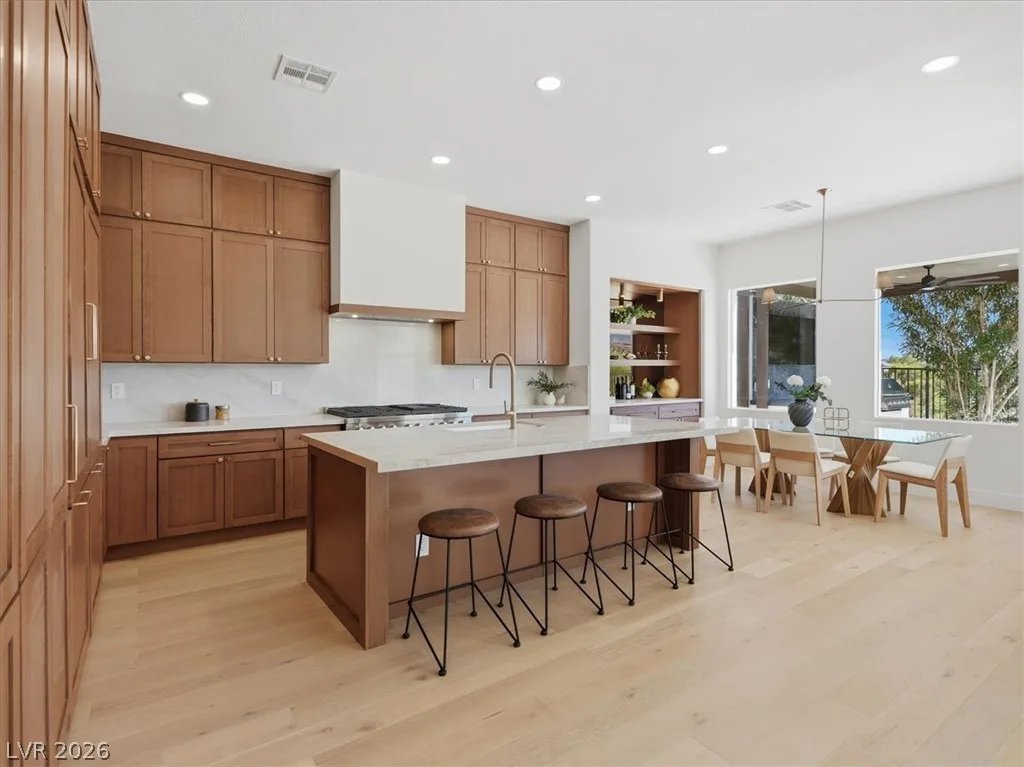
3074 Soft Horizon WayActive
$1,799,9983 bd3 ba2,160 sqft$833/sqft0.26 mi19 days
$1,160,0003 bd3 ba2,160 sqft$537/sqft0.26 mi129 daysSold 2026-05-01
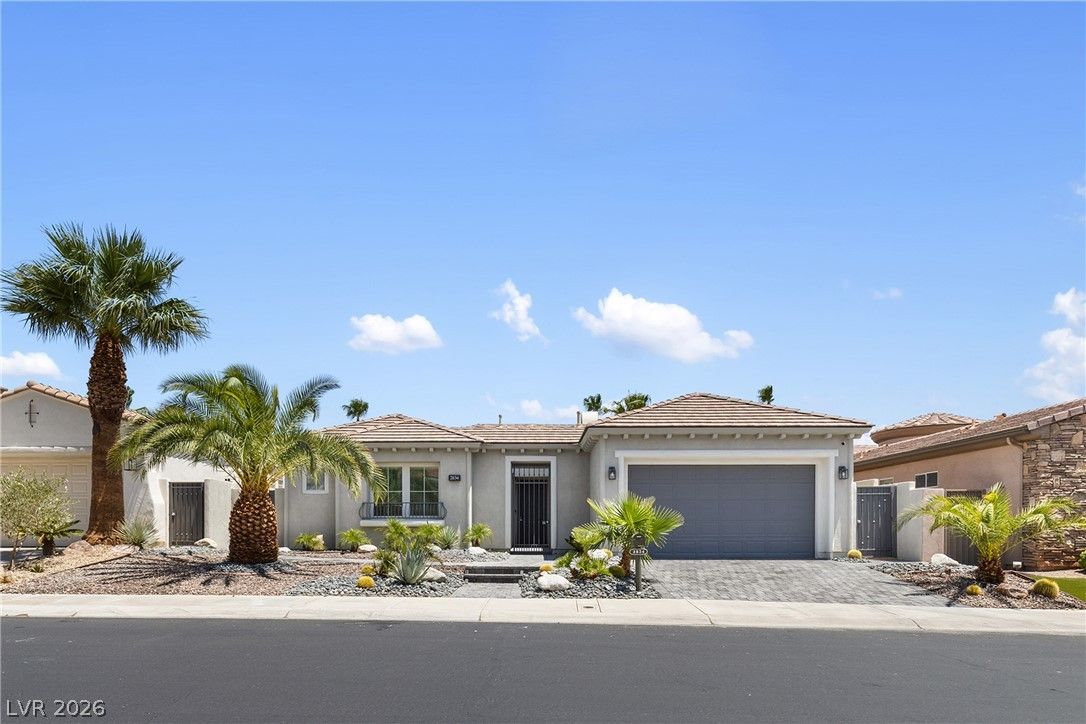
$1,125,0003 bd3 ba2,160 sqft$521/sqft0.42 mi15 daysSold 2026-10-01
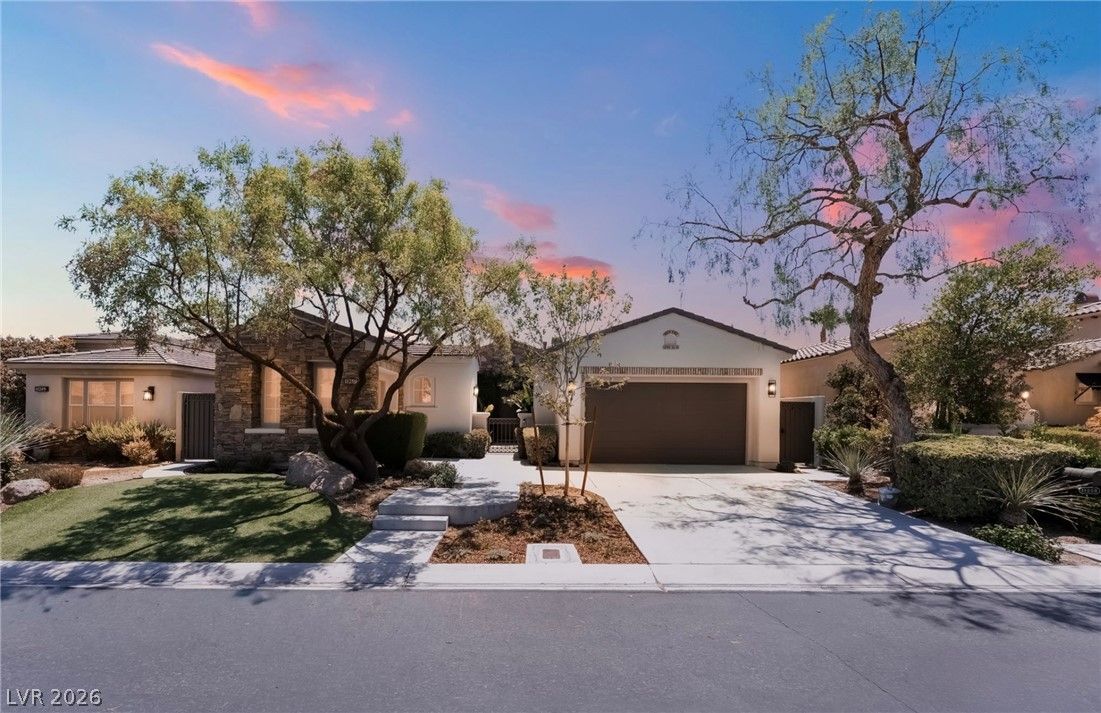
11259 Parleys Cone CourtActive
$2,195,0003 bd3 ba2,325 sqft$944/sqft0.44 mi40 days
$1,150,0003 bd4 ba2,508 sqft$459/sqft0.51 mi6 daysSold 2026-07-02
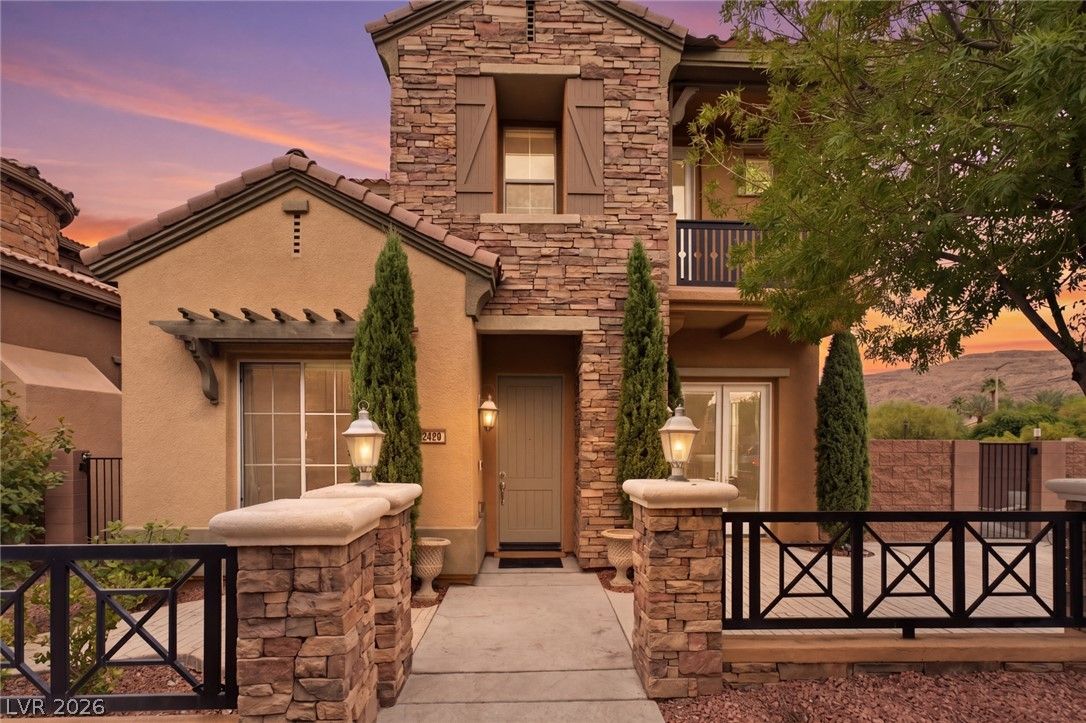
2450 Granada Bluff CourtActive
$799,0003 bd4 ba2,901 sqft$275/sqft0.58 mi64 days
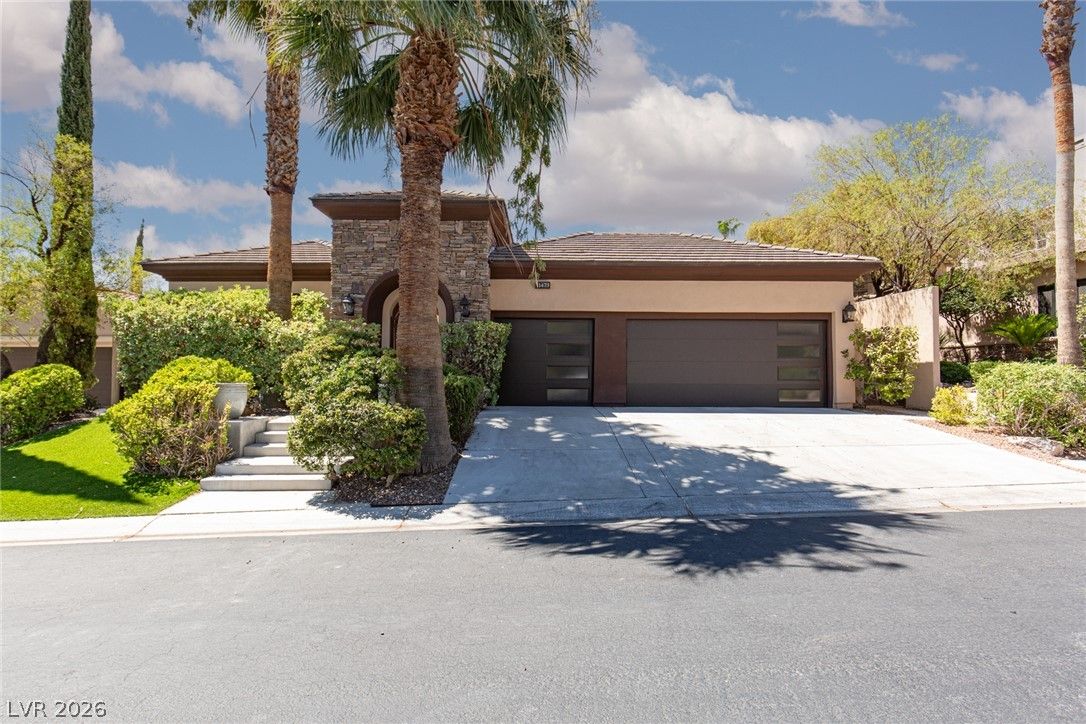
$1,860,0003 bd4 ba3,085 sqft$603/sqft0.61 mi21 daysSold 2026-09-03
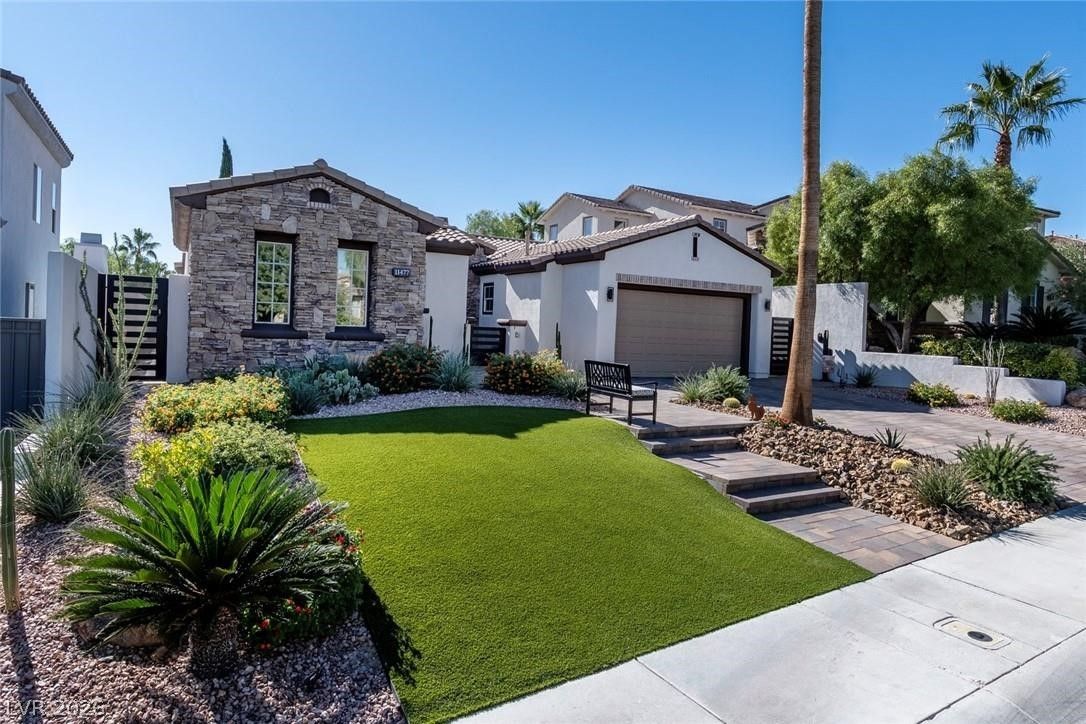
$1,675,0003 bd3 ba2,325 sqft$720/sqft0.66 mi0 days
Nearest comparable sales and listings
12 comparables · median price $1,237,500 · range $799,000 – $2,195,000 · median $/sq ft $569 · average $/sq ft $585
| Address | Status | Price | $/Sq Ft | Bd / Ba | Sq Ft | Sold / market time | Distance |
|---|---|---|---|---|---|---|---|
| 2982 Soft Horizon Way | Active | $1,750,000 | $698 | 3 / 4 | 2,508 | 0 days on market | 0.14 mi |
| 3042 Soft Horizon Way | Sold | $1,300,000 | $602 | 3 / 3 | 2,160 | Sold 2026-09-11 | 0.22 mi |
| 3074 Soft Horizon Way | Active | $1,799,998 | $833 | 3 / 3 | 2,160 | 19 days on market | 0.26 mi |
| 3074 Soft Horizon Way | Sold | $1,160,000 | $537 | 3 / 3 | 2,160 | Sold 2026-05-01 | 0.26 mi |
| 2834 Evening Rock Street | Sold | $1,125,000 | $521 | 3 / 3 | 2,160 | Sold 2026-10-01 | 0.42 mi |
| 11259 Parleys Cone Court | Active | $2,195,000 | $944 | 3 / 3 | 2,325 | 40 days on market | 0.44 mi |
| 2492 Hollow Rock Court | Sold | $1,150,000 | $459 | 3 / 4 | 2,508 | Sold 2026-07-02 | 0.51 mi |
| 2450 Granada Bluff Court | Active | $799,000 | $275 | 3 / 4 | 2,901 | 64 days on market | 0.58 mi |
| 11473 Snow Creek Avenue | Sold | $1,860,000 | $603 | 3 / 4 | 3,085 | Sold 2026-09-03 | 0.61 mi |
| 11477 Timber Mountain Avenue | Active | $1,675,000 | $720 | 3 / 3 | 2,325 | 0 days on market | 0.66 mi |
| 10833 Franklin Hills Avenue | Sold | $999,000 | $354 | 4 / 3 | 2,825 | Sold 2026-08-28 | 0.69 mi |
| 3434 Midnight Moon Street | Sold | $1,175,000 | $475 | 4 / 3 | 2,476 | Sold 2026-07-28 | 0.73 mi |


