
Comparable Sales Near 8708 Captains Place, Las Vegas, NV 89117
1st Realty · Comparable sales report · 1st.estate · October 20, 2026
Read the The Lakes neighborhood guide →
8708 Captains Place, Las Vegas, NV 89117
Status: Sold
$2,750 Sold Price
$1
$ / Sq Ft
3,080
Living Area
6,098 sqft
Lot Size
4
Beds
3
Baths
1985
Year Built
Search Parameters
Property Type
Status
Radius
Sold Within
Beds
Baths
Living Area (Sq Ft)
Lot Size (Sq Ft)
This comp search reflects your current search parameters — adjust the filters above as needed for a more accurate estimate.
Estimated Value
—
Average $/Sqft
—
Check one or more comps below to calculate an estimate.
Nearest 10 of 29 comparable sales and listings within 1 mile of this home. Use the filters above and press Search to refine.
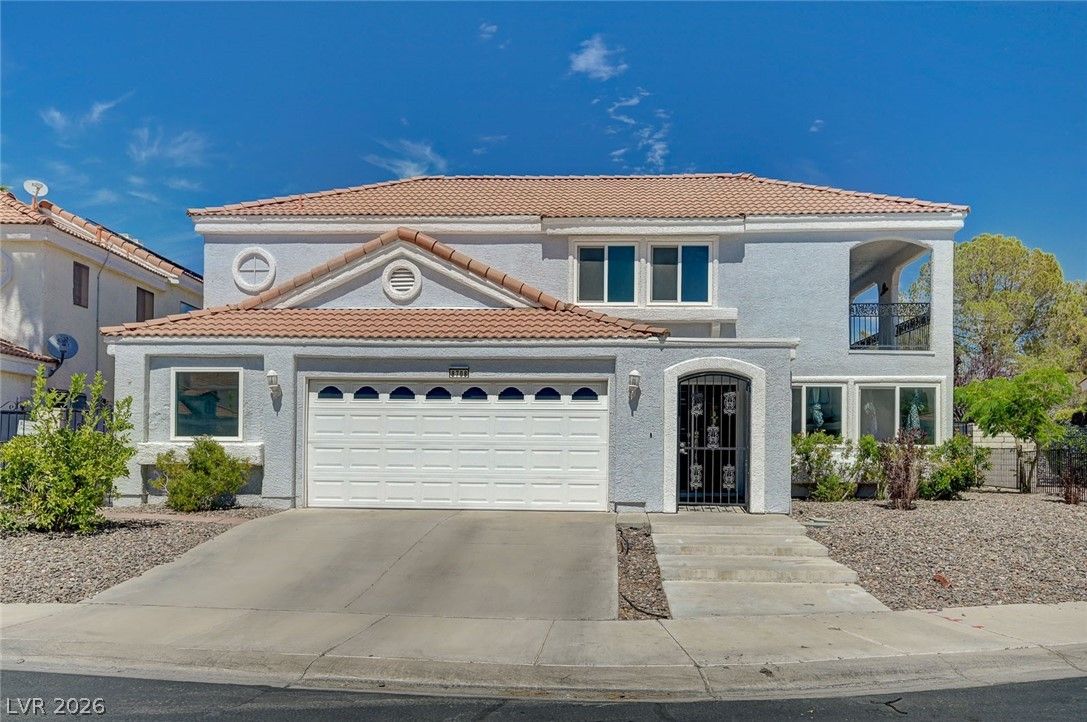
$675,0004 bd3 ba3,080 sqft$219/sqft0.00 mi73 daysSold 2026-08-17
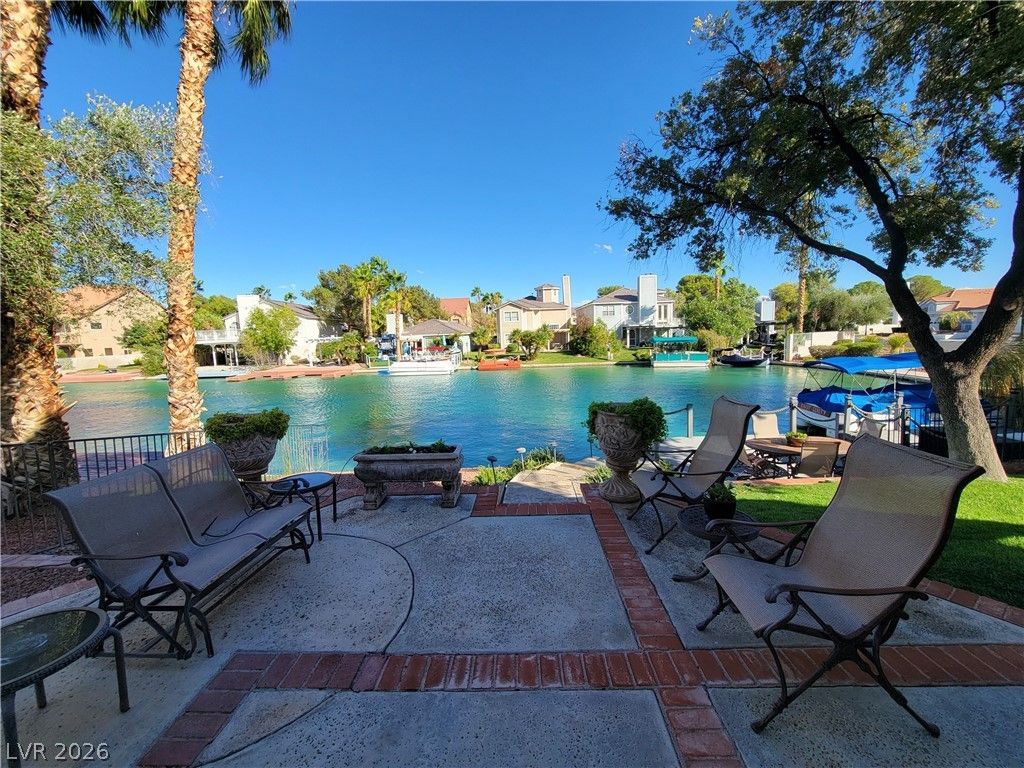
$1,100,0004 bd3 ba2,362 sqft$466/sqft0.11 mi21 daysSold 2026-07-29
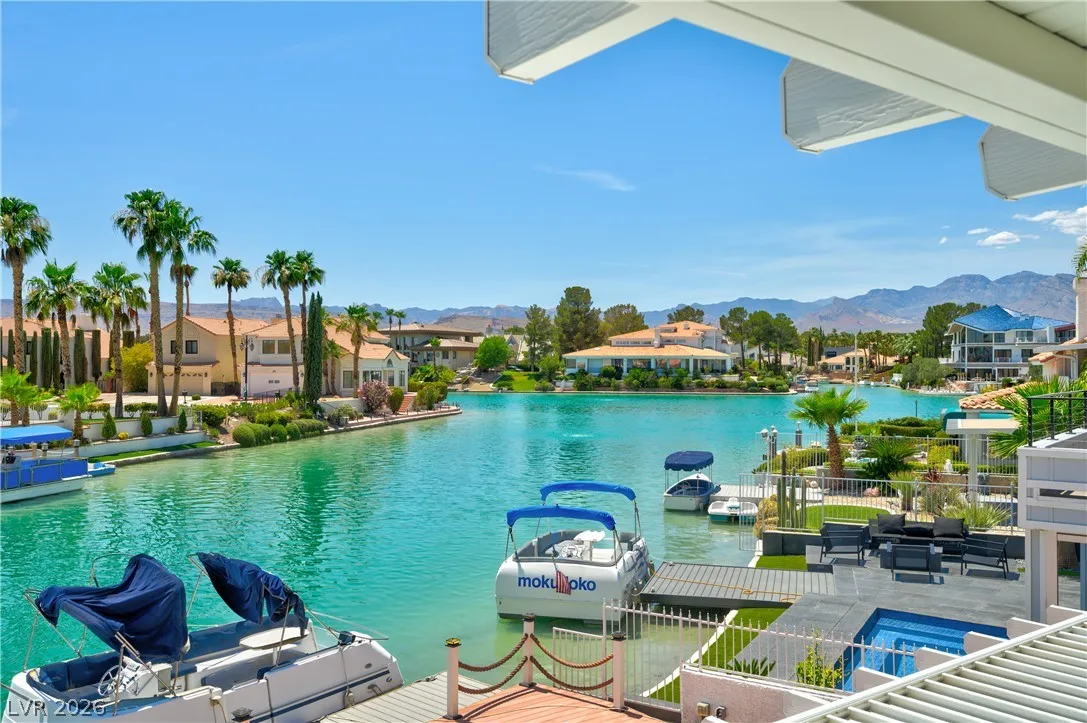
3033 Misty Harbour DriveActive
$1,180,0004 bd3 ba2,375 sqft$497/sqft0.16 mi0 days
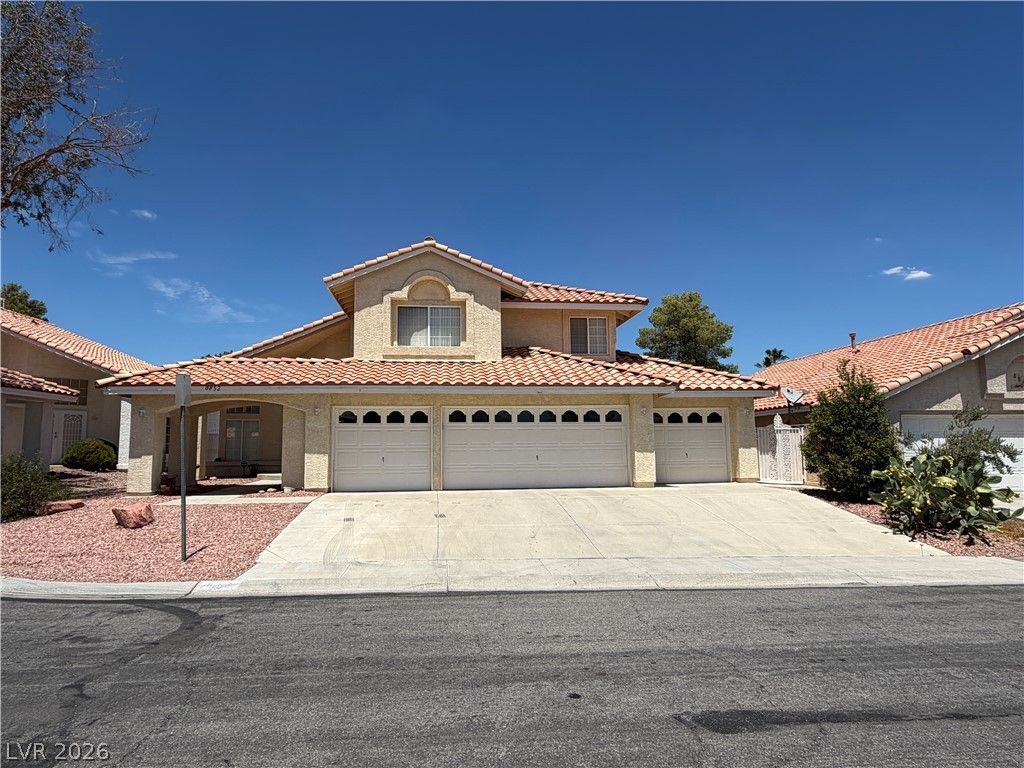
$490,0004 bd3 ba2,412 sqft$203/sqft0.41 mi45 daysSold 2026-09-21
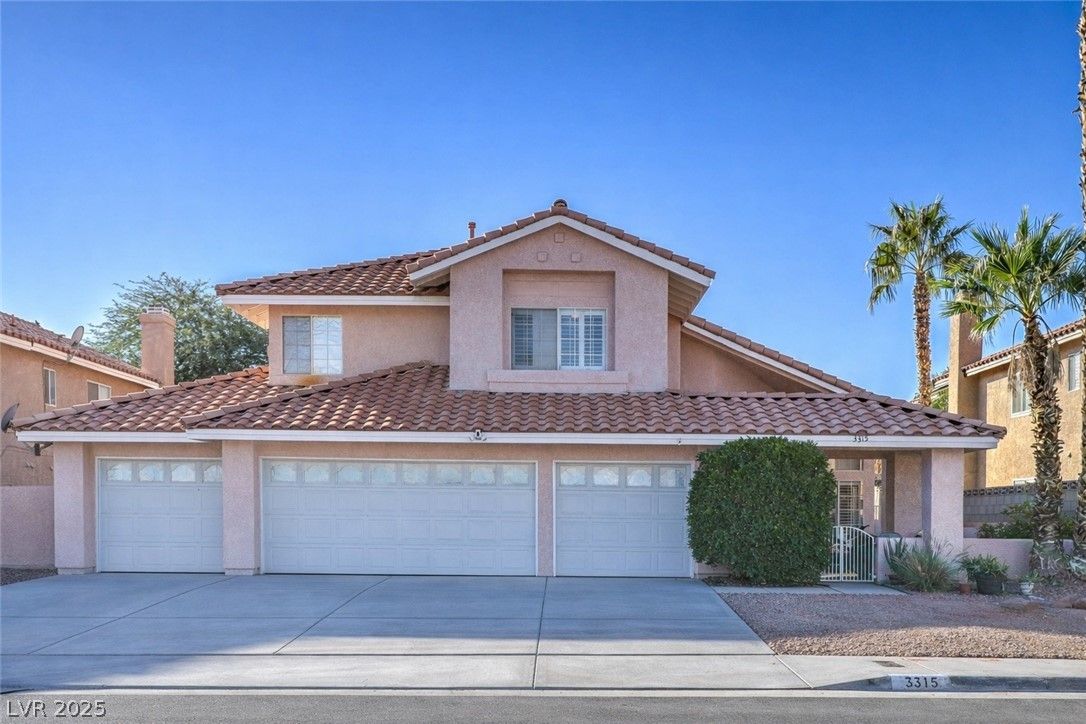
$490,0004 bd3 ba2,412 sqft$203/sqft0.42 mi185 daysSold 2026-07-24

3415 Evening Sun DrivePending
$589,9004 bd3 ba2,412 sqft$245/sqft0.54 mi19 days
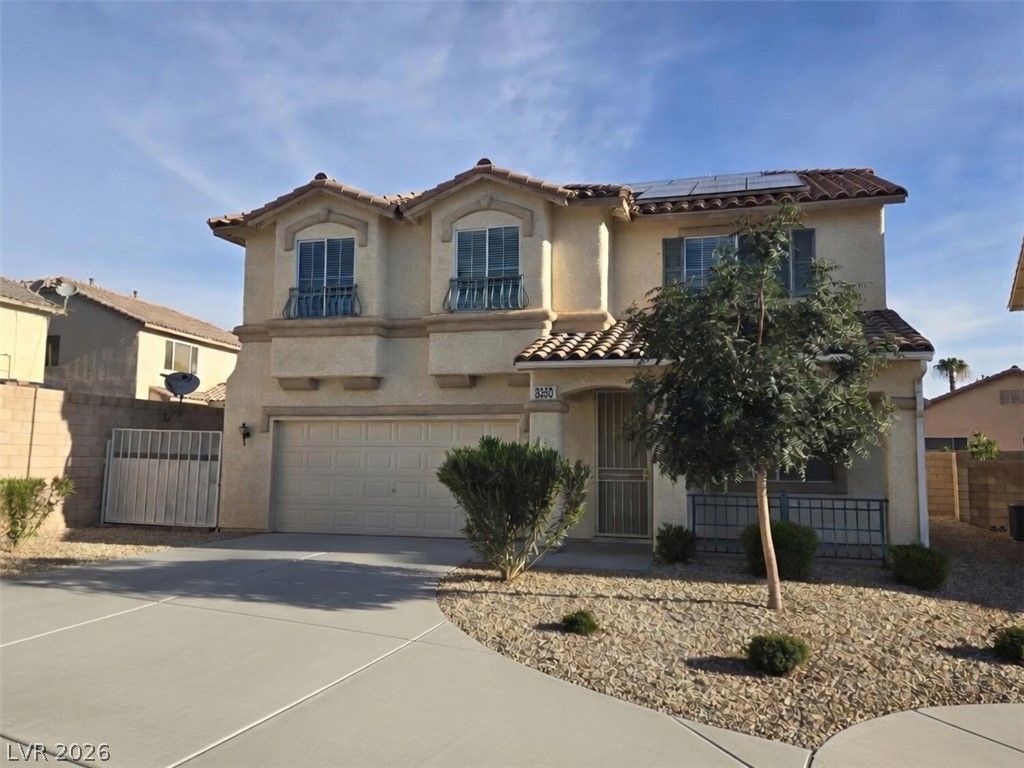
$499,0004 bd3 ba2,561 sqft$195/sqft0.61 mi75 days
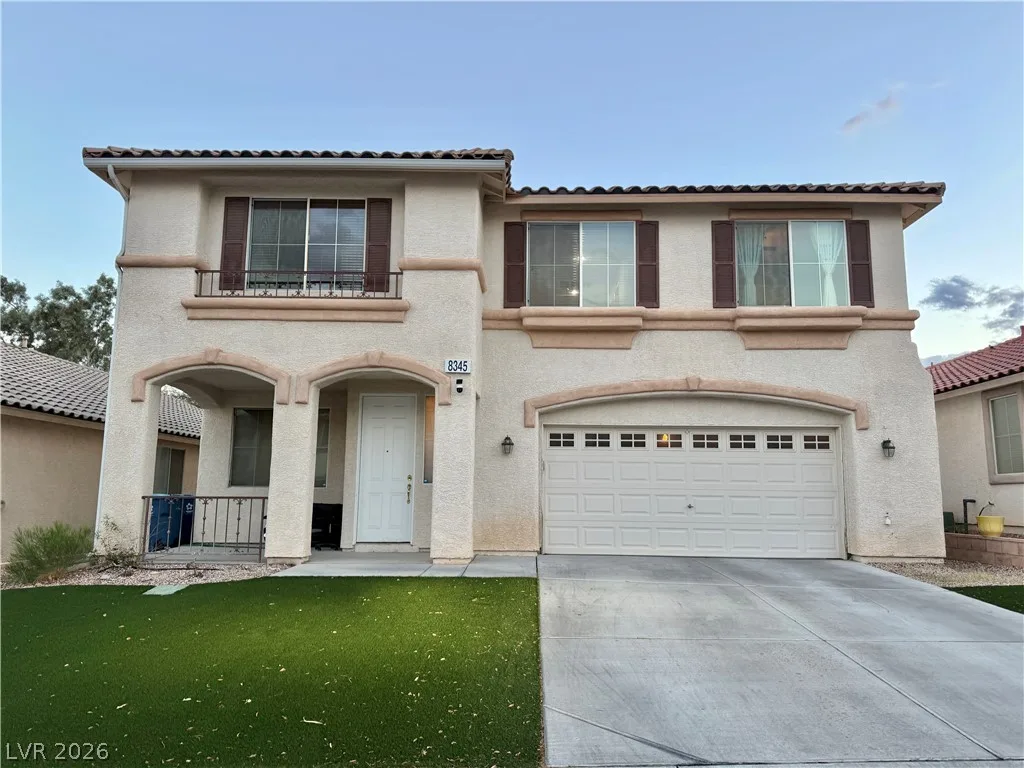
$509,9003 bd3 ba2,697 sqft$189/sqft0.62 mi0 days

9024 Feather River CourtActive
$599,0004 bd3 ba2,358 sqft$254/sqft0.62 mi46 days
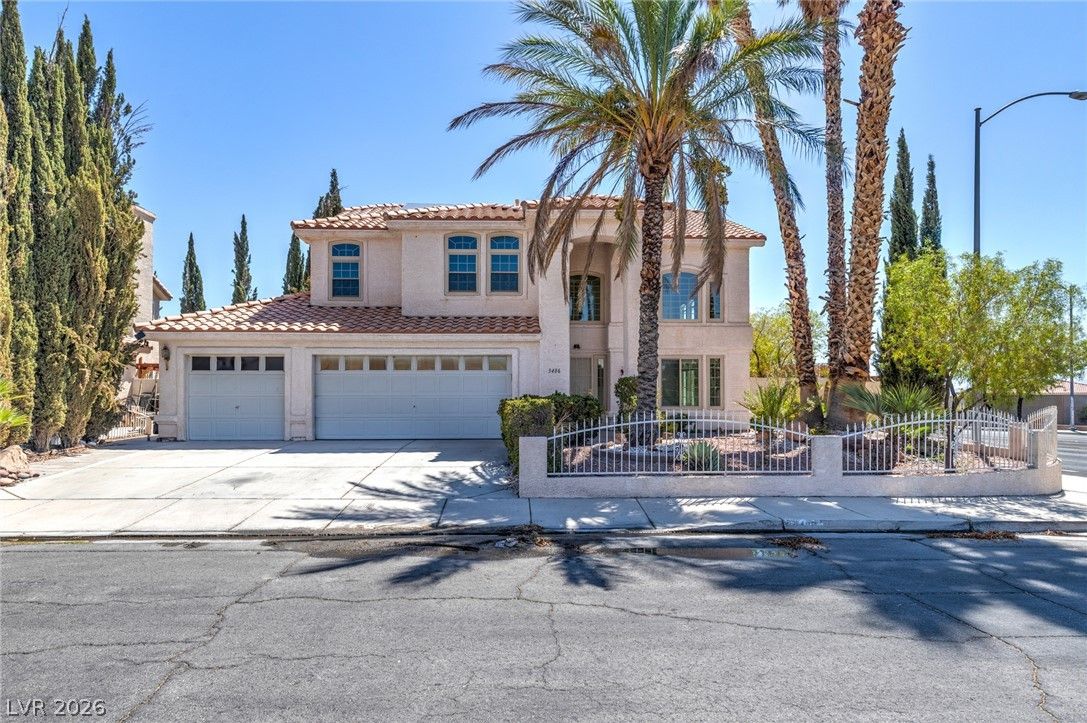
3486 Artemis StreetActive
$614,9004 bd3 ba2,350 sqft$262/sqft0.63 mi68 days
Nearest comparable sales and listings
12 comparables · median price $594,450 · range $490,000 – $1,180,000 · median $/sq ft $232 · average $/sq ft $267
| Address | Status | Price | $/Sq Ft | Bd / Ba | Sq Ft | Sold / market time | Distance |
|---|---|---|---|---|---|---|---|
| 8708 Captains Place | Sold | $675,000 | $219 | 4 / 3 | 3,080 | Sold 2026-08-17 | 0.00 mi |
| 3020 Waterside Circle | Sold | $1,100,000 | $466 | 4 / 3 | 2,362 | Sold 2026-07-29 | 0.11 mi |
| 3033 Misty Harbour Drive | Active | $1,180,000 | $497 | 4 / 3 | 2,375 | 0 days on market | 0.16 mi |
| 8852 Polo Bay Circle | Sold | $490,000 | $203 | 4 / 3 | 2,412 | Sold 2026-09-21 | 0.41 mi |
| 3315 Royal Bay Drive | Sold | $490,000 | $203 | 4 / 3 | 2,412 | Sold 2026-07-24 | 0.42 mi |
| 3415 Evening Sun Drive | Pending | $589,900 | $245 | 4 / 3 | 2,412 | 19 days on market | 0.54 mi |
| 8350 Sterling Harbor Court | Active | $499,000 | $195 | 4 / 3 | 2,561 | 75 days on market | 0.61 mi |
| 8345 Palace Heights Avenue | Active | $509,900 | $189 | 3 / 3 | 2,697 | 0 days on market | 0.62 mi |
| 9024 Feather River Court | Active | $599,000 | $254 | 4 / 3 | 2,358 | 46 days on market | 0.62 mi |
| 3486 Artemis Street | Active | $614,900 | $262 | 4 / 3 | 2,350 | 68 days on market | 0.63 mi |
| 2928 Indigo Haven Court | Sold | $655,000 | $263 | 4 / 3 | 2,486 | Sold 2026-05-29 | 0.63 mi |
| 8782 Fountain Island Drive | Sold | $545,000 | $212 | 5 / 3 | 2,568 | Sold 2026-05-18 | 0.66 mi |


