
Comparable Sales Near 2561 Red Rock Drive, Pahrump, NV 89048
1st Realty · Comparable sales report · 1st.estate · October 20, 2026
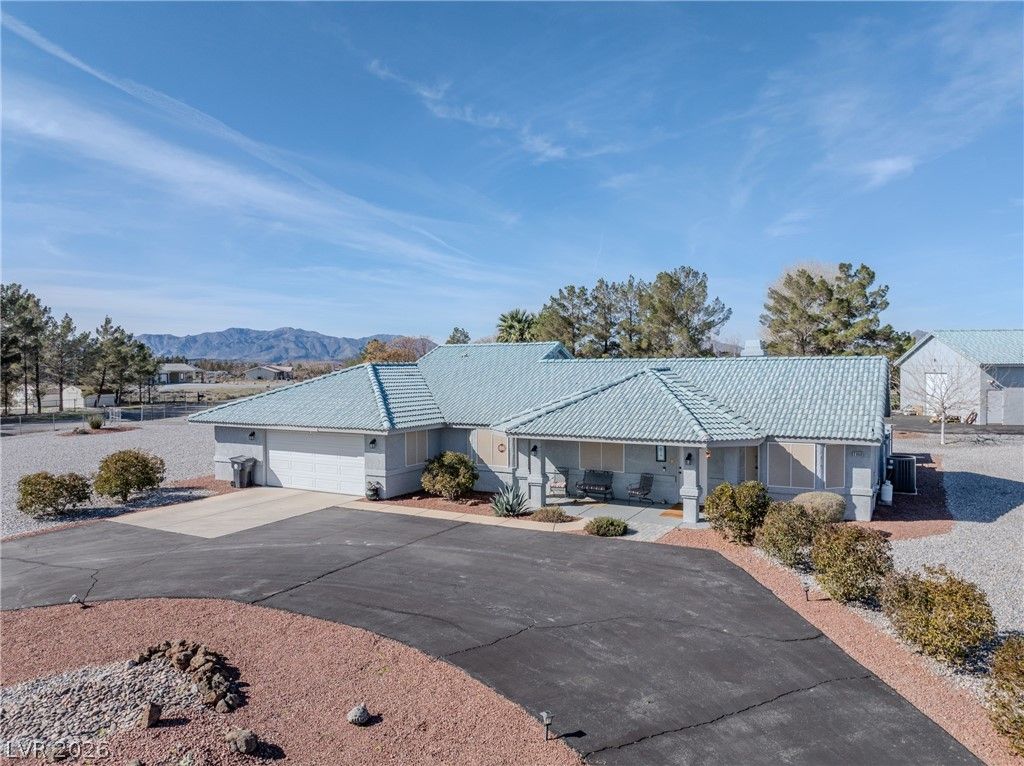
2561 Red Rock Drive, Pahrump, NV 89048
Status: Sold
$526,900 Sold Price
$215
$ / Sq Ft
2,448
Living Area
49,658 sqft
Lot Size
4
Beds
2
Baths
2025
Year Built
Search Parameters
Property Type
Status
Radius
Sold Within
Beds
Baths
Living Area (Sq Ft)
Lot Size (Sq Ft)
This comp search reflects your current search parameters — adjust the filters above as needed for a more accurate estimate.
Estimated Value
—
Average $/Sqft
—
Check one or more comps below to calculate an estimate.
Nearest 10 of 22 comparable sales and listings within 1 mile of this home. Use the filters above and press Search to refine.
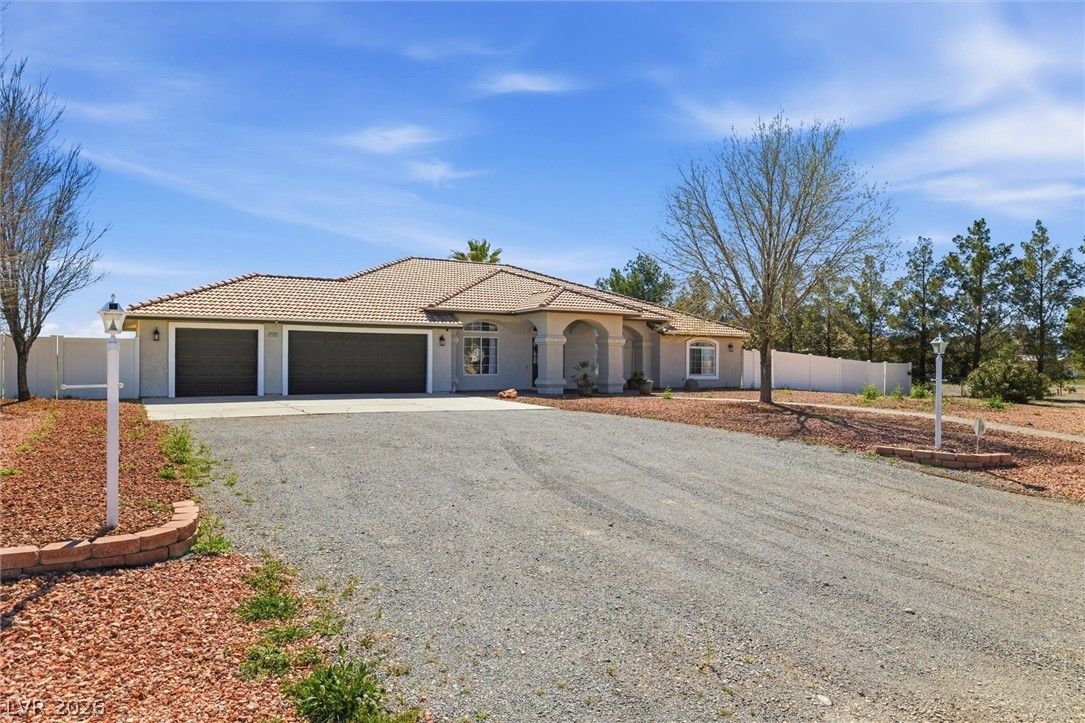
1131 China StreetActive
$610,0004 bd3 ba2,776 sqft$220/sqft0.20 mi166 days

1021 China StreetActive
$234,9003 bd2 ba2,221 sqft$106/sqft0.27 mi41 days
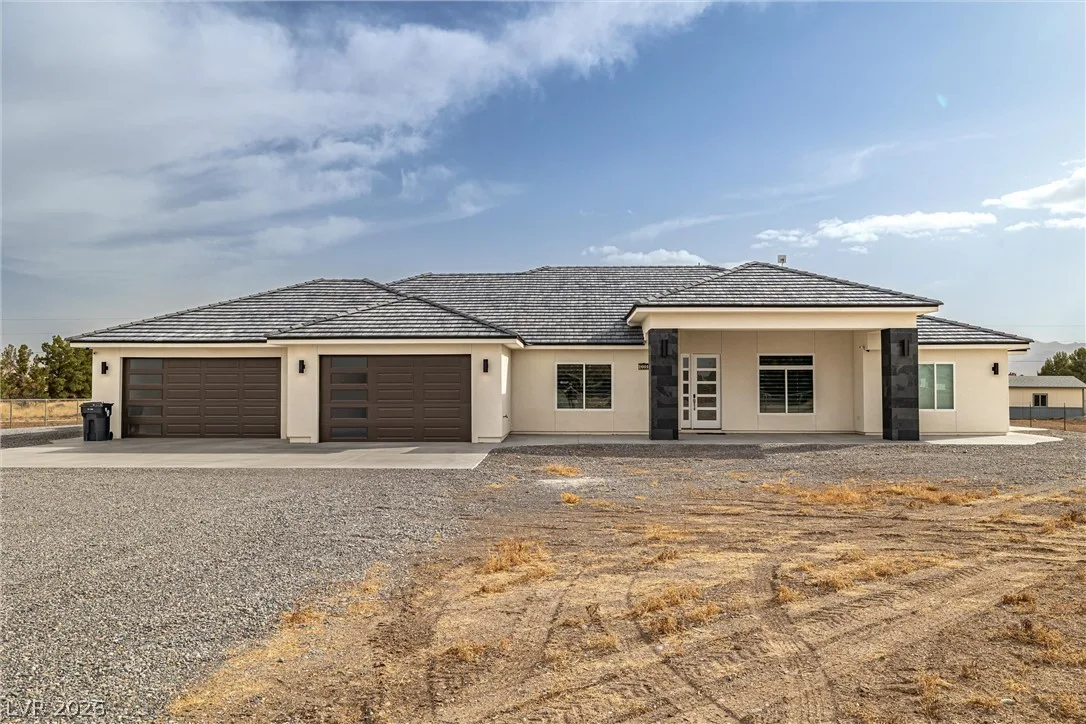
$680,0003 bd3 ba2,904 sqft$234/sqft0.35 mi1 days
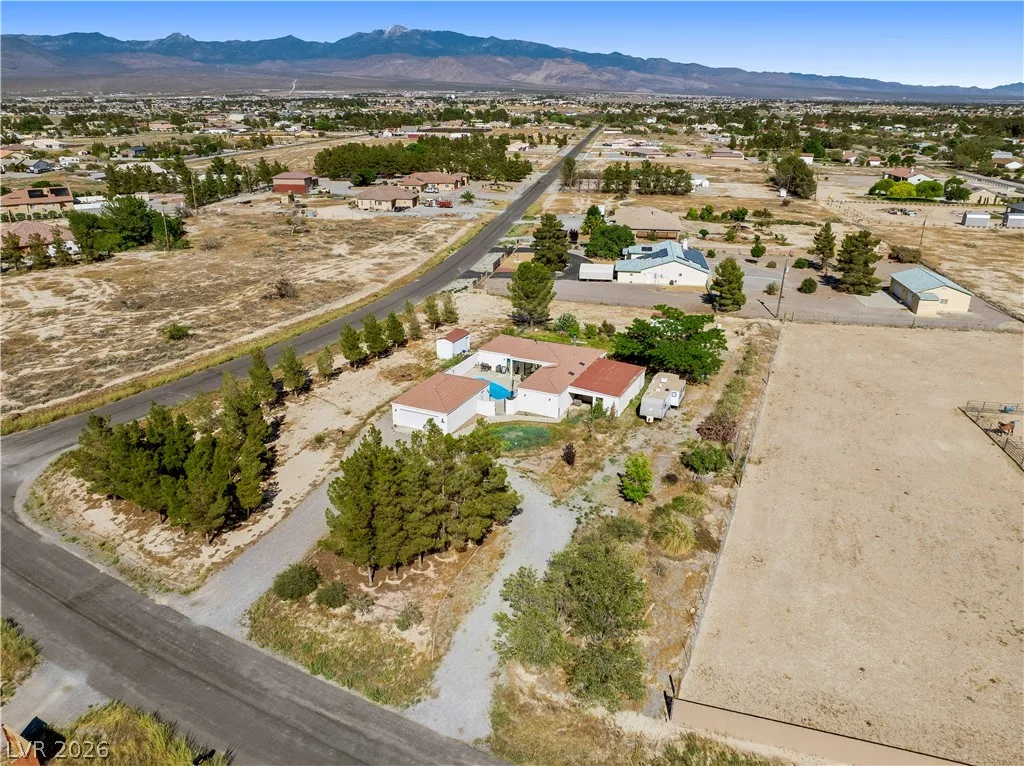
2171 River Plate DriveActive
$519,9005 bd2 ba2,229 sqft$233/sqft0.41 mi0 days
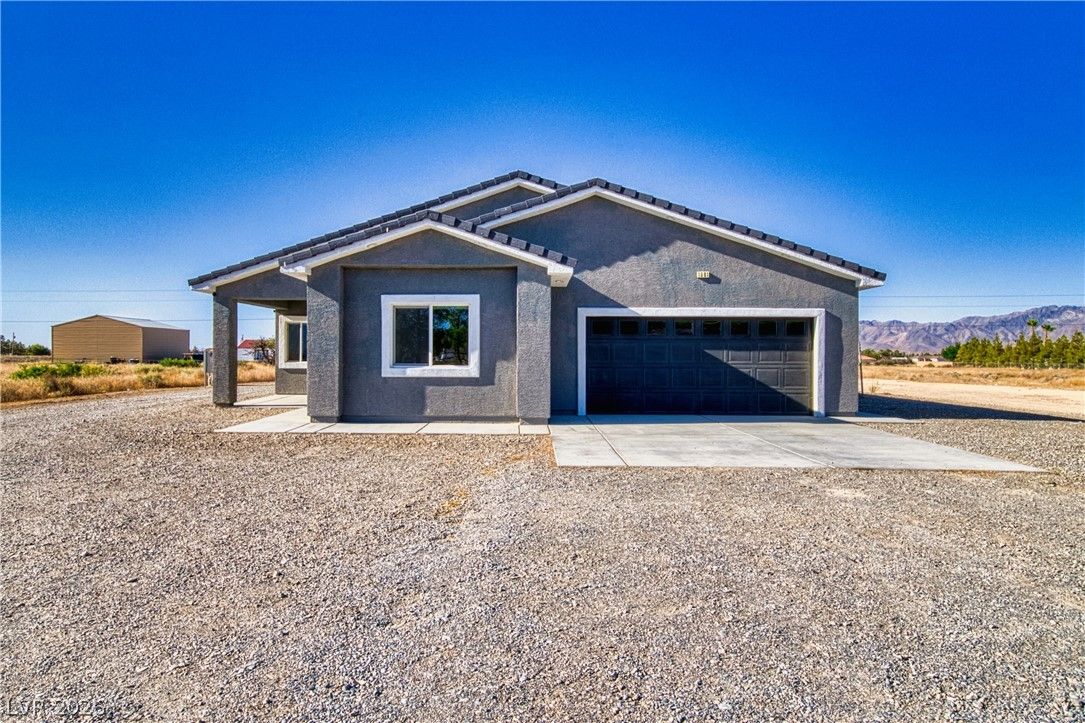
1501 Huracan StreetActive
$452,5003 bd3 ba2,053 sqft$220/sqft0.46 mi53 days
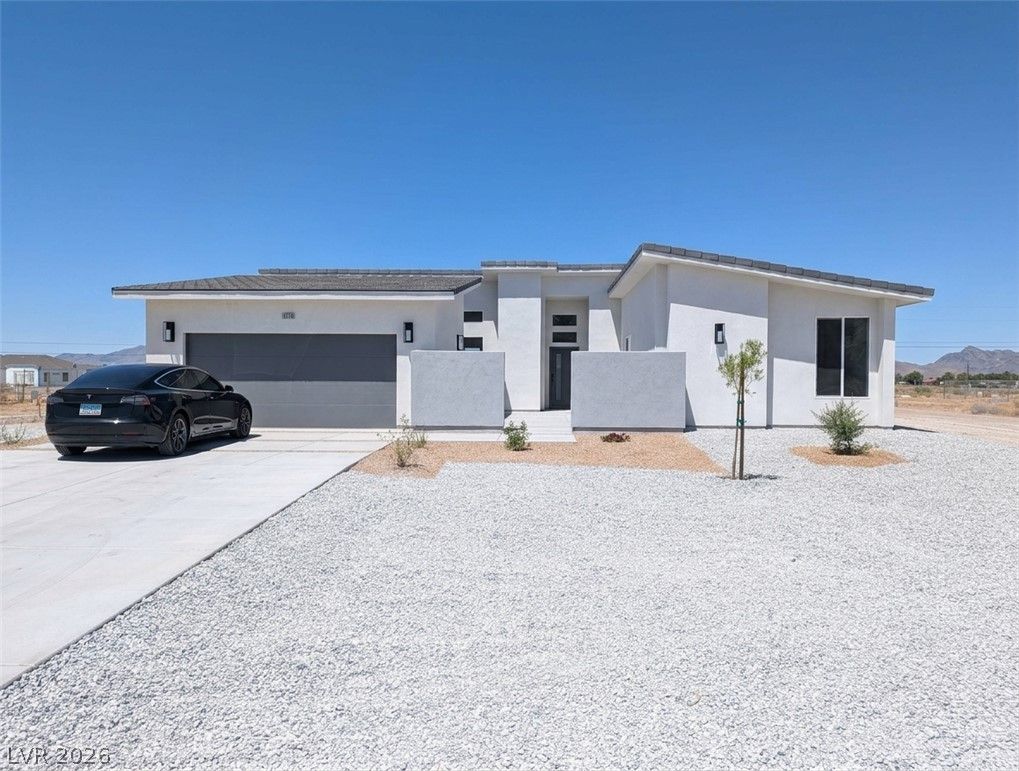
2651 QuintaActive
$469,9993 bd3 ba1,927 sqft$244/sqft0.48 mi56 days
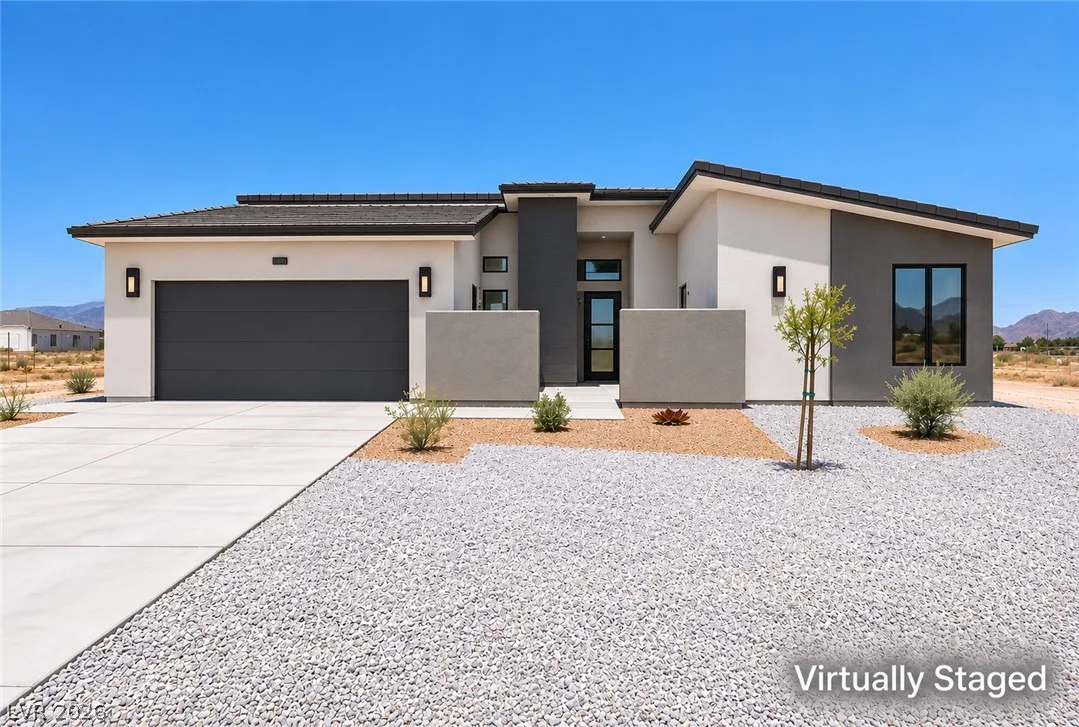
1330 Silver PeakActive
$469,9903 bd3 ba1,927 sqft$244/sqft0.48 mi0 days
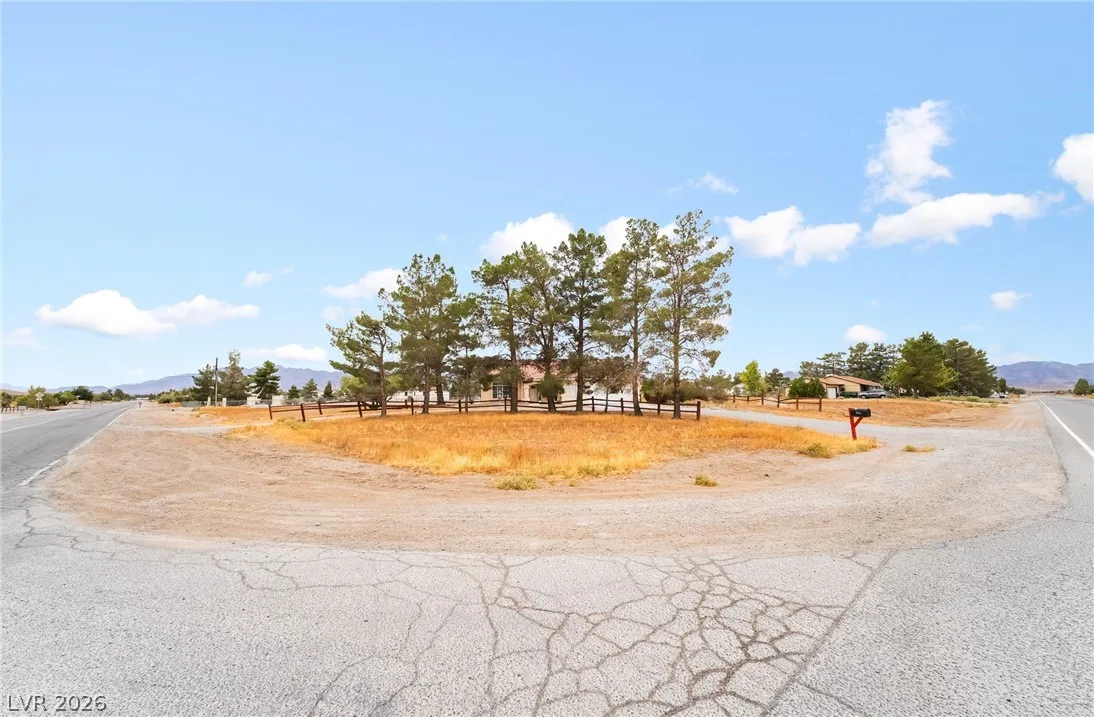
$399,9993 bd2 ba2,247 sqft$178/sqft0.49 mi1 days
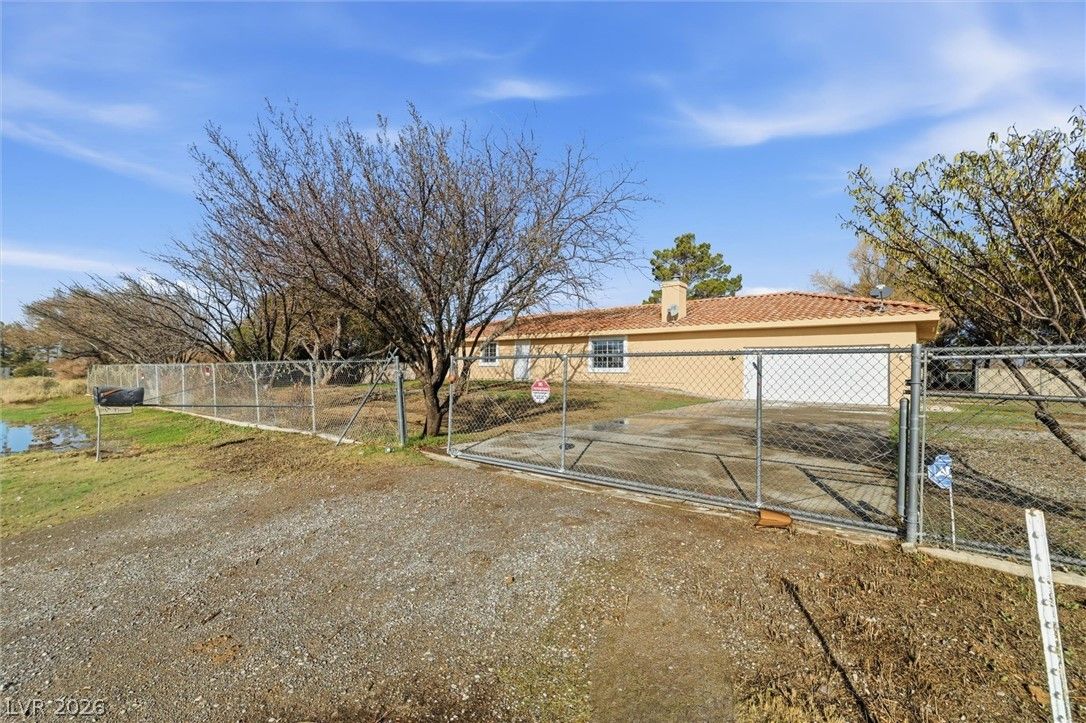
700 West Amarillo AvenuePending
$329,9993 bd2 ba1,890 sqft$175/sqft0.55 mi10 days
2060 Red Rock DriveActive
$699,0003 bd2 ba1,872 sqft$373/sqft0.57 mi19 days
Nearest comparable sales and listings
12 comparables · median price $461,245 · range $234,900 – $699,000 · median $/sq ft $220 · average $/sq ft $221
| Address | Status | Price | $/Sq Ft | Bd / Ba | Sq Ft | Sold / market time | Distance |
|---|---|---|---|---|---|---|---|
| 1131 China Street | Active | $610,000 | $220 | 4 / 3 | 2,776 | 166 days on market | 0.20 mi |
| 1021 China Street | Active | $234,900 | $106 | 3 / 2 | 2,221 | 41 days on market | 0.27 mi |
| 1601 West Calvada Boulevard | Active | $680,000 | $234 | 3 / 3 | 2,904 | 1 days on market | 0.35 mi |
| 2171 River Plate Drive | Active | $519,900 | $233 | 5 / 2 | 2,229 | 0 days on market | 0.41 mi |
| 1501 Huracan Street | Active | $452,500 | $220 | 3 / 3 | 2,053 | 53 days on market | 0.46 mi |
| 2651 Quinta | Active | $469,999 | $244 | 3 / 3 | 1,927 | 56 days on market | 0.48 mi |
| 1330 Silver Peak | Active | $469,990 | $244 | 3 / 3 | 1,927 | 0 days on market | 0.48 mi |
| 1741 West Calvada Boulevard | Active | $399,999 | $178 | 3 / 2 | 2,247 | 1 days on market | 0.49 mi |
| 700 West Amarillo Avenue | Pending | $329,999 | $175 | 3 / 2 | 1,890 | 10 days on market | 0.55 mi |
| 2060 Red Rock Drive | Active | $699,000 | $373 | 3 / 2 | 1,872 | 19 days on market | 0.57 mi |
| 1640 Moose Street | Sold | $399,900 | $209 | 3 / 3 | 1,910 | Sold 2026-06-08 | 0.57 mi |
| 2950 Winchester Avenue | Sold | $419,000 | $213 | 3 / 2 | 1,971 | Sold 2026-05-15 | 0.63 mi |


