
Comparable Sales Near 2232 Sky Island Drive, Henderson, NV 89002
1st Realty · Comparable sales report · 1st.estate · October 21, 2026
Read the Henderson area guide →
2232 Sky Island Drive, Henderson, NV 89002
Status: Sold
$1,999 Sold Price
$1
$ / Sq Ft
1,937
Living Area
3,920 sqft
Lot Size
4
Beds
3
Baths
2017
Year Built
Search Parameters
Property Type
Status
Radius
Sold Within
Beds
Baths
Living Area (Sq Ft)
Lot Size (Sq Ft)
This comp search reflects your current search parameters — adjust the filters above as needed for a more accurate estimate.
Estimated Value
—
Average $/Sqft
—
Check one or more comps below to calculate an estimate.
Nearest 10 of 22 comparable sales and listings within 1 mile of this home. Use the filters above and press Search to refine.
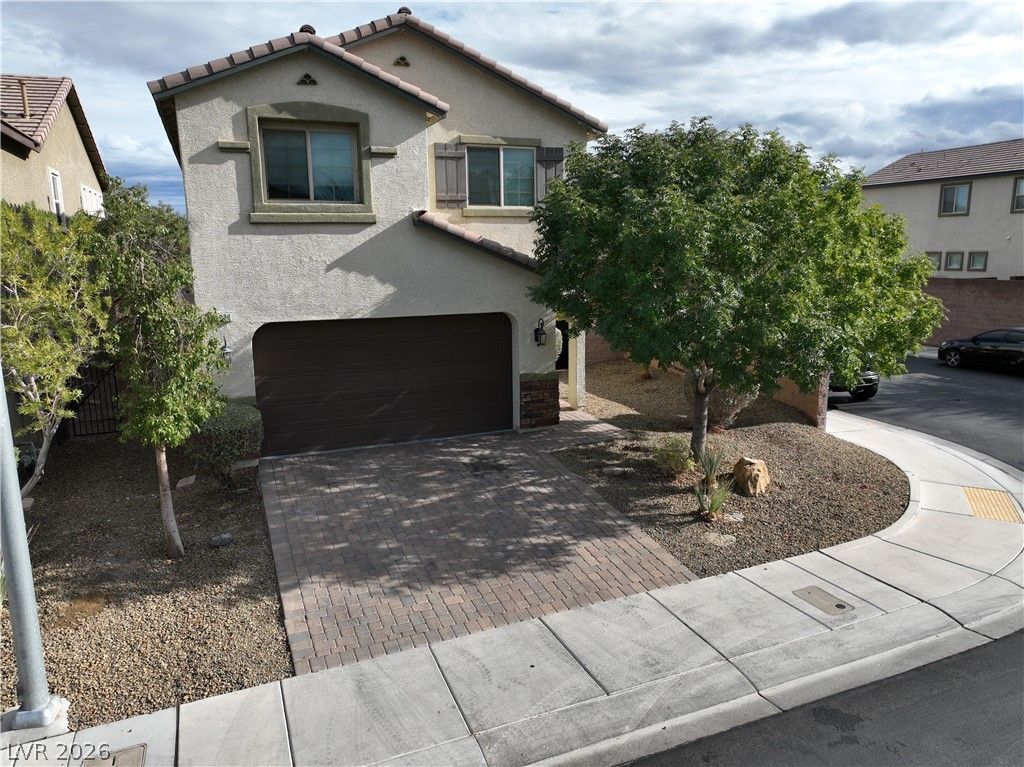
2276 Sky Island DrivePending
$450,0004 bd3 ba1,937 sqft$232/sqft0.08 mi57 days
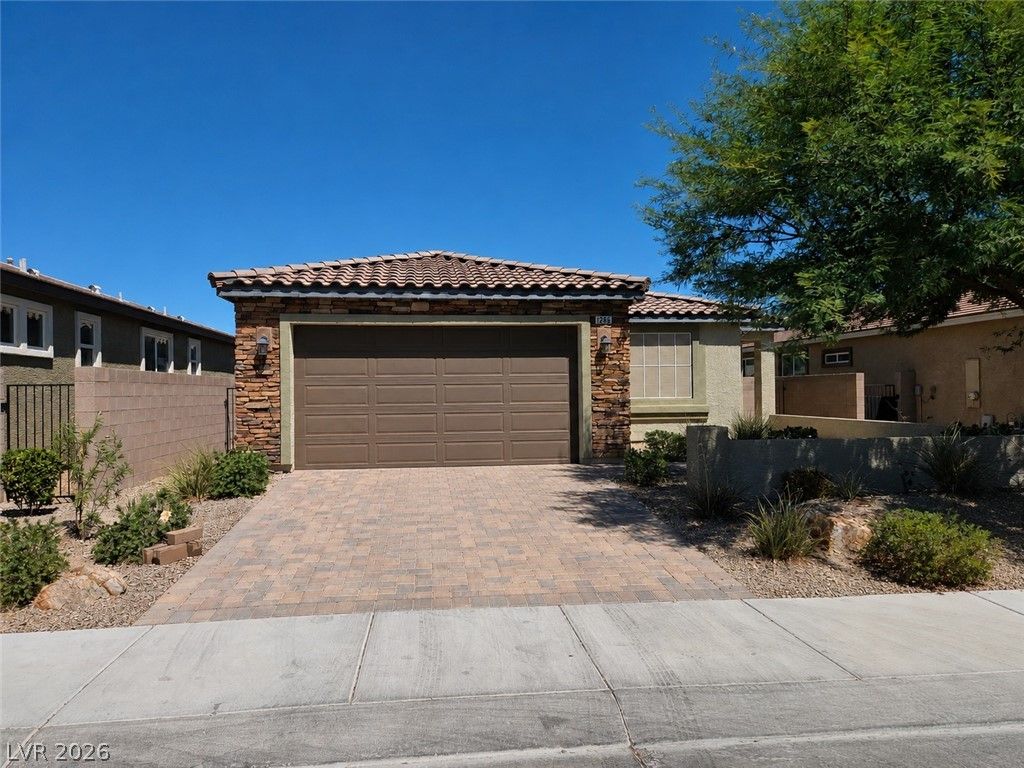
1286 El Solindo LaneActive
$445,0003 bd2 ba1,594 sqft$279/sqft0.09 mi84 days
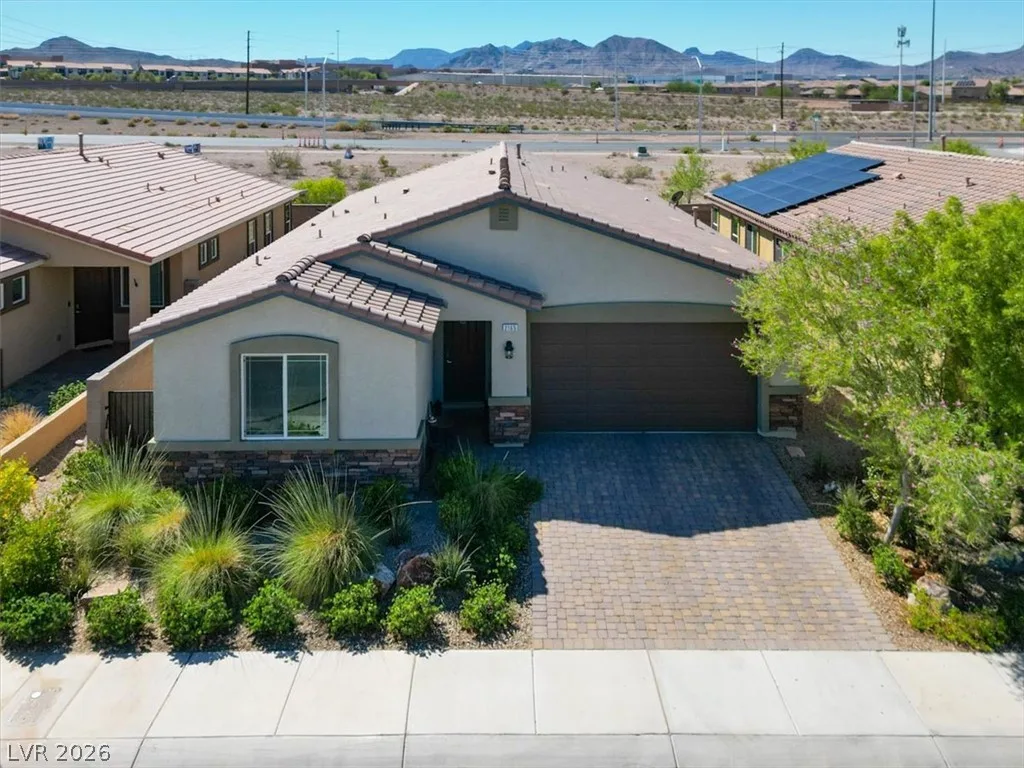
$550,0004 bd3 ba2,035 sqft$270/sqft0.11 mi2 days
$432,0004 bd3 ba1,937 sqft$223/sqft0.12 mi78 daysSold 2026-07-08
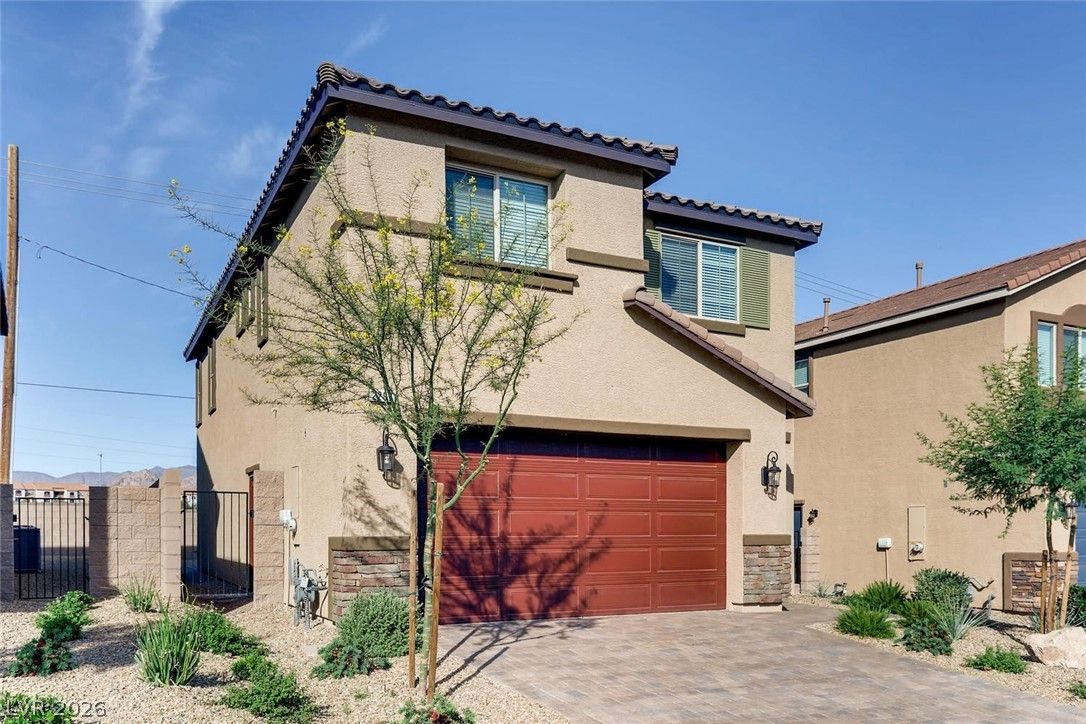
$425,0004 bd3 ba1,937 sqft$219/sqft0.13 mi111 days
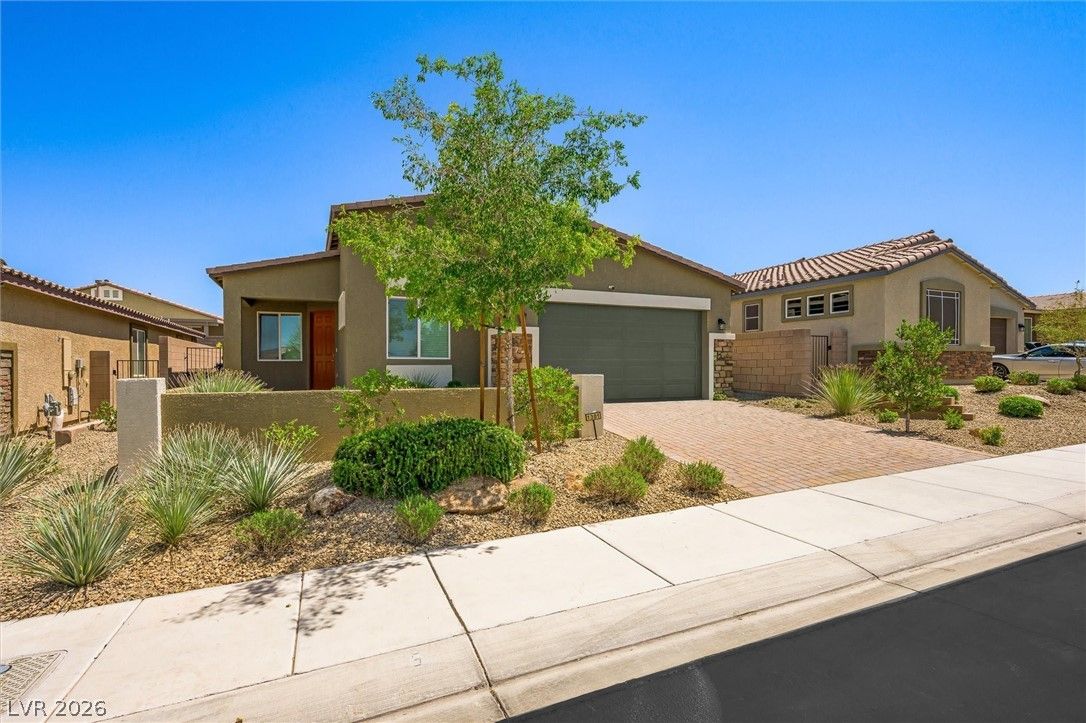
$489,8804 bd2 ba1,824 sqft$269/sqft0.17 mi35 daysSold 2026-07-24
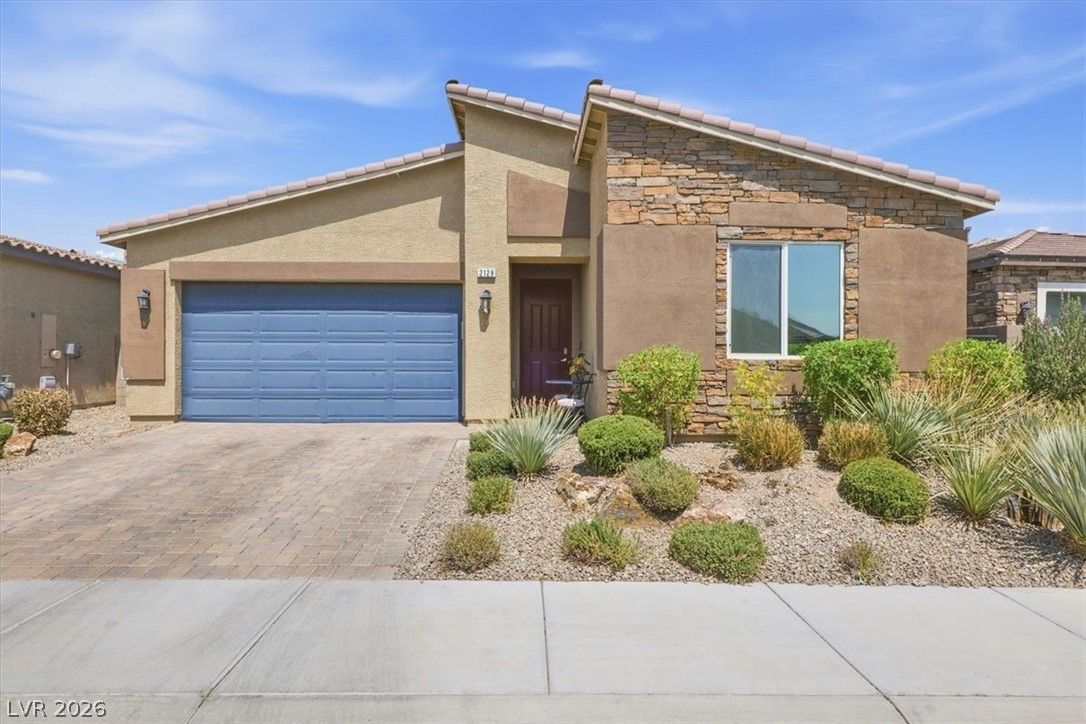
2128 Del Aqua AvenueActive
$525,0004 bd3 ba2,035 sqft$258/sqft0.23 mi0 days
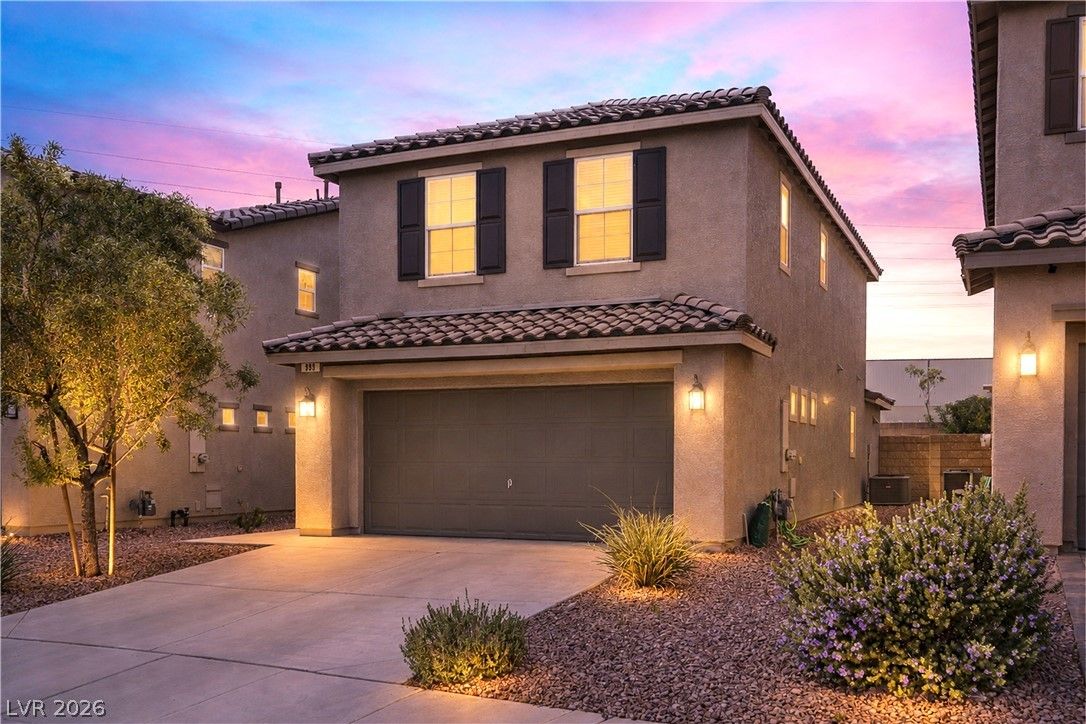
$390,0004 bd3 ba1,659 sqft$235/sqft0.34 mi53 daysSold 2026-09-23
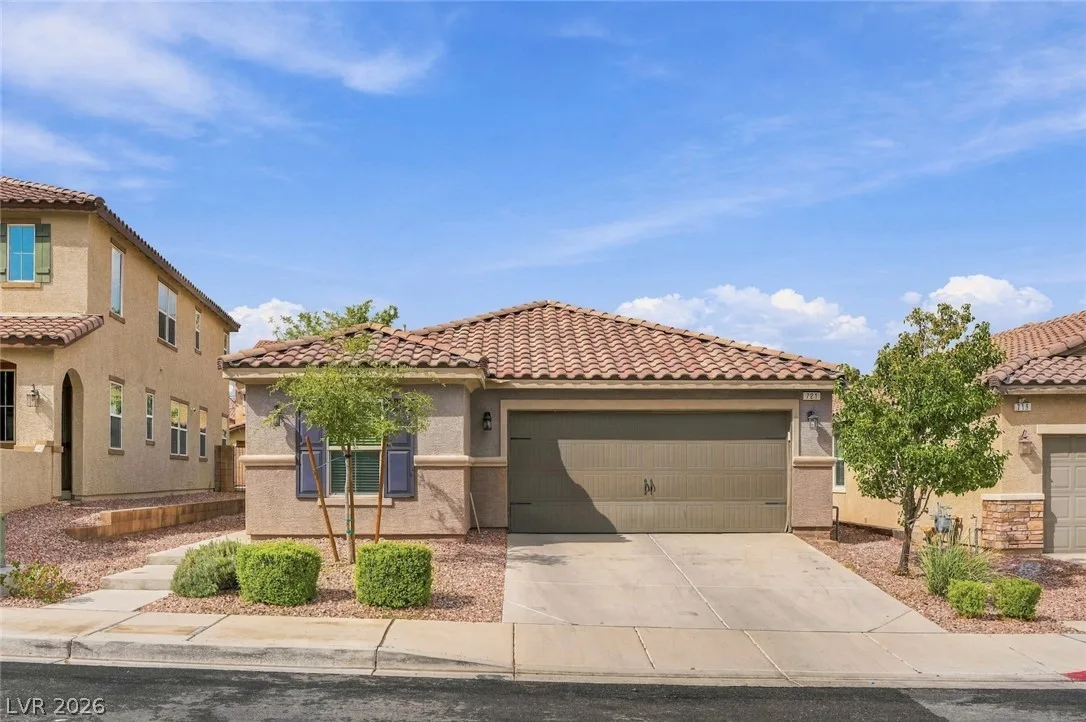
721 Gorringe Ridge CourtActive
$464,9003 bd2 ba1,835 sqft$253/sqft0.37 mi3 days
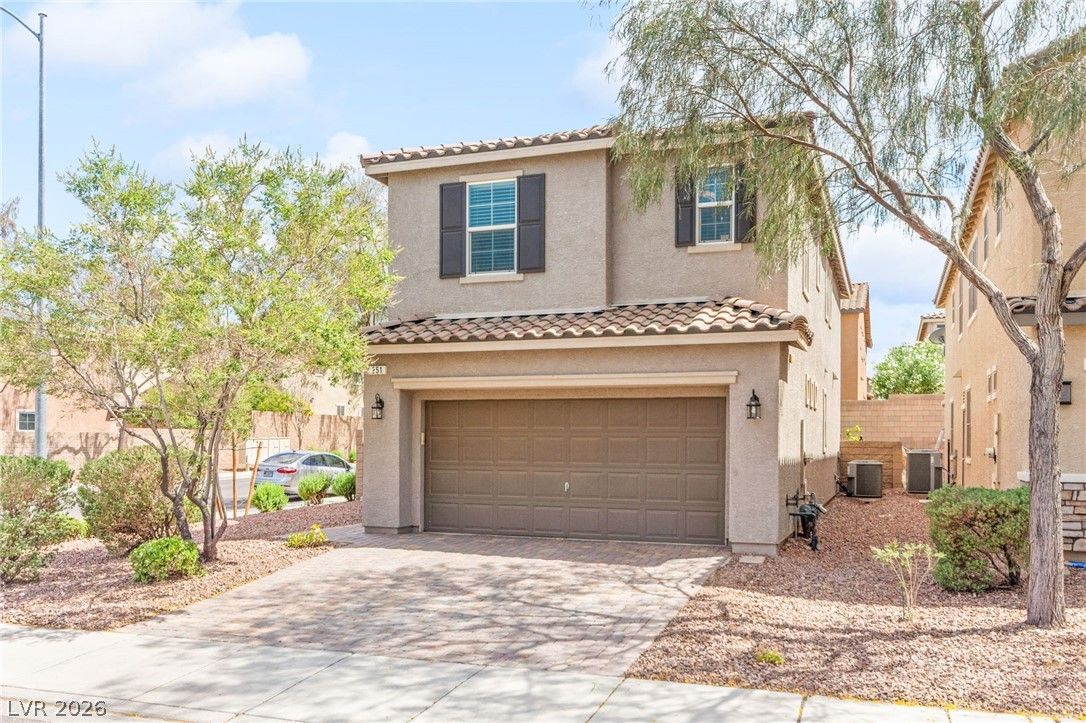
$425,0003 bd3 ba1,847 sqft$230/sqft0.44 mi12 daysSold 2026-07-24
Nearest comparable sales and listings
12 comparables · median price $438,500 · range $390,000 – $550,000 · median $/sq ft $244 · average $/sq ft $245
| Address | Status | Price | $/Sq Ft | Bd / Ba | Sq Ft | Sold / market time | Distance |
|---|---|---|---|---|---|---|---|
| 2276 Sky Island Drive | Pending | $450,000 | $232 | 4 / 3 | 1,937 | 57 days on market | 0.08 mi |
| 1286 El Solindo Lane | Active | $445,000 | $279 | 3 / 2 | 1,594 | 84 days on market | 0.09 mi |
| 2165 Rio Rancho Pointe Place | Active | $550,000 | $270 | 4 / 3 | 2,035 | 2 days on market | 0.11 mi |
| 2289 Sky Island Drive | Sold | $432,000 | $223 | 4 / 3 | 1,937 | Sold 2026-07-08 | 0.12 mi |
| 2297 Sky Island Drive Drive | Active | $425,000 | $219 | 4 / 3 | 1,937 | 111 days on market | 0.13 mi |
| 1301 Luna Del Oro Lane | Sold | $489,880 | $269 | 4 / 2 | 1,824 | Sold 2026-07-24 | 0.17 mi |
| 2128 Del Aqua Avenue | Active | $525,000 | $258 | 4 / 3 | 2,035 | 0 days on market | 0.23 mi |
| 989 Harbor Avenue | Sold | $390,000 | $235 | 4 / 3 | 1,659 | Sold 2026-09-23 | 0.34 mi |
| 721 Gorringe Ridge Court | Active | $464,900 | $253 | 3 / 2 | 1,835 | 3 days on market | 0.37 mi |
| 951 Spiracle Avenue | Sold | $425,000 | $230 | 3 / 3 | 1,847 | Sold 2026-07-24 | 0.44 mi |
| 2444 Belt Buckley Drive | Sold | $395,000 | $220 | 4 / 3 | 1,798 | Sold 2026-09-14 | 0.48 mi |
| 1535 Roping Reed Court | Active | $405,000 | $254 | 3 / 3 | 1,594 | 6 days on market | 0.54 mi |


