
Comparable Sales Near 2579 Anchorgate Drive, Henderson, NV 89052
1st Realty · Comparable sales report · 1st.estate · October 21, 2026
Read the Henderson area guide →
2579 Anchorgate Drive, Henderson, NV 89052
Status: Sold
$600,000 Sold Price
$238
$ / Sq Ft
2,524
Living Area
6,534 sqft
Lot Size
4
Beds
3
Baths
1998
Year Built
Search Parameters
Property Type
Status
Radius
Sold Within
Beds
Baths
Living Area (Sq Ft)
Lot Size (Sq Ft)
This comp search reflects your current search parameters — adjust the filters above as needed for a more accurate estimate.
Estimated Value
—
Average $/Sqft
—
Check one or more comps below to calculate an estimate.
Nearest 10 of 59 comparable sales and listings within 1 mile of this home. Use the filters above and press Search to refine.
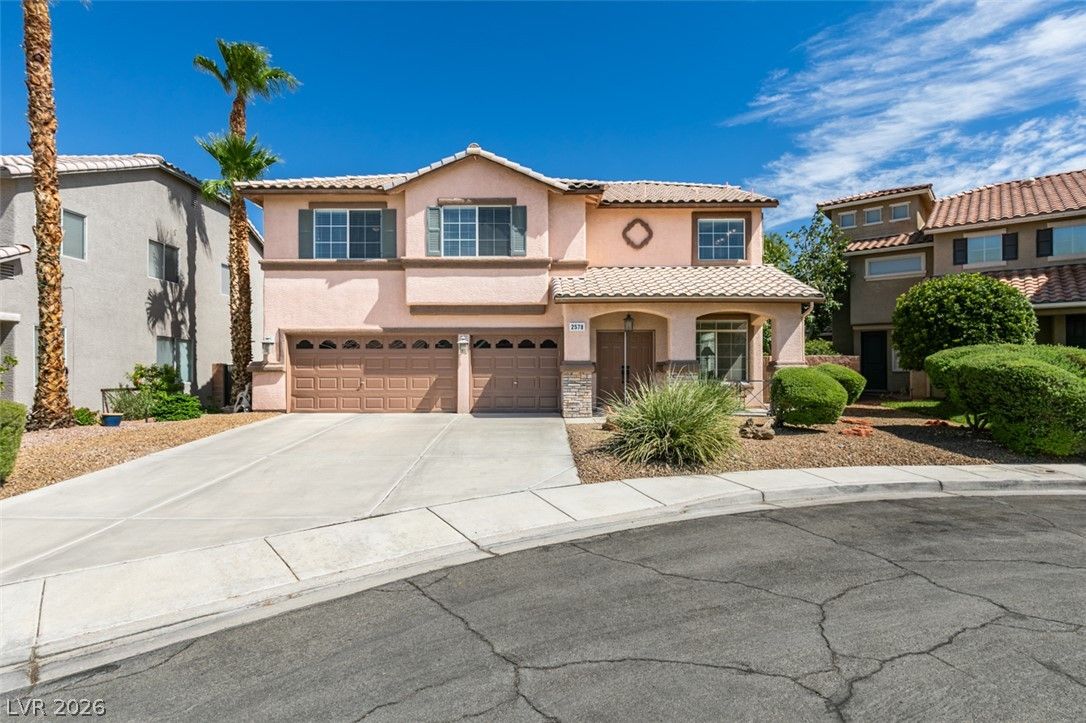
2578 Cornerbrook CircleActive
$715,0004 bd3 ba2,982 sqft$240/sqft0.02 mi52 days
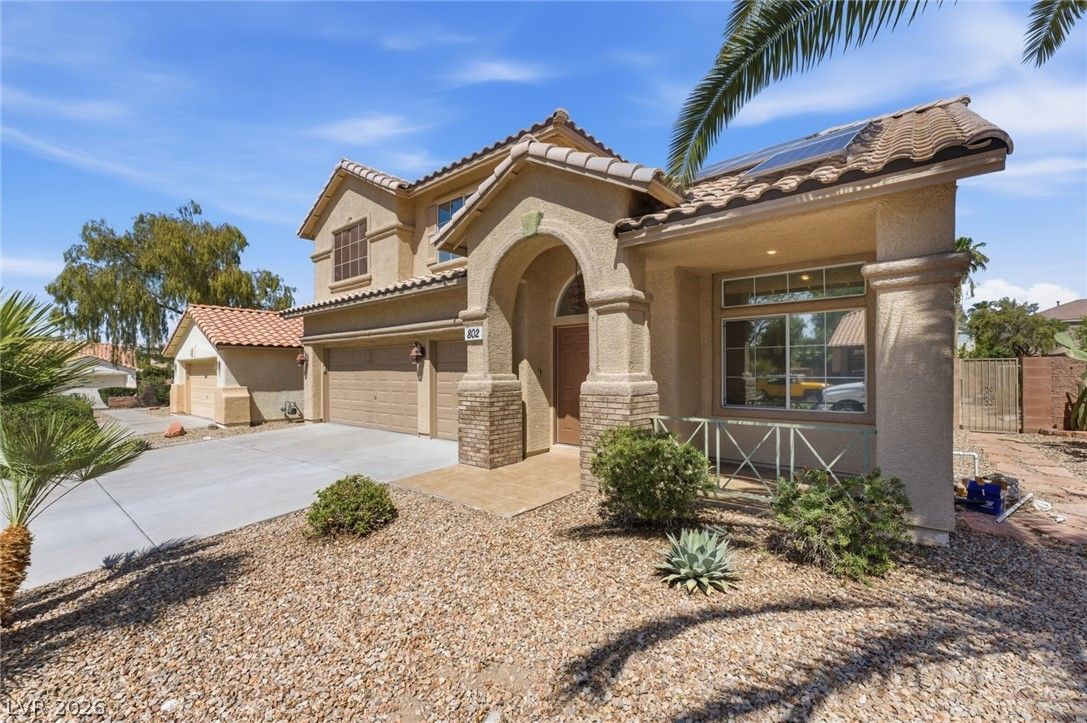
$608,0005 bd3 ba2,283 sqft$266/sqft0.06 mi142 daysSold 2026-10-09
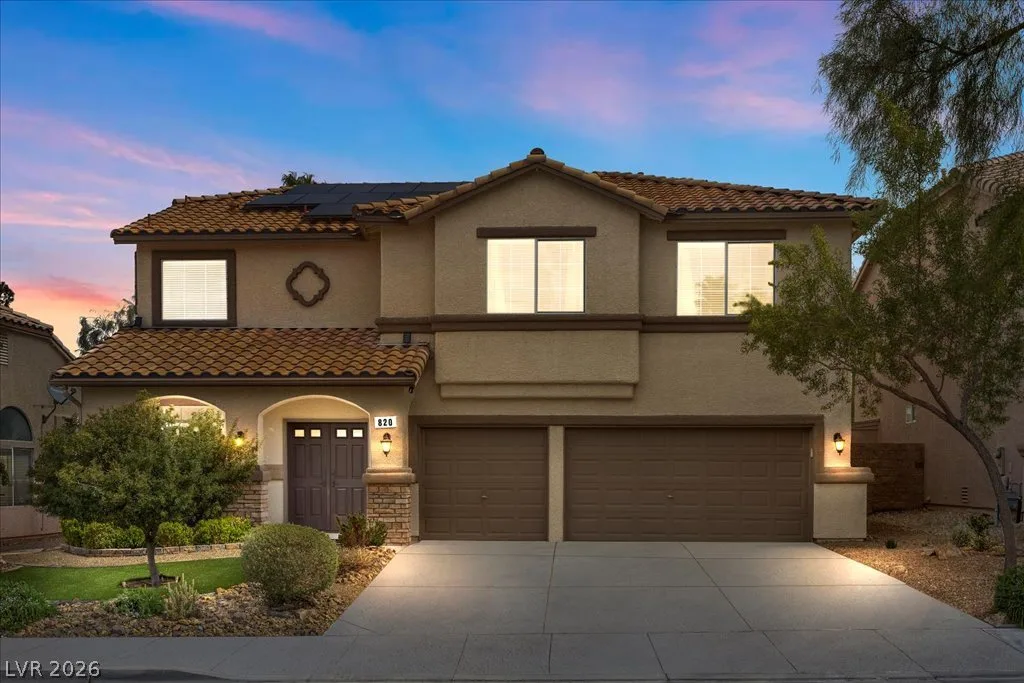
820 Sandhill Sage StreetActive
$725,0005 bd3 ba2,982 sqft$243/sqft0.14 mi3 days

904 Sir Winston StreetActive
$789,9003 bd3 ba2,578 sqft$306/sqft0.14 mi91 days
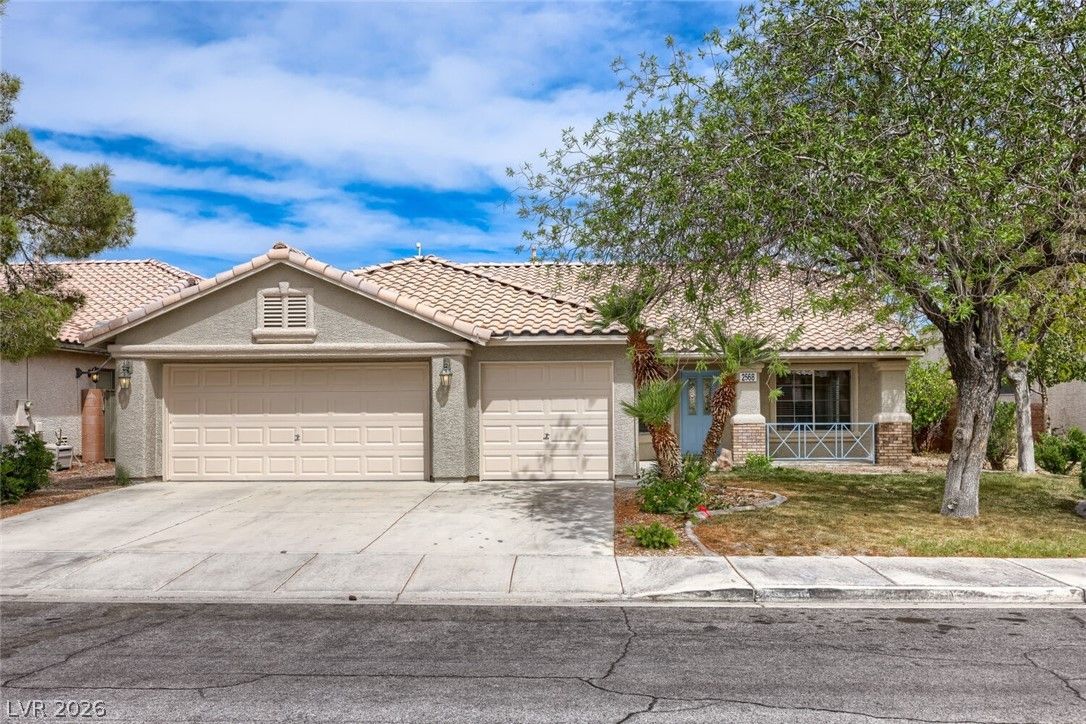
$550,0004 bd2 ba1,980 sqft$278/sqft0.20 mi84 daysSold 2026-08-04
$575,0003 bd2 ba1,980 sqft$290/sqft0.21 mi3 daysSold 2026-06-24
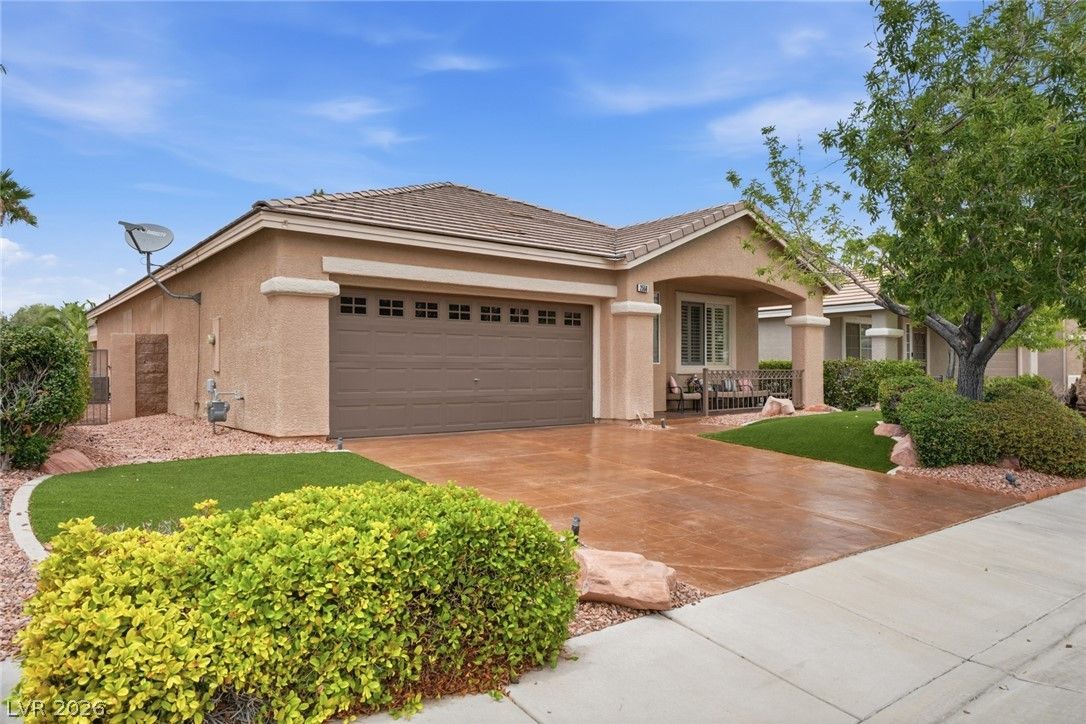
$515,0003 bd2 ba1,963 sqft$262/sqft0.25 mi23 daysSold 2026-09-08
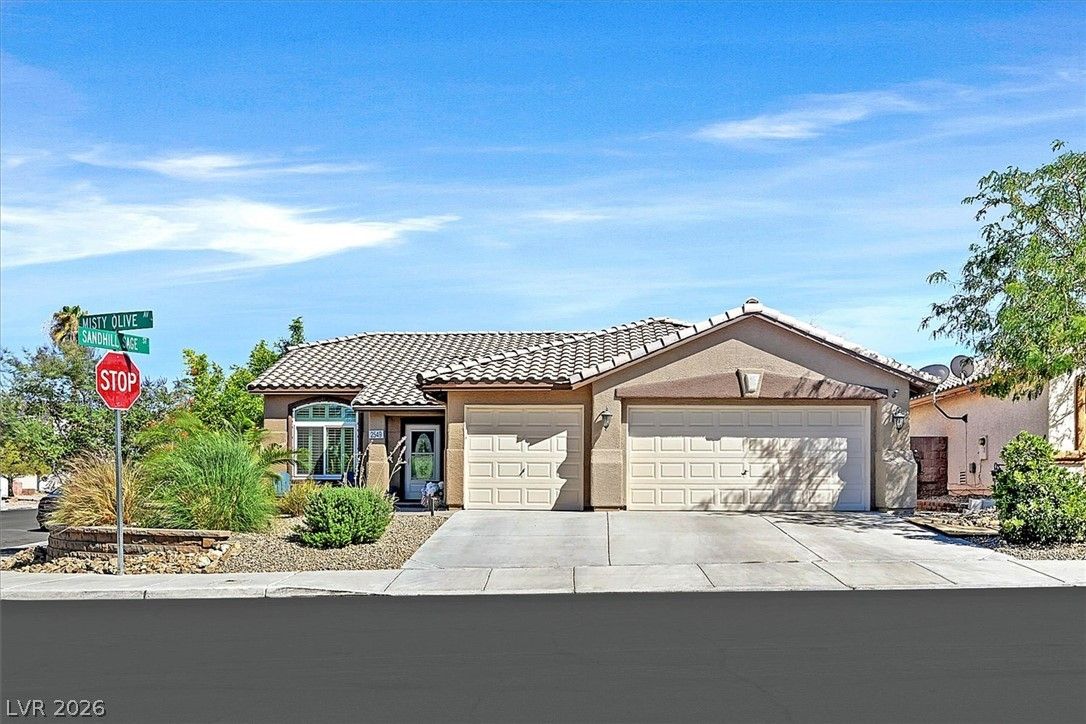
2549 Misty Olive AvenueActive
$565,0003 bd2 ba1,980 sqft$285/sqft0.28 mi73 days
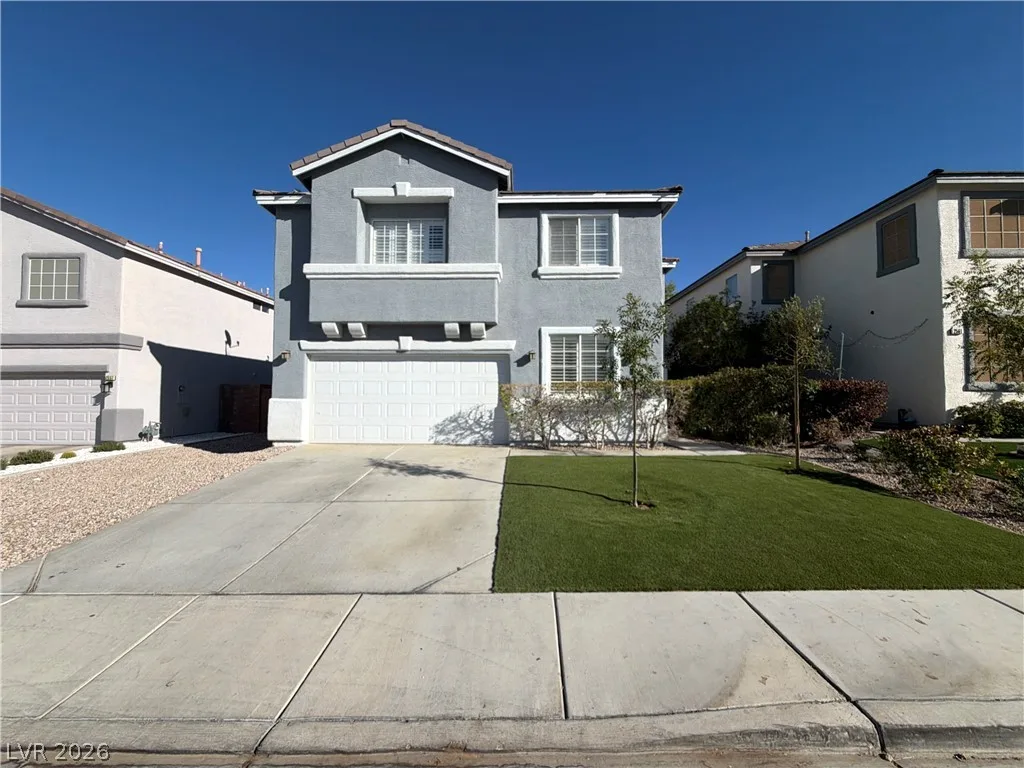
2559 Hitchcock StreetPending
$600,0004 bd3 ba2,486 sqft$241/sqft0.28 mi4 days
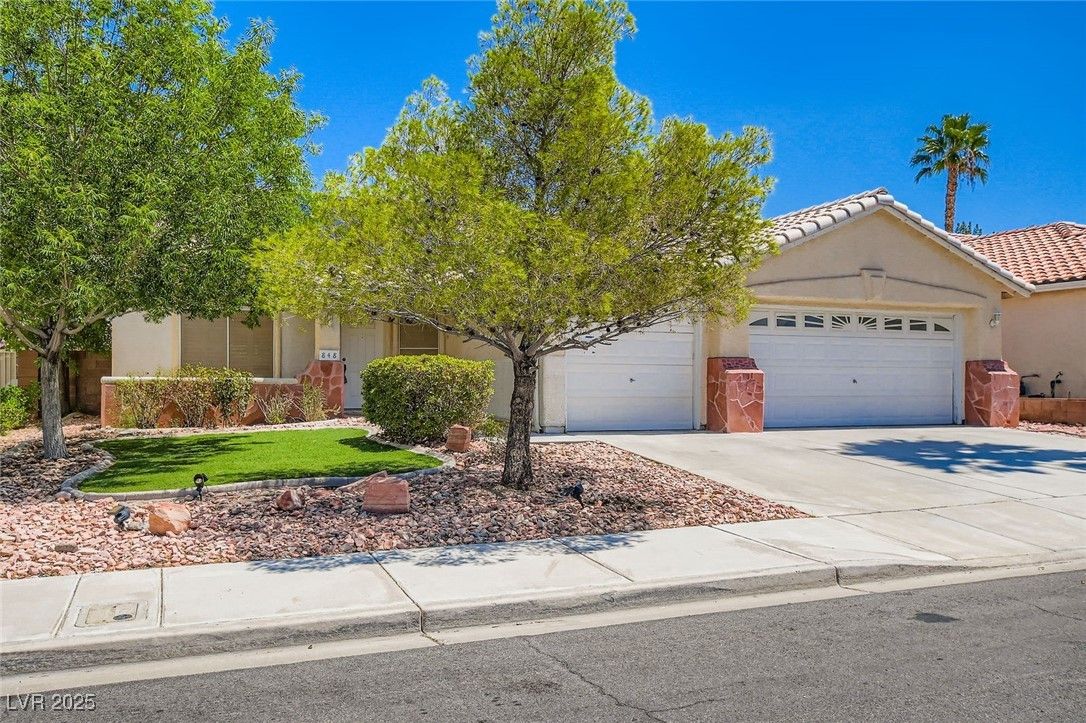
848 Sandhill Sage StreetPending
$510,0004 bd2 ba1,980 sqft$258/sqft0.30 mi124 days
Nearest comparable sales and listings
12 comparables · median price $570,000 · range $505,000 – $789,900 · median $/sq ft $260 · average $/sq ft $262
| Address | Status | Price | $/Sq Ft | Bd / Ba | Sq Ft | Sold / market time | Distance |
|---|---|---|---|---|---|---|---|
| 2578 Cornerbrook Circle | Active | $715,000 | $240 | 4 / 3 | 2,982 | 52 days on market | 0.02 mi |
| 802 Sandhill Sage Street | Sold | $608,000 | $266 | 5 / 3 | 2,283 | Sold 2026-10-09 | 0.06 mi |
| 820 Sandhill Sage Street | Active | $725,000 | $243 | 5 / 3 | 2,982 | 3 days on market | 0.14 mi |
| 904 Sir Winston Street | Active | $789,900 | $306 | 3 / 3 | 2,578 | 91 days on market | 0.14 mi |
| 2568 Golden Bay Court | Sold | $550,000 | $278 | 4 / 2 | 1,980 | Sold 2026-08-04 | 0.20 mi |
| 2560 Golden Bay Court | Sold | $575,000 | $290 | 3 / 2 | 1,980 | Sold 2026-06-24 | 0.21 mi |
| 2558 Hitchcock Street | Sold | $515,000 | $262 | 3 / 2 | 1,963 | Sold 2026-09-08 | 0.25 mi |
| 2549 Misty Olive Avenue | Active | $565,000 | $285 | 3 / 2 | 1,980 | 73 days on market | 0.28 mi |
| 2559 Hitchcock Street | Pending | $600,000 | $241 | 4 / 3 | 2,486 | 4 days on market | 0.28 mi |
| 848 Sandhill Sage Street | Pending | $510,000 | $258 | 4 / 2 | 1,980 | 124 days on market | 0.30 mi |
| 2439 Kaymin Ridge Road | Sold | $565,000 | $223 | 4 / 3 | 2,528 | Sold 2026-09-22 | 0.32 mi |
| 2541 New Morning Avenue | Sold | $505,000 | $255 | 3 / 2 | 1,980 | Sold 2026-06-10 | 0.33 mi |


